Verification Sequences for Incoming High-Pressure Transducer Scope Compliance
Incoming high-pressure transducer compliance verification requires thread geometry checks, insulation resistance testing, proof pressure cycling, and ISO 17025 traceability validation.


Port
Incoming inspection for high-pressure transducers operating above 100 MPa starts at the physical interface. Hydraulic fitting geometry dictates mechanical safety and reading accuracy ~ at these pressures, the fluid compresses while the housing walls expand. On the receiving dock, the first physical check evaluates the thread profile, seating cone angle, and internal cavity volume.
Sensing diaphragms machined straight into stainless steel or nickel-alloy bodies rely on micro-inch finishes across the sealing surface; scratches, burrs, or out-of-round threads distort stress distribution across the body long before pressure is ever applied.
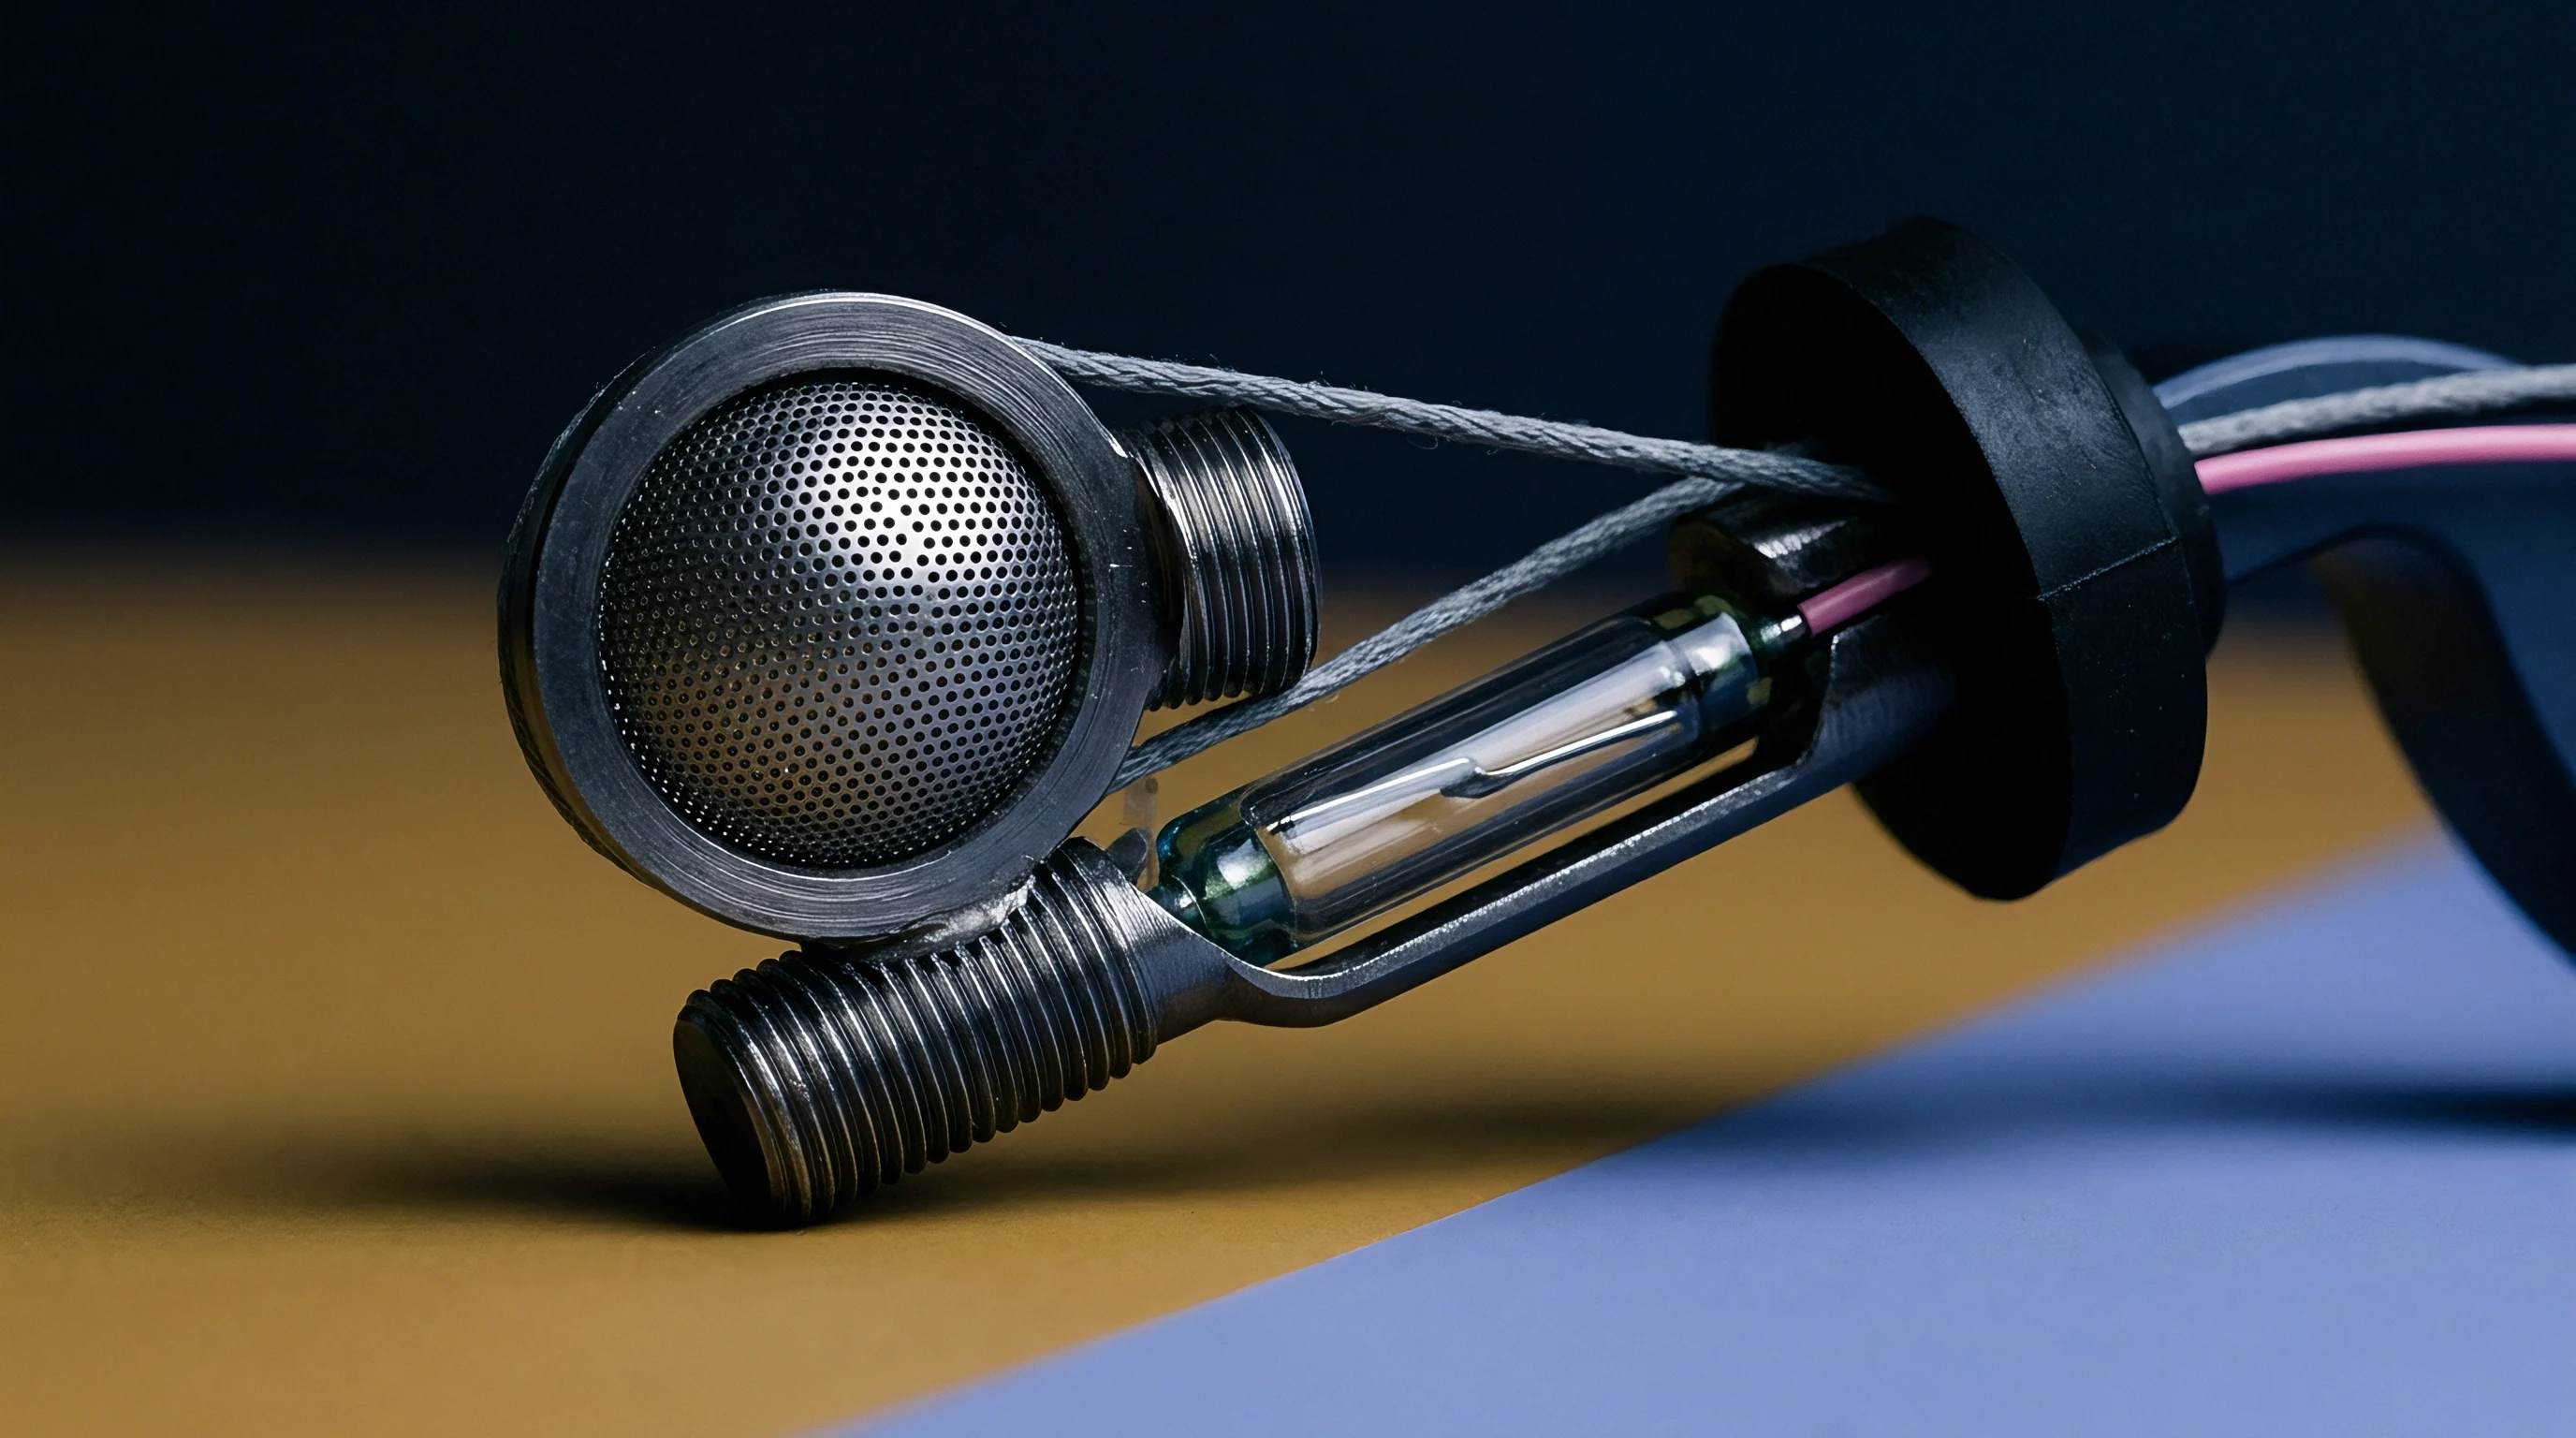
Mechanical Thread Interfacing and Hydraulic Sealing Geometry
Thread engagement transfers the axial clamping force required to seat metal-to-metal cones against hydraulic seals. At pressures between 100 MPa and 1000 MPa, manufacturers specify standardized options like 9/16-18 UNF cone-and-thread fittings, M20x1.5 ports, or custom gland nut assemblies. Incoming quality checks verify thread pitch diameters with calibrated thread ring gauges.
Pitch tolerance errors create localized stress points that transfer mechanical strain to the internal strain gauge bridge, shifting the zero offset before power is even hooked up.
Sealing surfaces require optical inspection under 10x magnification. A cone seal mating at 57 to 60 degrees has to be clear of circumferential chatter marks or radial scoring. A single radial scratch 2 micrometers deep creates a leak path for synthetic hydraulic oil or gaseous nitrogen at high test pressures.
Torquing gland nuts to baseline spec during mounting distorts the body under mechanical preload; an uneven seating face causes asymmetrical strain, shifting the zero point in a way that looks like sensor thermal drift on the test bench.
- Clean the transducer port interface using electronic-grade isopropyl alcohol and oil-free compressed air to remove anti-corrosion shipping grease and particle debris.
- Inspect internal cavity threads and the 60-degree sealing cone under 10x optical magnification, checking for tool marks, metal burrs, or plating flakes.
- Verify thread pitch diameter compliance across all incoming units using calibrated GO and NO-GO thread ring gauges.
- Measure internal cavity fluid displacement volume using a micro-pipette to confirm internal dead-volume matches published datasheet values within a 5 percent margin.
- Mount the unit into a clean stainless steel test manifold using a calibrated torque wrench set to the manufacturer torque specification.
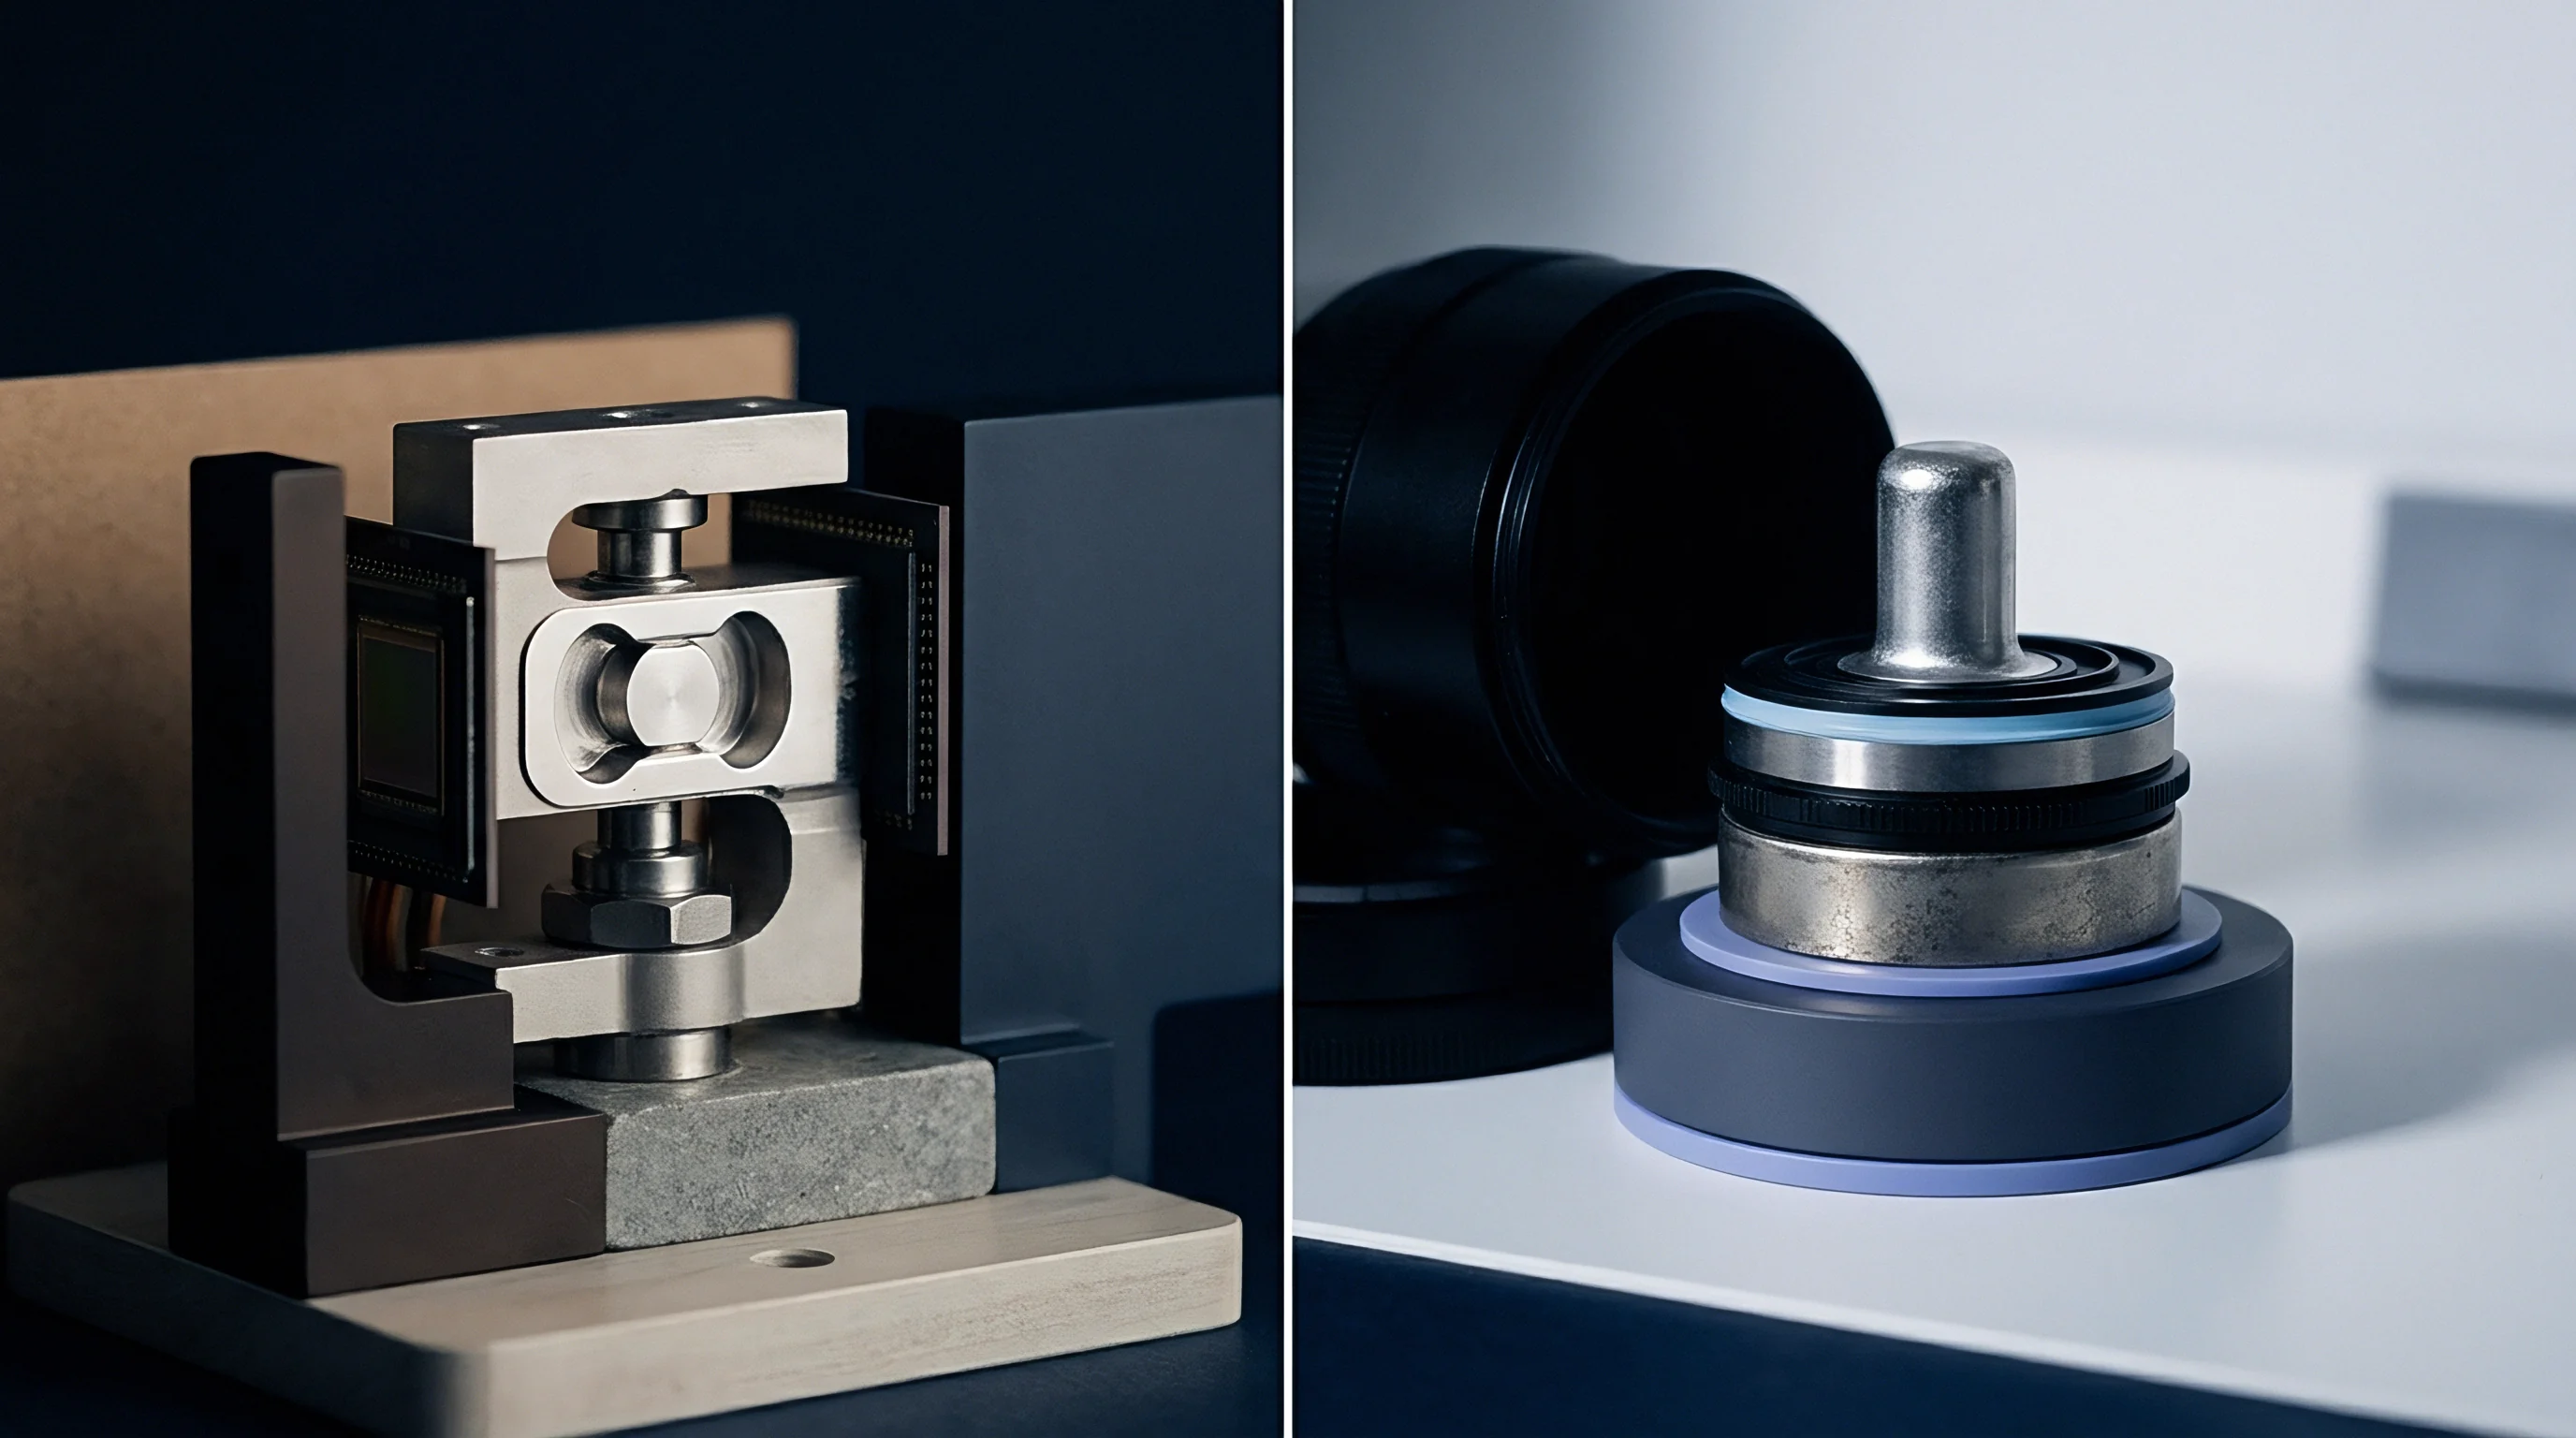
Cavity Fluid Displacement and Entrapped Gas Removal
Internal cavity geometry shapes transient response and hydrostatic pressure transmission. Designing transducers with small internal volumes keeps stored energy under compression low, cutting explosion risks during pneumatic cross-verification. Purging trapped air bubbles from narrow sensing cavities during inspection is critical ~ entrapped gas acts like a spring inside an otherwise rigid fluid column, slowing pressure transmission and causing false dynamic overshoot during rapid step-response tests.
Purging requires flushing fluid under vacuum before applying pressure. Submerging the sensing tip or vacuum-filling the cavity releases micro-bubbles clinging to the diaphragm wall. Oil viscosity dictates how easily gas escapes: low-viscosity synthetic sebacate or silicone fluids let bubbles detach quickly, while heavy mineral oils trap air against internal shoulders.
At 400 MPa, compressed micro-bubbles undergo adiabatic heating, spiking local fluid temperatures and driving temporary thermal zero-shifts in piezoresistive bridge elements.
High pressure ruins seals. Physical inspection verifies housing integrity before attaching pressure lines, saving test benches from fluid contamination. If incoming units arrive with out-of-spec thread dimensions, mechanical clamping generates non-repeatable zero offsets that wreck automated calibration runs.
Adaptors showing minor galling get thrown out ~ micro-particles travel straight into the port and scrape thin-film diaphragms.
A 60-degree seating cone with 0.5-micrometer surface roughness holds 400 MPa pressure without elastomeric backing rings under clean oil testing.
Vendors often blame shipping handlers when threads arrive damaged, claiming protective caps slipped in transit. Quality agreements solve this by stipulating that plastic shipping caps must never contact internal metallic sealing cones, leaving transit damage squarely on the vendor when revealed during receiving inspection.


Excitation
Electrical checks require stable power supplies and signal conditioning before taking output readings from high-pressure sensing elements. Piezoresistive silicon strain gauges and thin-film metallic bridges on high-pressure diaphragms react sharply to excitation instability ~ any voltage fluctuation translates directly into proportional output error. Receiving protocols verify bridge resistance, insulation resistance, and excitation voltage tolerance across the entire operating range specified in vendor contracts.
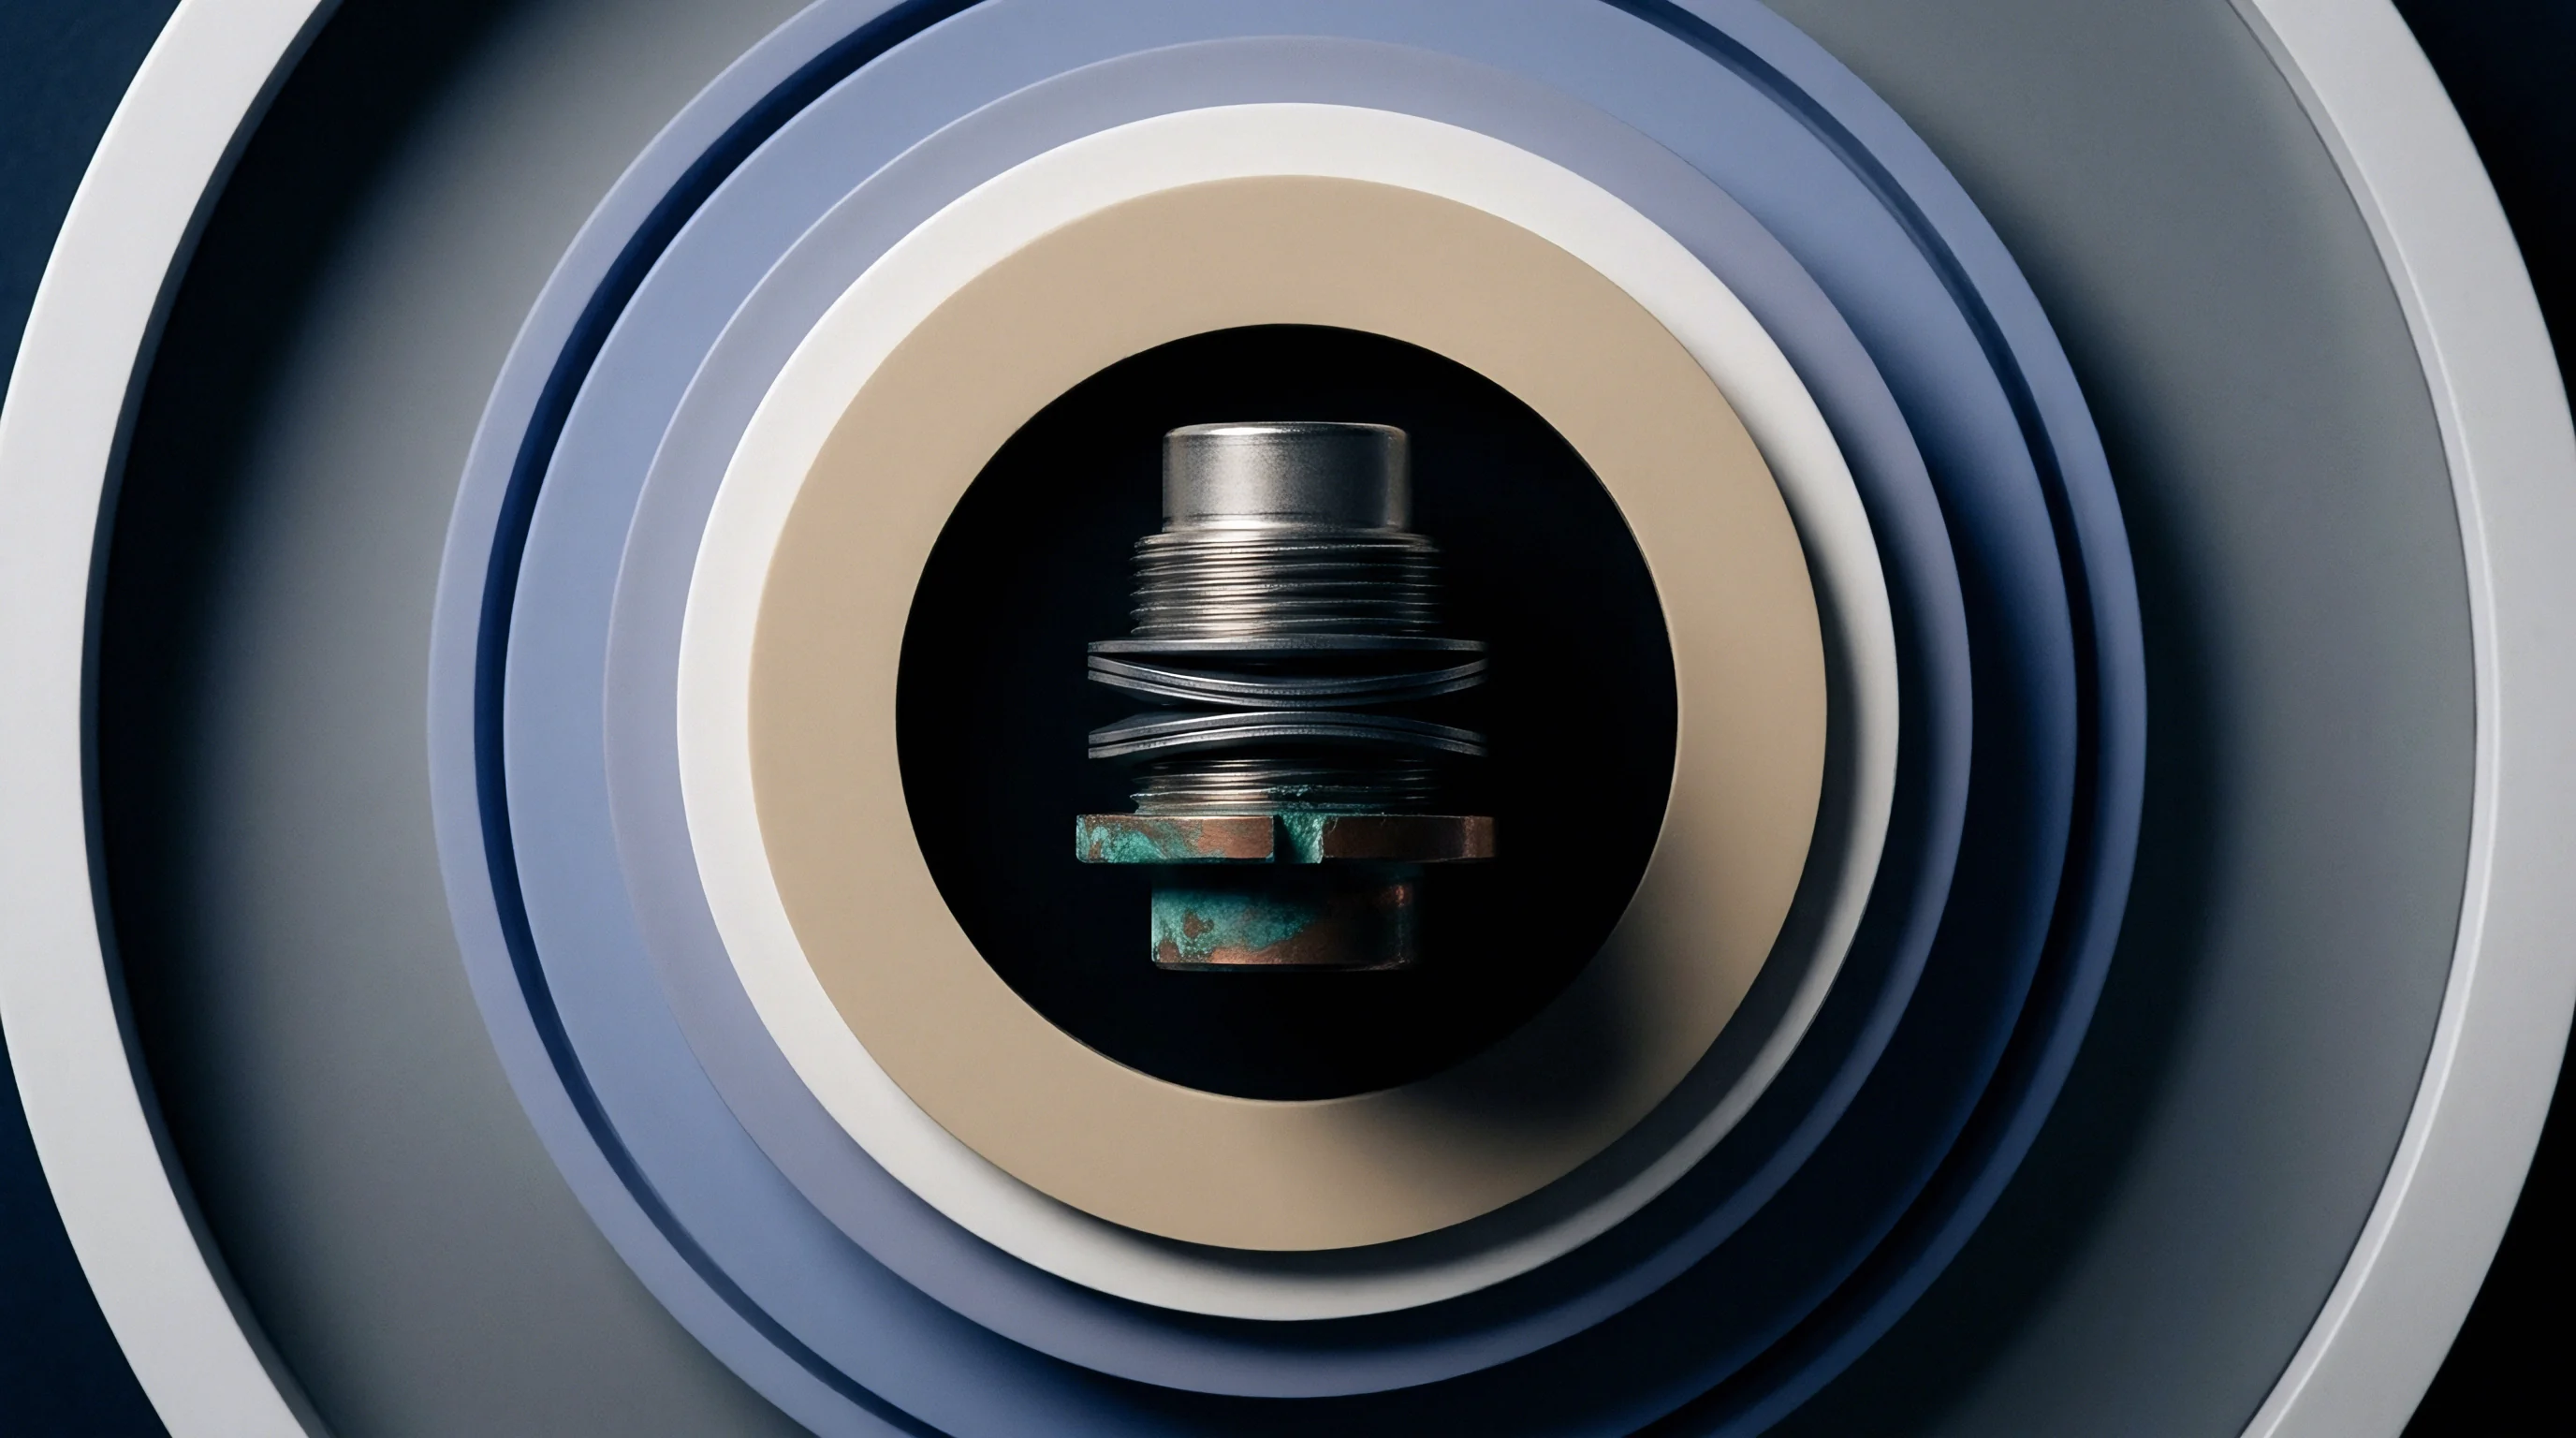
Constant Current Drive versus Constant Voltage Sensing
Driving Wheatstone bridge sensors with constant voltage versus constant current changes how temperature compensation behaves. Constant voltage excitation ~ typically 5 VDC or 10 VDC ~ uses internal series thermistors to correct for the negative temperature coefficient of the silicon gauge factor. Constant current drive, set between 1 mA and 3 mA, uses the positive temperature coefficient of bridge resistance to counter dropping silicon sensitivity as temperatures rise.
Inspection steps have to confirm which excitation scheme matches the internal compensation design before taking baseline zero readings.
Checking input and output bridge impedance with a precision multimeter gives a quick readout of internal circuit health. Unpowered input resistance tests confirm that internal compensation resistors fall within datasheet limits ~ typically 350, 1000, or 5000 ohms nominal. A deviation beyond 2 percent signals damaged strain elements, cracked solder joints, or bad internal wiring.
Output impedance checks confirm bridge symmetry; asymmetric output resistance usually points to localized strain gauge damage from mechanical overload during factory calibration.
Zero-Balance Thermal Drift and Temperature Compensation
Unloaded output stability at room temperature sets baseline zero-balance compliance. Transducers develop microvolt-level zero offsets from residual mechanical stress caused by packaging, electron-beam welding, or glass-to-metal header sealing. Wiring the sensor to a low-noise DC supply with under 50 microvolts ripple permits accurate zero measurements, while monitoring output over a 30-minute warm-up reveals thermal equilibrium dynamic trends and short-term zero wander.
Temperature swings across the housing cause differential expansion between the sensing element, substrate adhesive, and metal diaphragm. Active compensation networks inside the enclosure combine passive precision resistors with temperature-sensing diodes. Measuring zero-balance shift over a tight thermal swing ~ like 18 to 28 degrees Celsius in the receiving lab ~ verifies these internal compensation networks work before starting high-pressure calibration runs.
Thermal equilibrium takes time. Uncompensated temperature gradients inside the housing read like genuine pressure signals during warm-up. Electrical isolation checks between internal bridge wiring and the stainless steel housing run at 50 VDC with a calibrated megohmmeter, requiring resistance above 5000 megaohms.
Lower readings point to moisture, flux contamination, or breaking down wire insulation, leaving data acquisition gear vulnerable to ground loops out in the field.
| Transducer Technology | Nominal Excitation | Bridge Impedance (Ω) | Zero Offset (% FS) | Thermal Zero Drift (% FS/10K) | Insulation Resistance (MΩ) |
|---|---|---|---|---|---|
| Thin-Film Sputtered Strain Gauge | 10 VDC | 1000 ± 50 | ± 0.20 | ± 0.05 | > 5000 |
| Piezoresistive Silicon on Sapphire | 5 VDC or 2 mA | 3500 ± 300 | ± 0.50 | ± 0.10 | > 2000 |
| Foil Strain Gauge on Inconel | 10 VDC | 350 ± 15 | ± 0.30 | ± 0.08 | > 1000 |
| Quartz Crystal Resonator | 12 VDC Digital | N/A (Frequency) | ± 0.05 | ± 0.02 | > 10000 |
- Excitation Voltage Instability creates ratiometric output errors that scale directly with power rail drift, corrupting full-scale voltage readings.
- Bridge Impedance Asymmetry highlights underlying mechanical damage or partial open circuits in internal strain resistor arms.
- Dielectric Insulation Breakdown opens leakage paths between internal signal leads and housing ground, triggering erratic noise spikes.
- Thermal Compensation Resistor Drift causes zero shifts during ambient temperature changes, triggering false low-pressure thresholds.
- Ground Loop Coupling introduces 50 Hz or 60 Hz hum onto high-impedance analogue outputs, masking actual pressure signals.
Missing electrical isolation flaws during incoming excitation checks leads to premature field failures, ground fault trips, and degraded data accuracy that compromises upstream control loops.


Overpressure
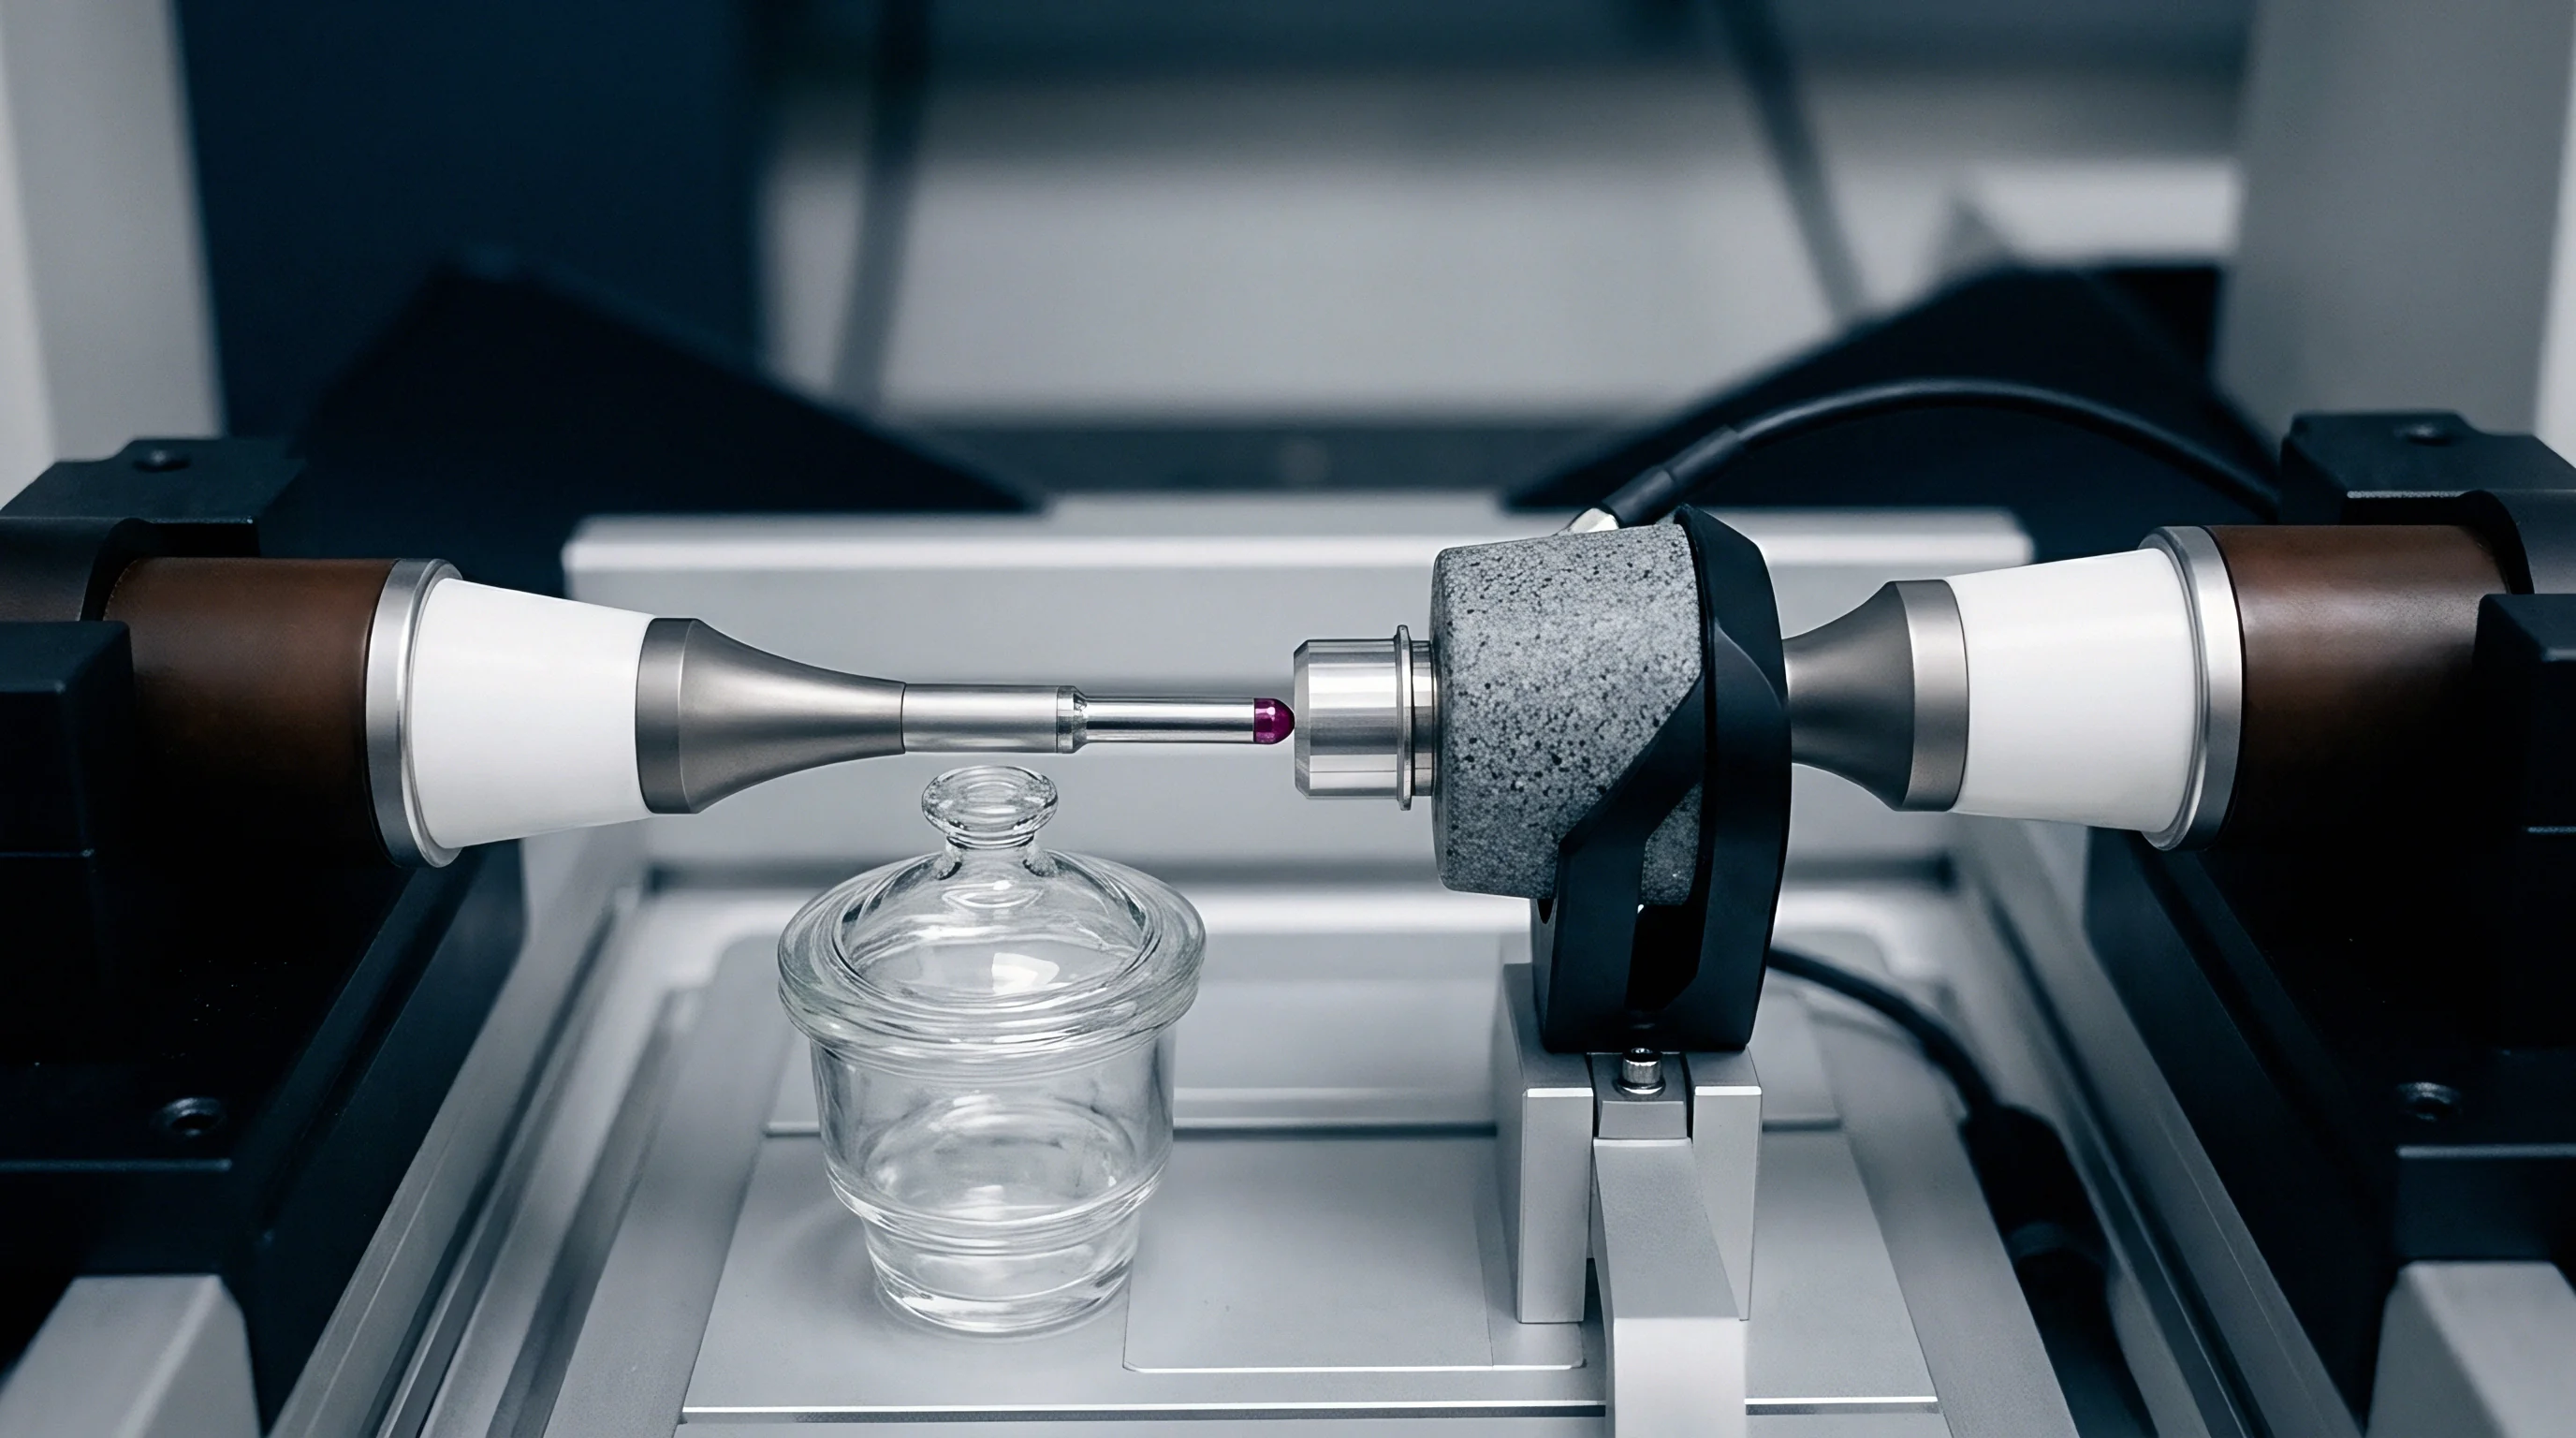
Testing mechanical limits validates housing strength and diaphragm elastic recovery. High-pressure applications subject sensors to heavy static loads, hydraulic hammer, and fast pressure cycling. Overpressure protocols establish whether units handle rated proof limits without permanent diaphragm deformation, zero wander, or span shifts.
Inspection applies hydrostatic pressure steps using calibrated oil deadweight testers or automated hydraulic intensifiers.
Proof Pressure Exposure and Diaphragm Yield Limits
Proof pressure is usually set to 1.5 times full-scale operating pressure up to 400 MPa, dropping to 1.2 to 1.3 times for extreme systems operating up to 1000 MPa. Deflection under proof load must stay strictly within the elastic regime of the diaphragm alloy ~ typically 17-4 PH stainless steel, Inconel 718, or Titanium Grade 5. Pushing past the yield strength causes plastic deformation, showing up as a permanent positive shift in zero-balance output.
Proof testing holds the unit at maximum rated proof pressure for a dwell time of 300 seconds. Pressure during dwell is held within a 0.02 percent window to separate housing leaks from material creep. Reading output at zero pressure after exposure reveals any built-up plastic strain; a zero shift over 0.1 percent of full-scale signals micro-yielding in the diaphragm or adhesive layer, requiring lot rejection.

Cycling Mechanics and Full-Scale Hysteresis Characterization
Pressure cycling measures mechanical hysteresis, non-linearity, and non-repeatability across the full operating range. Hysteresis is the maximum gap between output readings at a given pressure point when approaching from zero versus coming down from full scale. In metal diaphragms under high pressure, it stems from crystal lattice friction, microstructural grain dislocations, and strain energy loss in the sealing joint.
Verification runs three full pressure cycles from 0 to 100 percent of span, recording data at 20 percent increments on both ascending and descending legs. Math processing applies terminal-point or best-fit straight-line algorithms to split non-linearity from hysteresis. Non-repeatability comes from checking reading variance across all three cycles at identical setpoints.
Mechanical relaxation after the first cycle highlights internal stress relief in freshly machined housings.
Proof tests expose hidden yield. A sensor that survives static proof loading might still show unacceptable hysteresis during dynamic cycling. Fluid leaks ruin baseline signals during dwell phases, making it tough to separate sensor drift from manifold pressure drop.
Tracking every deviation along ascending and descending curves ensures internal strain gauges recover their original geometry.
A transducer exhibiting a post-proof zero shift above 0.05 percent full-scale output has entered plastic strain deformation.
| Diaphragm Material | Yield Strength (MPa) | Max Proof Limit (% FS) | Observed Hysteresis (% FS) | Post-Proof Shift (% FS) |
|---|---|---|---|---|
| 17-4 PH Stainless Steel (H900) | 1170 | 150 | 0.08 | 0.03 |
| Inconel Alloy 718 (Aged) | 1100 | 150 | 0.04 | 0.01 |
| Titanium Grade 5 (Ti-6Al-4V) | 880 | 130 | 0.12 | 0.05 |
| Custom 454 Stainless Steel | 1400 | 200 | 0.03 | 0.01 |
A transducer holding its zero baseline within 0.02 percent of span after three full-scale overpressure cycles will maintain its rated accuracy across thousands of operating cycles in the field.
Traceability
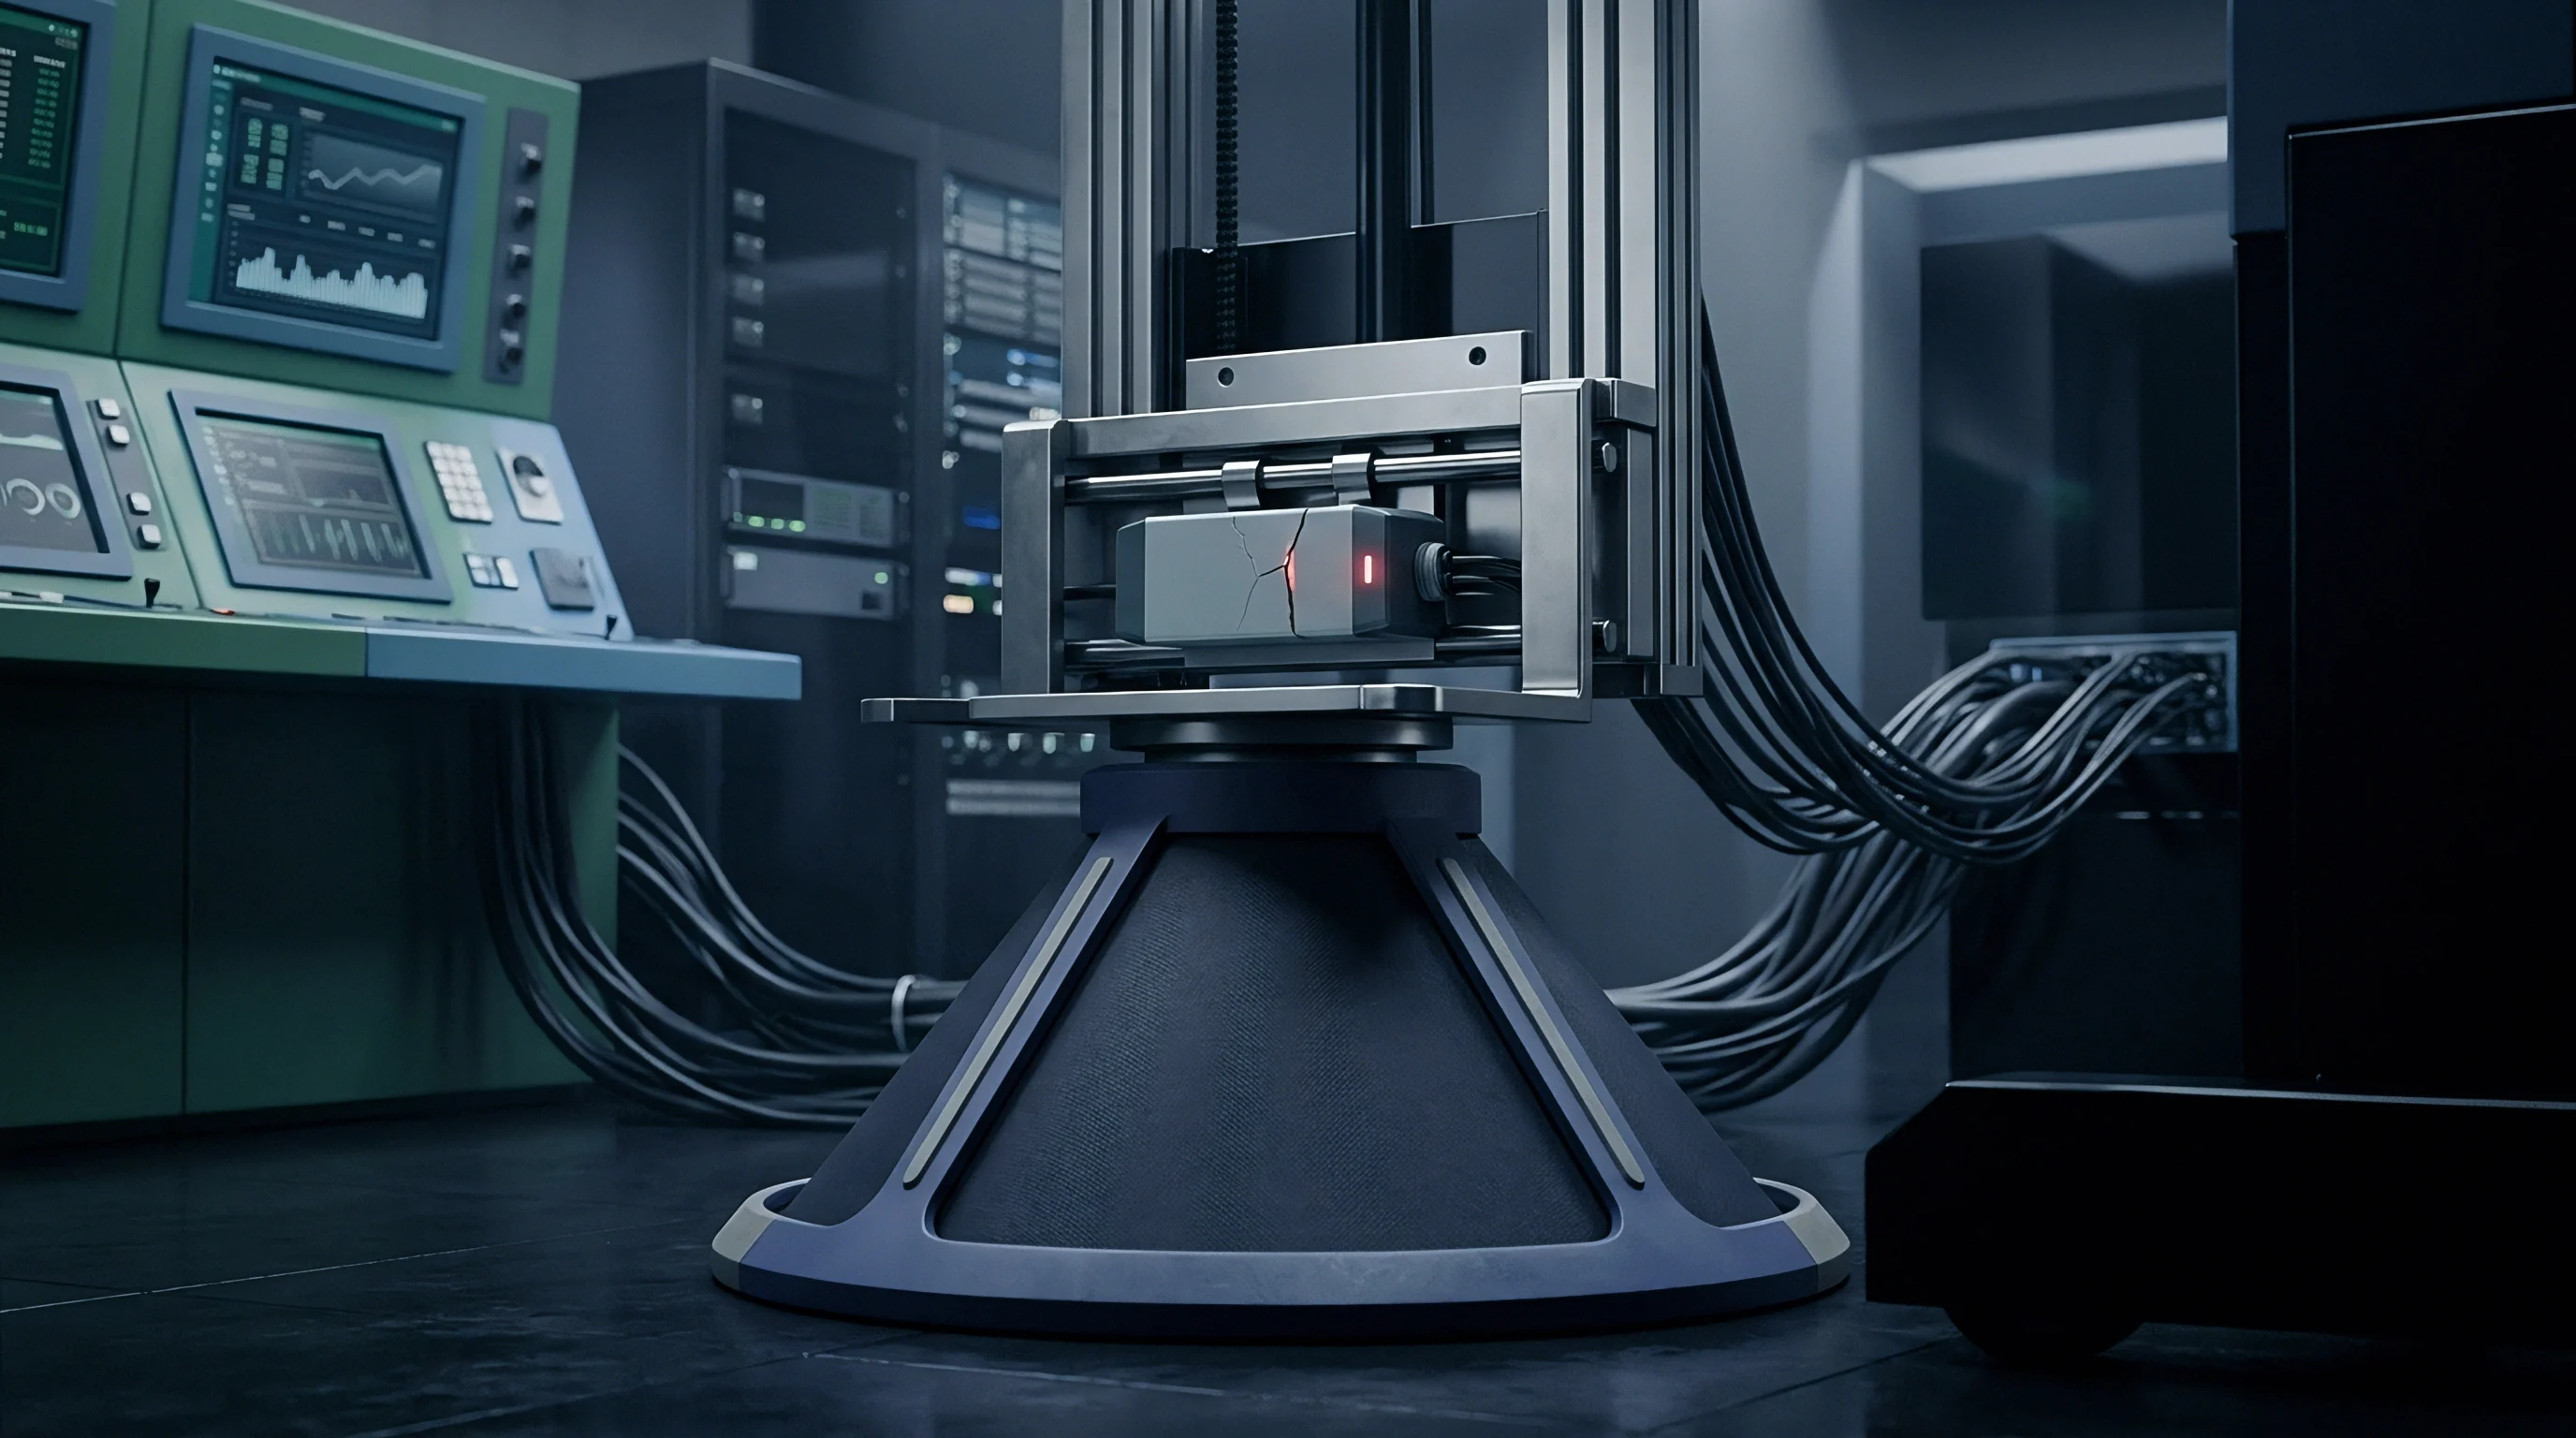
Supplier calibration certificates are only as good as the unbroken chain of measurement uncertainty linking the transducer output to national standards. Verification checks incoming paperwork against international standards ~ specifically ISO/IEC 17025. Auditing primary reference standards, lab accreditation scopes, and uncertainty budgets ensures the unit meets declared specs before installation in high-pressure test loops.

Deadweight Piston Gauges and Primary Pressure References
Primary high-pressure standards rely on deadweight piston gauges, or pressure balances. These instruments generate precise pressure by balancing calibrated mass sets on a rotating piston with a known effective area. Pressure relies on fundamental physical values: mass, local gravity, and piston cross-sectional area.
Corrections for thermal expansion, pressure distortion, and air buoyancy must be applied to hit measurement uncertainties below 0.01 percent of reading at 400 MPa.
Verification checks that the supplier’s primary balance maintains valid traceability to a recognized National Metrology Institute, like NIST, PTB, or NPL. The certificate must state local gravity, piston temperature, and relative humidity during calibration. Piston distortion dominates above 200 MPa as fluid pressure expands the cylinder and compresses the piston; omitting cylinder distortion corrections leaves declared uncertainties understating actual error at maximum pressure.

How Many Calibrations Restore National Standard Linkage?
Direct single-stage transfers from a national metrology institute balance to a vendor’s working standard maintain the lowest combined uncertainty. Every intermediate transfer adds uncertainty from reference hysteresis, thermal shifts, and operator technique. Reviewing certificates means calculating the Expanded Uncertainty ratio between the reference standard and unit under test ~ a minimum Test Uncertainty Ratio of 4:1 is required to support declared accuracy specs.
| Uncertainty Source | Standard Uncertainty Type | Distribution Shape | Sensitivity Coefficient | Uncertainty Contribution (MPa) |
|---|---|---|---|---|
| Mass Set Value Calibration | Type A | Normal (k=2) | 1.00 | 0.0080 |
| Piston Effective Area (A0) | Type B | Normal (k=2) | 1.00 | 0.0120 |
| Piston Distortion Coefficient (lambda) | Type B | Rectangular | Pressure squared | 0.0150 |
| Local Gravity Acceleration | Type B | Normal (k=1) | 1.00 | 0.0020 |
| Thermal Expansion of Piston | Type B | Rectangular | Delta T | 0.0050 |
| Air Buoyancy Mass Correction | Type B | Rectangular | Density ratio | 0.0010 |
| Transducer Resolution & Noise | Type A | Rectangular | 1.00 | 0.0040 |
| Combined Standard Uncertainty (u_c): 0.0215 MPa | Expanded Uncertainty (U, k=2): 0.0430 MPa (0.01075% at 400 MPa) | ||||
Primary standards eliminate guesswork. When reviewing supplier certificates, the expanded uncertainty figure must state a coverage factor of k=2, representing a 95 percent confidence interval. If vendor paperwork leaves out individual uncertainty contributions, we calculate combined standard uncertainty independently.
ISO/IEC 17025 Clause 7.8 requires calibration certificates to report measurement uncertainty alongside physical measurement results with explicit coverage factors.
Contracts invoking ISO 10012 measurement management rules justify lot rejections whenever calibration paperwork lacks traceable reference serial numbers, accreditation logos, or recorded ambient test conditions.

Ingress
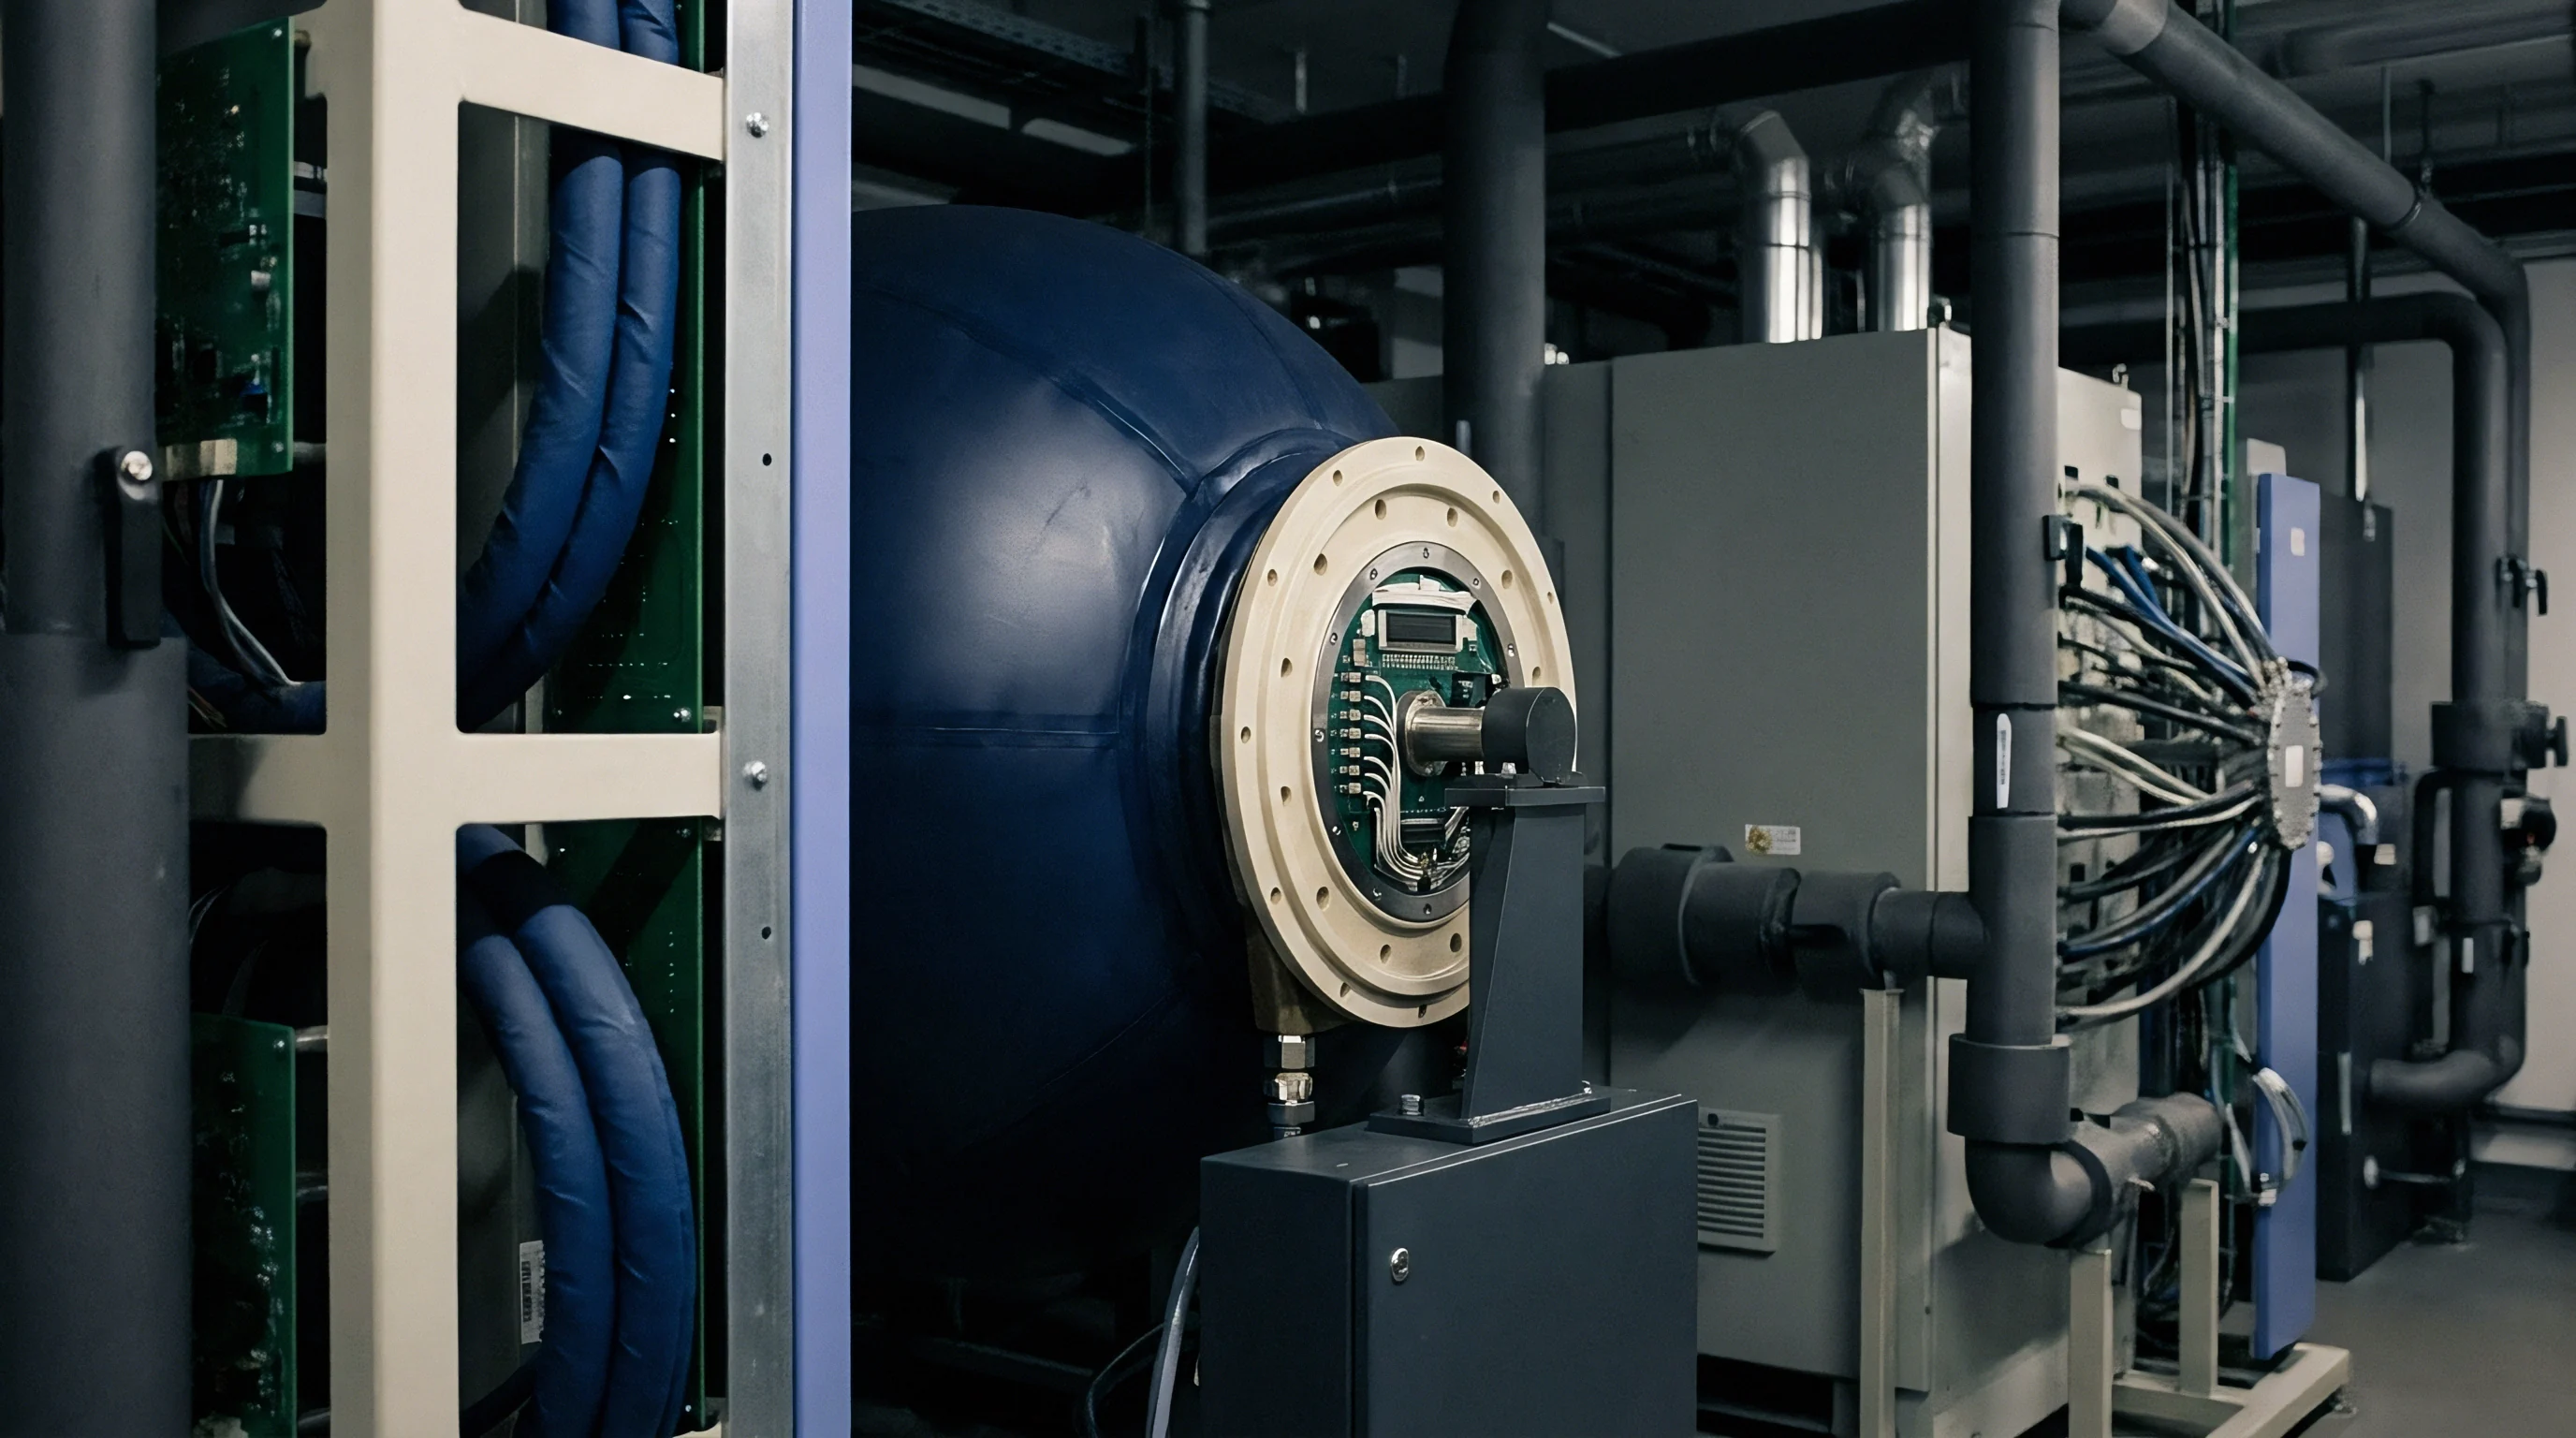
High-pressure transducers operate in harsh industrial environments filled with washdown chemicals, steam, oil spray, or saltwater. Sealing protocols evaluate protection ratings under IEC 60529 standards ~ specifically IP67, IP68, and IP69K. Ingress verification ensures housing joints, connector interfaces, and internal potting shield strain gauges and electronics from fluid intrusion during long field deployments.

Enclosure Sealing and Environmental Protection Testing
Housings use TIG welding, electron-beam welding, or elastomeric O-rings to join outer stainless steel sleeves to sensor pressure headers. Welded joints provide the best hermetic protection against fluid ingress. Leak verification on welded housings relies on helium mass spectrometer testing: the housing is evacuated and placed in a helium chamber.
Any leakage above 1 x 10^-8 atmospheric cubic centimeters per second indicates weld porosity that would allow moisture to creep in over time.
O-ring sealed housings rely on elastomers like Viton, Fluorosilicone, or Nitrile. Chemical compatibility between these seals and ambient process fluids governs long-term sealing stability. For IP67 checks, verification tests submerge incoming units in water with fluorescent dye at a depth of 1 meter for 2 hours.
Optical inspection under ultraviolet light ~ or tearing down the unit ~ reveals whether fluid breached the primary O-rings into electrical cavities.
Cable Gland Strain Relief and Moisture Migration
Electrical entry points are the main failure point for fluid ingress in the field. Cable gland strain reliefs have to grip protective outer jackets without crushing internal wires. Capillary action wicks water down stranded copper conductors if outer jackets cut or seals degrade.
Transducers with integral cables use epoxy or polyurethane potting to block moisture moving along conductor insulation.
- Inspect the outer cable sheath for cuts, abrasions, or jacket diameter variations using vernier calipers.
- Check cable gland torque and strain relief holding power by applying a 100 N axial pull force for 60 seconds while monitoring continuity.
- Run a 24-hour water immersion test at 1 meter depth with the connector mated to its IP67-rated plug.
- Measure insulation resistance between internal signal pins and the outer housing shell before and right after immersion.
- Confirm post-immersion insulation resistance stays above 2000 megaohms at 50 VDC excitation.
Moisture corrodes internal bridge elements. Even trace amounts of water vapor trapped inside an unsealed enclosure condense on silicon piezoresistive elements when temperatures drop, driving sudden zero-drift anomalies. Cable tension also distorts readings if internal wiring pulls directly on delicate solder pads inside unpotted housings.
Submersible sensors rated IP68 for continuous underwater use must state maximum depth and duration limits on compliance spec sheets. Standard IP67 designs struggle under continuous high-pressure spray during industrial washdowns without secondary protective enclosures.
Yield
Acceptance decisions balance inspection costs against the risk of installing drifting or defective transducers in high-value test systems. Incoming yield rates reflect vendor manufacturing quality, packaging, and contract compliance. Tracking lot acceptance metrics, setting practical rejection thresholds, and auditing recalibration costs over operational lifespans form the commercial foundation of high-pressure sensor procurement.
Commercial Acceptance Thresholds and Rejection Economics
Quality programs set Acceptable Quality Limit criteria following ISO 2859-1 sampling protocols. Receiving batches undergo sampling based on lot size and risk level. For critical aerospace, oil-and-gas, or automotive crash-test rigs, high-pressure transducers undergo 100 percent verification rather than sample inspection.
A single unit failing zero-offset, proof pressure, or insulation checks triggers a full lot quarantine.
Rejection economics weigh bench testing costs against system downtime and warranty exposure. Running a full 7-point calibration, insulation test, and helium leak check on an incoming transducer costs 150 to 300 USD per unit. Installing an unverified sensor that fails in service triggers line flushing, fluid loss, system requalification, and engineering teardown that easily clears 10,000 USD per incident.
Catching bad parts at receiving yields immediate savings.

Recalibration Frequency and Total Lifecycle Ownership Cost
High-pressure transducers slowly drift as operating cycles pile up. Sputtered thin-film models typically hold annual drift below 0.1 percent of full-scale output under normal conditions. Piezoresistive units exposed to heavy thermal cycling can see zero drift reach 0.25 percent of span per year.
Setting ideal recalibration intervals requires tracking historical drift data across specific transducer models and operating environments.
Total ownership cost models combine purchase price, incoming verification labor, routine recalibration fees, and replacement cycles over a 5-year horizon. Cheaper transducers with unverified accuracy claims push up lifecycle expenses through field failures, re-testing overhead, and frequent recalibration. Higher-tier transducers with certified low-drift performance and thorough verification paperwork cut costs by stretching calibration intervals from 12 months out to 24 or 36 months.
Sensor drift skews yield metrics across automated production lines relying on precise hydraulic force feedback. Rigorous incoming verification establishes a trustworthy baseline, protecting downstream quality and ensuring full compliance throughout the sensor’s service life.