Predicting Long Term Seal Interface Pore Expansion under Thermal Cycling and Liquid Hydrocarbon Exposure
Predict seal pore expansion by combining Flory-Rehner swelling kinetics with continuous ISO 3384 counterforce logging across minimum thermal cycle troughs.

Interface
A static elastomeric seal maintains isolation when contact stress exceeds the differential pressure of the contained fluid across every interconnected path. In liquid hydrocarbon service, fluid sorption alters this boundary by lowering the shear modulus and swelling the polymer matrix. When thermal cycling superimposes alternating thermal expansion mismatches, micro-scale voids along the tool-machined asperities undergo ratcheting growth.
Predicting this void volume expansion requires tracking three coupled drivers: plasticization from hydrocarbon uptake, differential thermal contraction during temperature swings, and the irreversible accumulation of compression set.
Initial sealing depends on asperity flattening. An unaged fluorocarbon (FKM) or nitrile (NBR) seal under 25 percent nominal squeeze generates an initial peak contact stress between 8 MPa and 15 MPa against a surface finish of 0.4 to 0.8 micrometers Ra. As hydrocarbon aromatics penetrate the elastomer network, polymer chains disentangle, reducing crosslink density and dropping the contact stress. The resulting loss of sealing force allows microscopic gaps between the seal and metal flange to dilate.
When temperature drops from a peak operating state of 150 degrees Celsius down to ambient or sub-zero conditions, the elastomer contracts roughly ten times faster than the surrounding steel, opening inter-asperity channels.
Hydrocarbon permeation rates scale directly with temperature and fluid composition. Low molecular weight aromatic hydrocarbons induce volumetric swelling between 5 percent and 40 percent in standard elastomers. This expansion initially counteracts seal relaxation by increasing radial force against the groove wall.
During prolonged exposure, the fluid extracts soluble plasticizers and processing aids from the vulcanizate. Subsequent thermal cycles or dry-out phases drive out volatile fractions, leaving an elastomer network with reduced volume, increased glass transition temperature, and microscopic voids that function as continuous leak paths.
A sub-zero thermal excursion strips contact stress faster than fluid re-absorption can replenish network volume.
Predicting long-term interface pore expansion requires treating the seal-flange boundary as a dynamic percolation network. The critical pore diameter at which capillary seal integrity fails is governed by the Young-Laplace relation:
P_cap = (2 gamma cos(theta)) / r
where gamma is the hydrocarbon surface tension, theta is the contact angle on the degraded polymer, and r is the mean hydraulic radius of the interfacial void. Liquid hydrocarbons exhibit low surface tension, typically 20 to 30 mN/m, yielding capillary resistance values below 0.1 MPa for pores wider than 0.5 micrometers. As thermal cycling drives pore radii beyond this threshold, system pressure overcomes capillary resistance, establishing laminar leakage governed by Poiseuille flow.
The standard procurement specification often assumes an initial compression set measurement under static air represents field longevity. It fails to capture fluid extraction dynamics. Thermal cycling accelerates physical relaxation via chain slippage while chemical degradation severs network backbones.
Tracking interface pore evolution demands continuous measurement of contact stress degradation, volumetric change under fluid immersion, and low-temperature elastic recovery.
The cost of underestimating this degradation surfaces in the field as uncontained fugitive emissions and off-specification instrumentation readings that trigger complete process shutdowns.


Swelling
Solvent uptake follows Fickian diffusion modified by polymer relaxation mechanics. When an elastomer contacts liquid hydrocarbons, solvent molecules migrate into free volume pockets within the polymer network. The driving force is the thermodynamic affinity between the hydrocarbon species and the polymer backbone, quantified by the Flory-Huggins interaction parameter chi.
The swelling equilibrium volume fraction of rubber, v_r, relates to crosslink density through the Flory-Rehner equation:
– = V_1 n_e (v_r^(1/3) – v_r / 2)
where V_1 is the molar volume of the penetrant hydrocarbon and n_e is the effective crosslink density in moles per unit volume. For high-aromatic fuel blends, chi drops below 0.3 in standard nitrile grades, driving aggressive fluid absorption that softens the sealing land.
Diffusivity is not constant over thermal cycles. At 23 degrees Celsius, the diffusion coefficient D for pentane in fluoroelastomers sits near 1.2e-8 cm2/s, escalating to 4.5e-7 cm2/s at 120 degrees Celsius. Cyclic heating drives rapid hydrocarbon ingress into the seal core.
Cooling cycles subsequently create supersaturated zones at the outer skin where volatile hydrocarbons boil off or migrate during pressure drops. This pumping action leaches low-molecular-weight plasticizers out of the vulcanizate.
Extraction and Free Volume Shift
Plasticizer extraction permanently alters the polymer structure. Ester plasticizers blended into low-temperature NBR formulations leach into circulating hydrocarbons within 500 hours of hot operation. Once extracted, the baseline glass transition temperature (Tg) shifts upward by 8 to 15 degrees Celsius.
A seal specified for service down to -40 degrees Celsius may undergo glass transition at -25 degrees Celsius after six months of fuel immersion.
Loss of free volume manifests during cold cycles as rapid micro-cavitation. The polymer matrix contracts while vitrified, preventing the elastomeric asperities from compliant filling of the metal machining marks. The interfacial pores expand along the machining lay, creating direct paths across the seal width.
| Elastomer Type | Hydrocarbon Medium | Test Temp (C) | Diffusion Coeff (cm2/s) | Volume Swell (%) | Hardness Change (Shore A) |
|---|---|---|---|---|---|
| NBR (28% ACN) | Toluene/Isooctane (50/50) | 23 | 3.1e-7 | +42.5 | -18 |
| NBR (40% ACN) | Toluene/Isooctane (50/50) | 23 | 8.4e-8 | +18.2 | -9 |
| FKM (Bisphenol) | Diesel Fuel (EN 590) | 100 | 1.5e-7 | +2.1 | -2 |
| FKM (Peroxide) | B20 Biodiesel | 125 | 3.2e-7 | +5.4 | -4 |
| FFKM (Perfluoro) | Gas condensate (wet) | 150 | 6.7e-8 | +1.2 | 0 |
| HNBR | Crude oil (sweet) | 80 | 2.1e-7 | +8.6 | -6 |
Data recorded in the table demonstrates the protective effect of higher acrylonitrile (ACN) content or fluorination against swelling. High-ACN nitrile suppresses solvent uptake by increasing polar resistance, but exhibits inferior low-temperature resilience. Fluoroelastomers provide lower volume change under aromatic exposure, yet remain susceptible to base attack and seal squeeze loss if amine corrosion inhibitors are present in the hydrocarbon stream.
Suppliers routinely argue that swelling compensates for physical relaxation by wedging the elastomer tighter into its groove. This mechanism provides short-term containment during static isotherm exposure. Over thermal sweeps, the swollen compound extrudes into clearance gaps under peak thermal expansion.
When the cycle reverses, the extruded material tears or takes rapid compression set, leaving large interfacial pores at the cold return.


Relaxation
Contact stress relaxation proceeds along two distinct fronts: physical viscoelastic rearrangement and chemical crosslink degradation. Viscoelastic relaxation dominates early operational hours as macromolecular segments reorient under compressive load. The long-term decay curve is dictated by oxidative cleavage and scission of sulfur or peroxide bonds within the network.
In hydrocarbon environments, dissolved oxygen and active fluid components accelerate chemical stress relaxation, leading to irreversible loss of sealing force.
The time-dependent contact stress sigma(t) is modeled using a generalized Maxwell approach integrated with an Arrhenius degradation rate:
sigma(t) = sigma_0 sum(g_i exp(-t / tau_i)) exp(-k_chem(T) t)
where g_i and tau_i represent the normalized moduli and relaxation times of the physical Maxwell elements, and k_chem(T) represents the chemical degradation constant governed by the activation energy E_a. For a standard bisphenol-cured FKM, E_a ranges from 85 to 110 kJ/mol, leading to an exponential acceleration of stress relaxation as temperatures exceed 125 degrees Celsius.

Compression Set Accumulation under Thermal Cycling
Thermal excursions compound stress loss through differential thermal expansion. Elastomers exhibit volumetric thermal expansion coefficients between 1.5e-4 and 2.5e-4 /K, roughly an order of magnitude higher than carbon steel at 1.2e-5 /K. As the temperature rises, the constrained elastomer attempts to expand, elevating contact stress to severe peak values. This elevated stress accelerates the rate of compression set accumulation via stress relaxation.
Subsequent cooling reduces seal volume, and because the accumulated compression set prevents recovery, contact stress collapses below initial assembly values.
Measuring this loss requires continuous force decay recording rather than standard offline post-test metrics. When an assembly undergoes thermal cycling between -20 and 150 degrees Celsius, each hot phase drives rapid plastic strain accumulation. By cycle 50, the baseline contact stress at 23 degrees Celsius can decrease by 60 percent, even if the seal appears physically undamaged.
DIN ISO 3384 requires continuous counterforce logging because standard offline recovery tests miss mid-cycle stress collapse.
Interfacial pore widening correlates directly to this stress collapse. Below a threshold sealing stress of 1.5 to 2.0 MPa, the elastomer can no longer deform plastically into metal surface valleys. Micro-voids coalesce into channels spanning the seal width.
When contact stress drops below the internal fluid pressure, boundary containment fails completely.
The process engineer faces substantial risk here: calculating seal life solely from isothermal air test sheets ignores the 3-fold acceleration of counterforce loss observed under combined thermal swings and solvent immersion.
Hysteresis
Dynamic thermal cycling induces continuous energy loss within the elastomer due to internal friction and molecular rearrangement. This mechanical hysteresis prevents the material from tracing identical stress-strain paths during heating and cooling phases. In the presence of hydrocarbons, absorbed fluid molecules act as internal lubricants, shifting the phase angle delta and altering the loss factor tan(delta).
The resulting response creates a hysteresis loop in contact stress between the heating half-cycle and the cooling half-cycle.
During the cooling phase, thermal contraction outpaces the physical recovery speed of the polymer chains. This lag creates a transient window of diminished contact pressure. If internal fluid pressure spikes during this window, interfacial separation occurs.
The physical aperture of interfacial micro-pores can widen by an order of magnitude during rapid temperature drops, even if steady-state dimensions at stable cold temperatures remain within nominal tolerance bands.
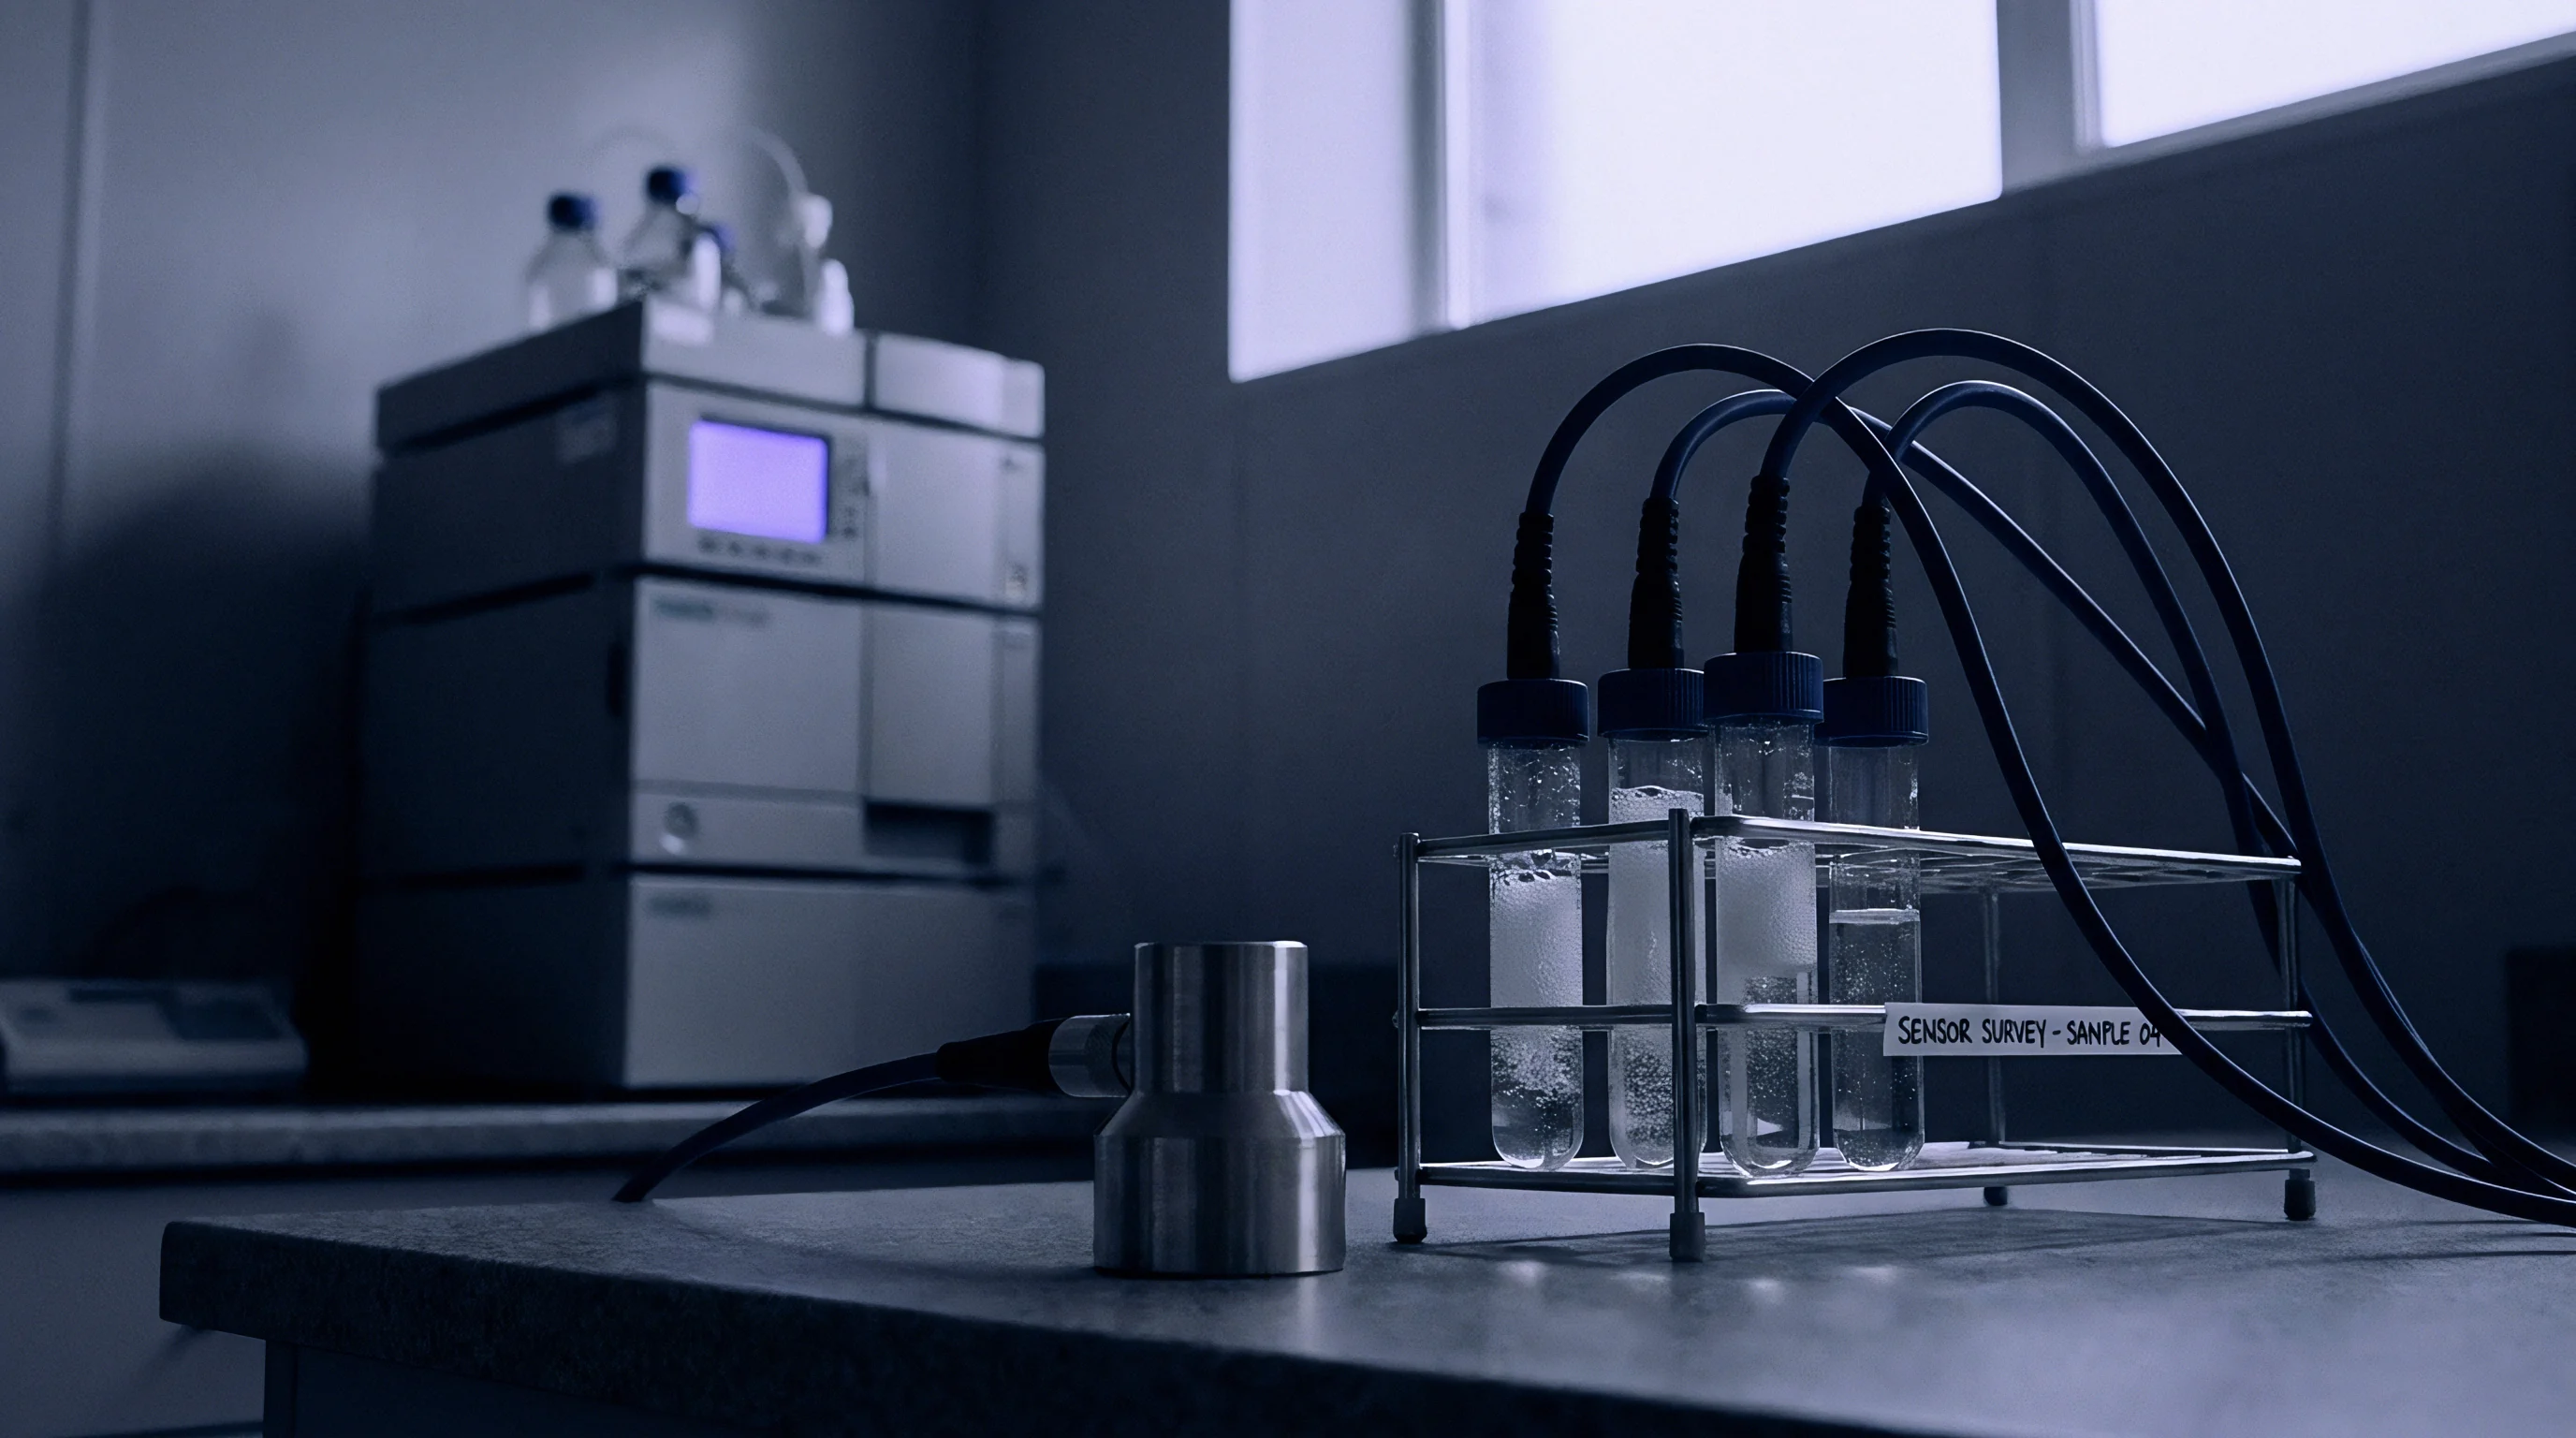
What Drives Interfacial Pores to Open during Cool-Down?
Thermal contraction combined with high polymer relaxation times produces an imbalance at the contact zone. The linear contraction delta_L of an elastomer ring during cooling is expressed as:
delta_L = L_0 alpha_e delta_T
where alpha_e is the thermal expansion coefficient and delta_T is the temperature change. Steel contracts according to alpha_s. The mismatch strain epsilon_thermal generates an interfacial gap whenever the instantaneous relaxation rate of the rubber cannot track the dimensional withdrawal:
epsilon_thermal = (alpha_e – alpha_s) delta_T
For a temperature drop of 100 degrees Celsius, this thermal strain mismatch reaches roughly 1.5 to 2.0 percent. If the polymer is near its glass transition point, where relaxation times lengthen from milliseconds to hours, the seal cannot expand to fill the void. The contact stress drops to zero at the interface peaks, driving rapid pore enlargement.
A structured laboratory assessment protocol reveals the progression of interfacial void growth under these conditions:
- Solvent Conditioning Phase saturates the mounted seal assembly in target hydrocarbons at 80 degrees Celsius for 500 hours to achieve swelling equilibrium.
- Thermal Cycling Sweep oscillates the test fixture between -30 degrees Celsius and 150 degrees Celsius at a ramp rate of 1.5 degrees Celsius per minute while holding fluid pressure at 3.0 MPa.
- Interfacial Leakage Profiling monitors downstream micro-flow continuously using mass spectrometry or carrier-gas hydrocarbon detection down to 1e-7 mbar l/s.
- Profilometry Post-Audit disassembles the fixture under cryo-clamping to preserve void structures, mapping surface contact via optical white-light interferometry.
Execution of this test sequence indicates that interfacial pores do not grow uniformly. Growth initiates at high-energy machining furrows and spreads outward along local stress gradients. Fluid sorption lowers the tear strength of the elastomer, allowing cyclic shear stresses at asperity junctions to produce micro-fissures that permanently enlarge the interfacial pore network.
A supplier will typically claim that compression set values below 25 percent guarantee containment, avoiding discussion of dynamic recovery lag during thermal transitions.


Porosity
Interfacial porosity is defined as the void volume fraction existing between the elastomer boundary and the rigid mating surface. While the bulk elastomer remains essentially non-porous prior to chemical breakdown, the interface presents a complex topography of contacting micro-asperities interspersed with fluid-filled voids. Under cyclical operational loads, this boundary layer undergoes restructuring governed by micro-mechanics and localized stress variations.
A quantitative prediction of mean interfacial aperture h_m under load relies on the Greenwood-Williamson contact model modified for plasticization:
h_m = sigma_s sqrt(-2 ln( (P_contact) / (E_eff A_nominal eta beta sigma_s) ))
where sigma_s is the standard deviation of surface asperity heights, P_contact is the instantaneous contact force, E_eff is the degraded elastic modulus, eta is asperity density, and beta is the mean radius of asperity summits. As the elastomer degrades, E_eff drops due to hydrocarbon swelling, then increases sharply as crosslinking reactions dominate late-life service. This stiffening prevents the rubber from conforming to surface roughness, increasing the hydraulic gap h_m.

Percolation Thresholds and Channel Coalescence
Leak paths form when isolated interfacial pores coalesce into a connected network. This transition follows percolation theory. When the fractional contact area A_real / A_nominal drops below a critical threshold (typically 0.42 to 0.48 for isotropic surfaces), continuous paths cross the seal footprint.
Once percolation occurs, flow transitions from slow diffusion through the polymer matrix to direct advective transport through micro-channels.
| Cycle Count (0-150 C) | Real Contact Area (%) | Mean Pore Radius (um) | Hydraulic Conductivity (m2) | Helium Leak Rate (mbar l/s) |
|---|---|---|---|---|
| 0 (Unaged) | 91.2 | 0.08 | 1.2e-18 | < 1.0e-8 |
| 50 Cycles | 84.5 | 0.22 | 8.5e-17 | 2.4e-7 |
| 200 Cycles | 68.1 | 0.74 | 3.1e-15 | 6.8e-5 |
| 500 Cycles | 46.3 | 1.85 | 9.4e-13 | 1.2e-2 |
| 1000 Cycles | 32.0 | 4.10 | 5.6e-11 | > 1.0 |
Values in the table demonstrate an acceleration in pore growth between 200 and 500 thermal cycles. The drop in real contact area below 50 percent marks the onset of macroscopic percolation, where hydraulic conductivity escalates by orders of magnitude. Internal stresses driven by cycling create permanent micro-cracking at stress concentration notches along the seal periphery.
A four-micrometer interfacial channel completely destroys containment against liquid hydrocarbons regardless of external system clamping force.
Mechanical wear also participates in void growth. Differential thermal movements cause micro-fretting against the steel flange. Over thousands of cycles, this motion abrades the softened seal surface, stripping microscopic rubber particles and carving wider interfacial grooves that resist compressive closure.
Leaving interfacial porosity unmonitored in high-pressure hydrocarbon containment leads to sudden seal blowouts following routine plant cool-downs.

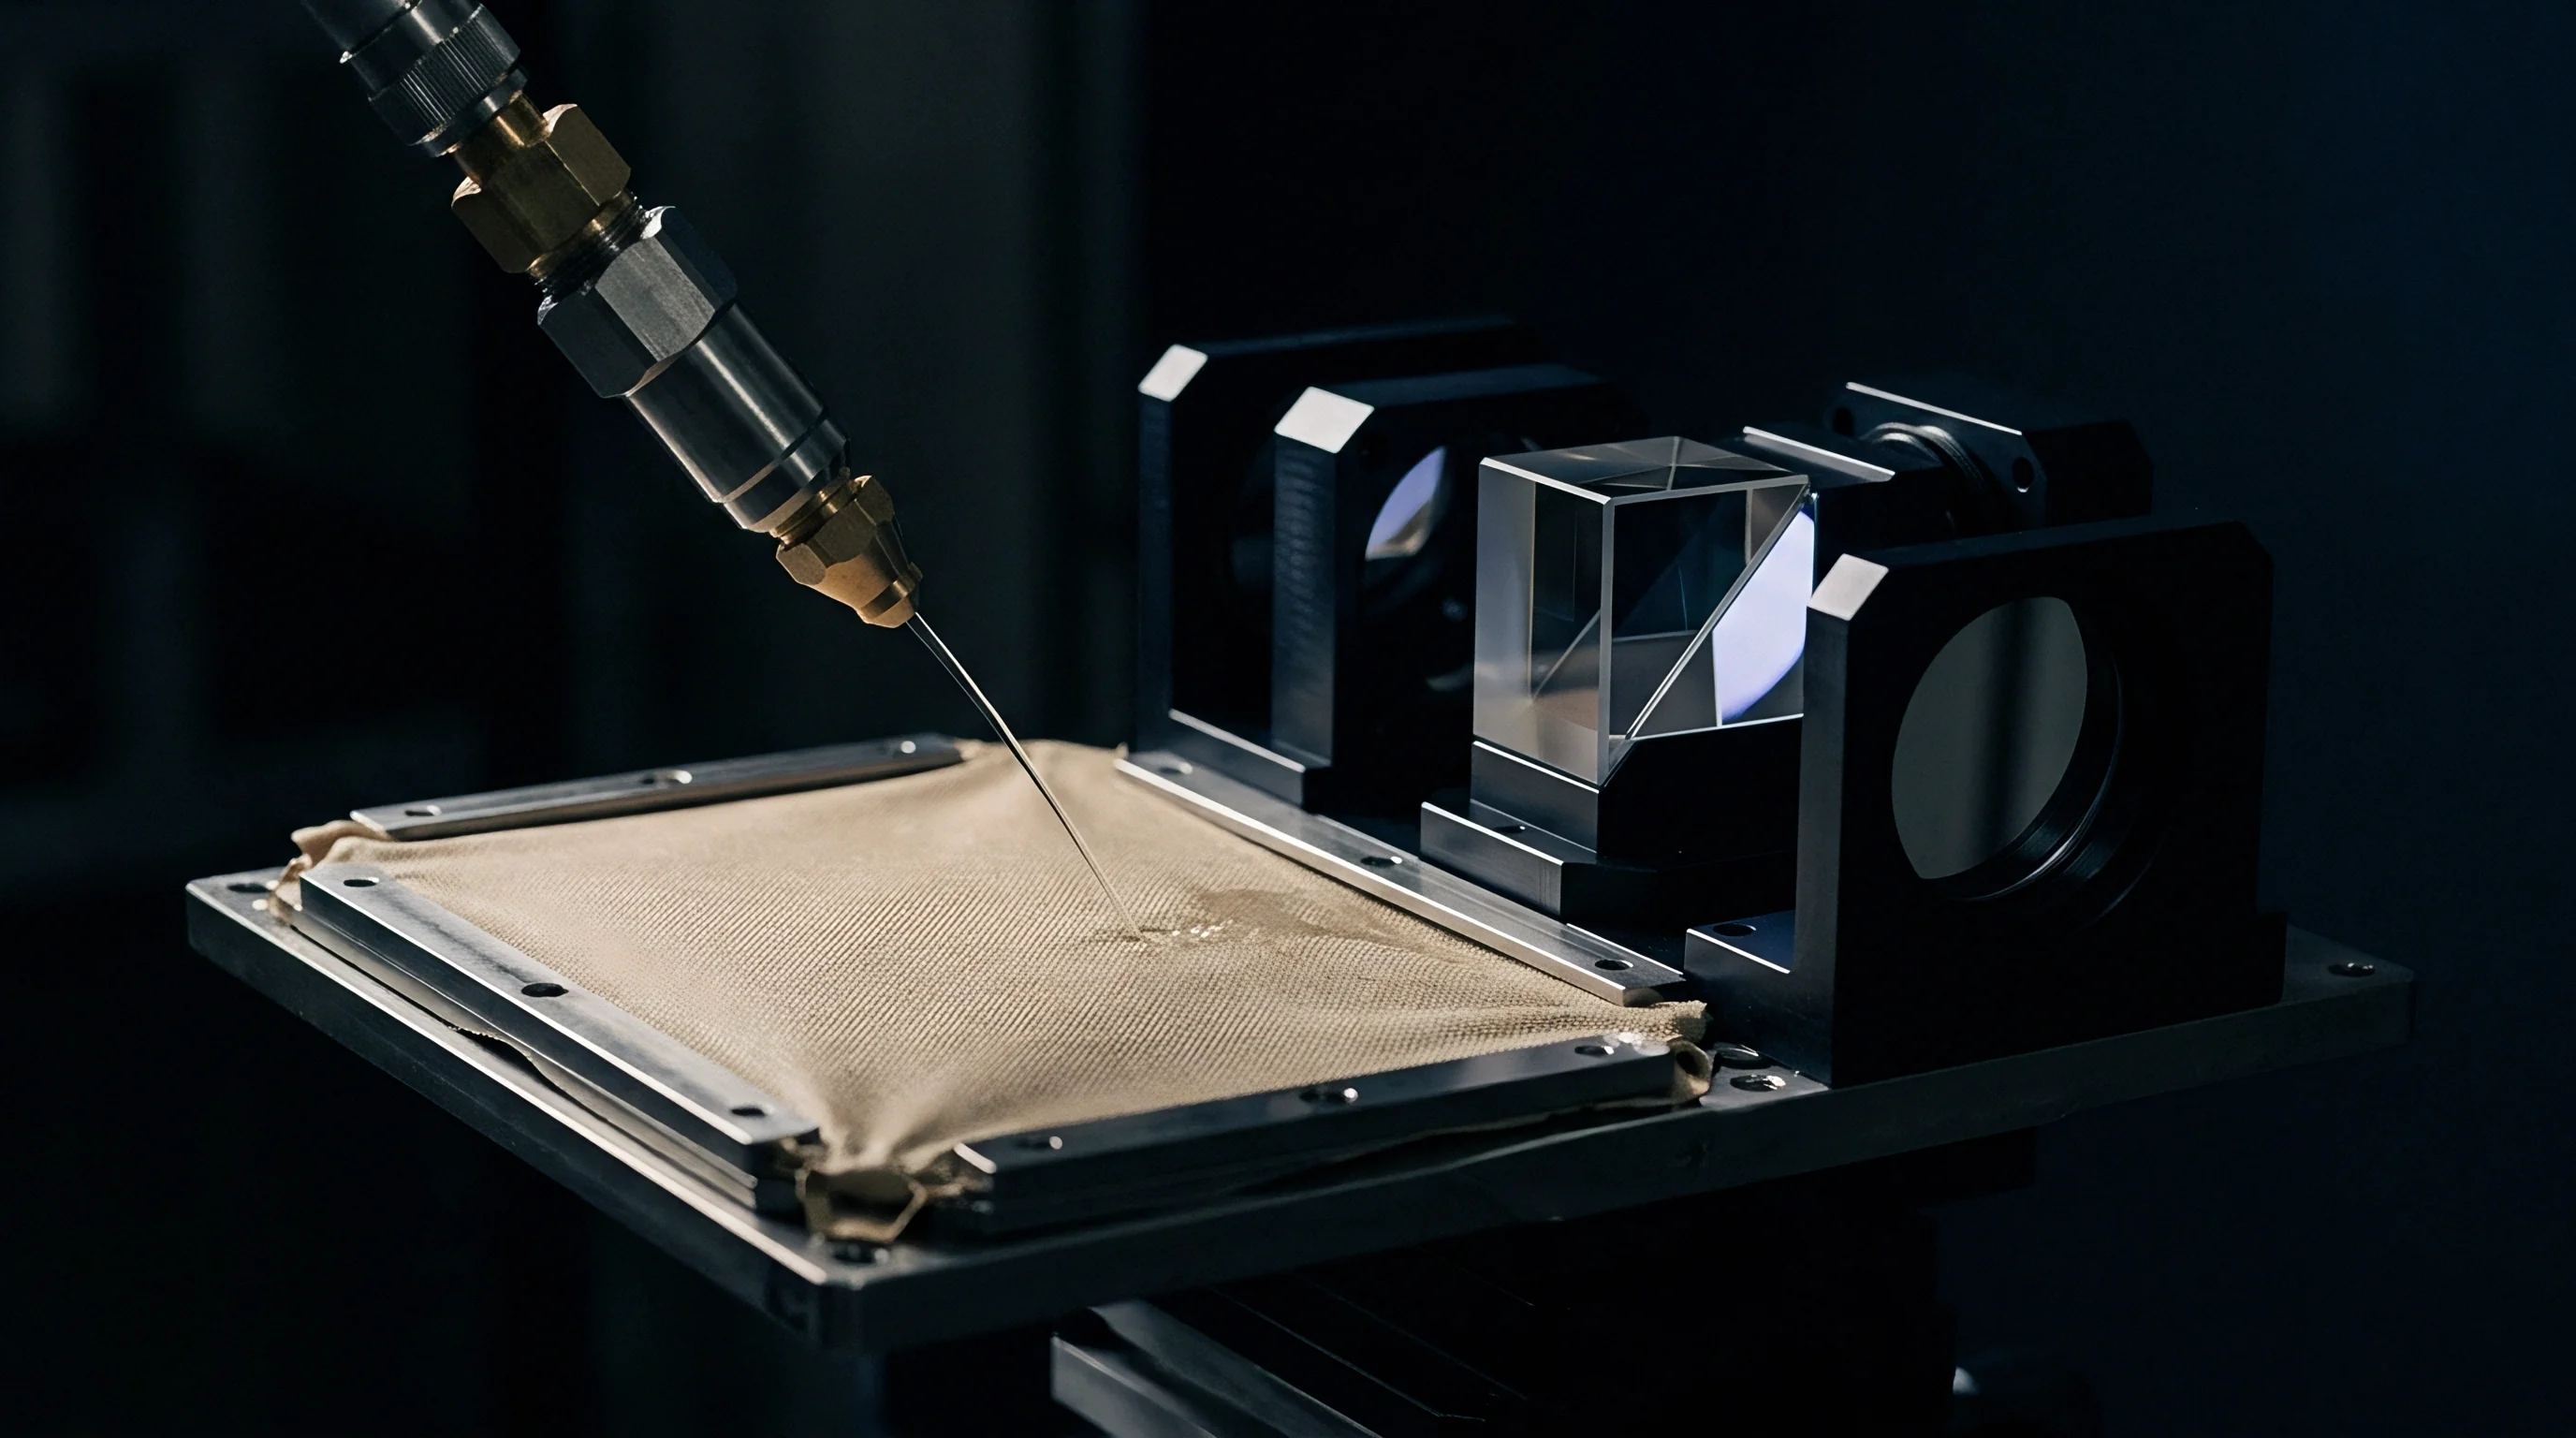
Calculation
To predict interfacial pore expansion quantitatively over multi-year service lives, engineers combine empirical diffusion models with contact mechanics. The calculation framework tracks instantaneous contact stress, swelling-induced volumetric shifts, and asperity contact ratios over time-series temperature profiles. The following worked construction demonstrates this methodology for a safety-critical flange seal over a projected three-year deployment.
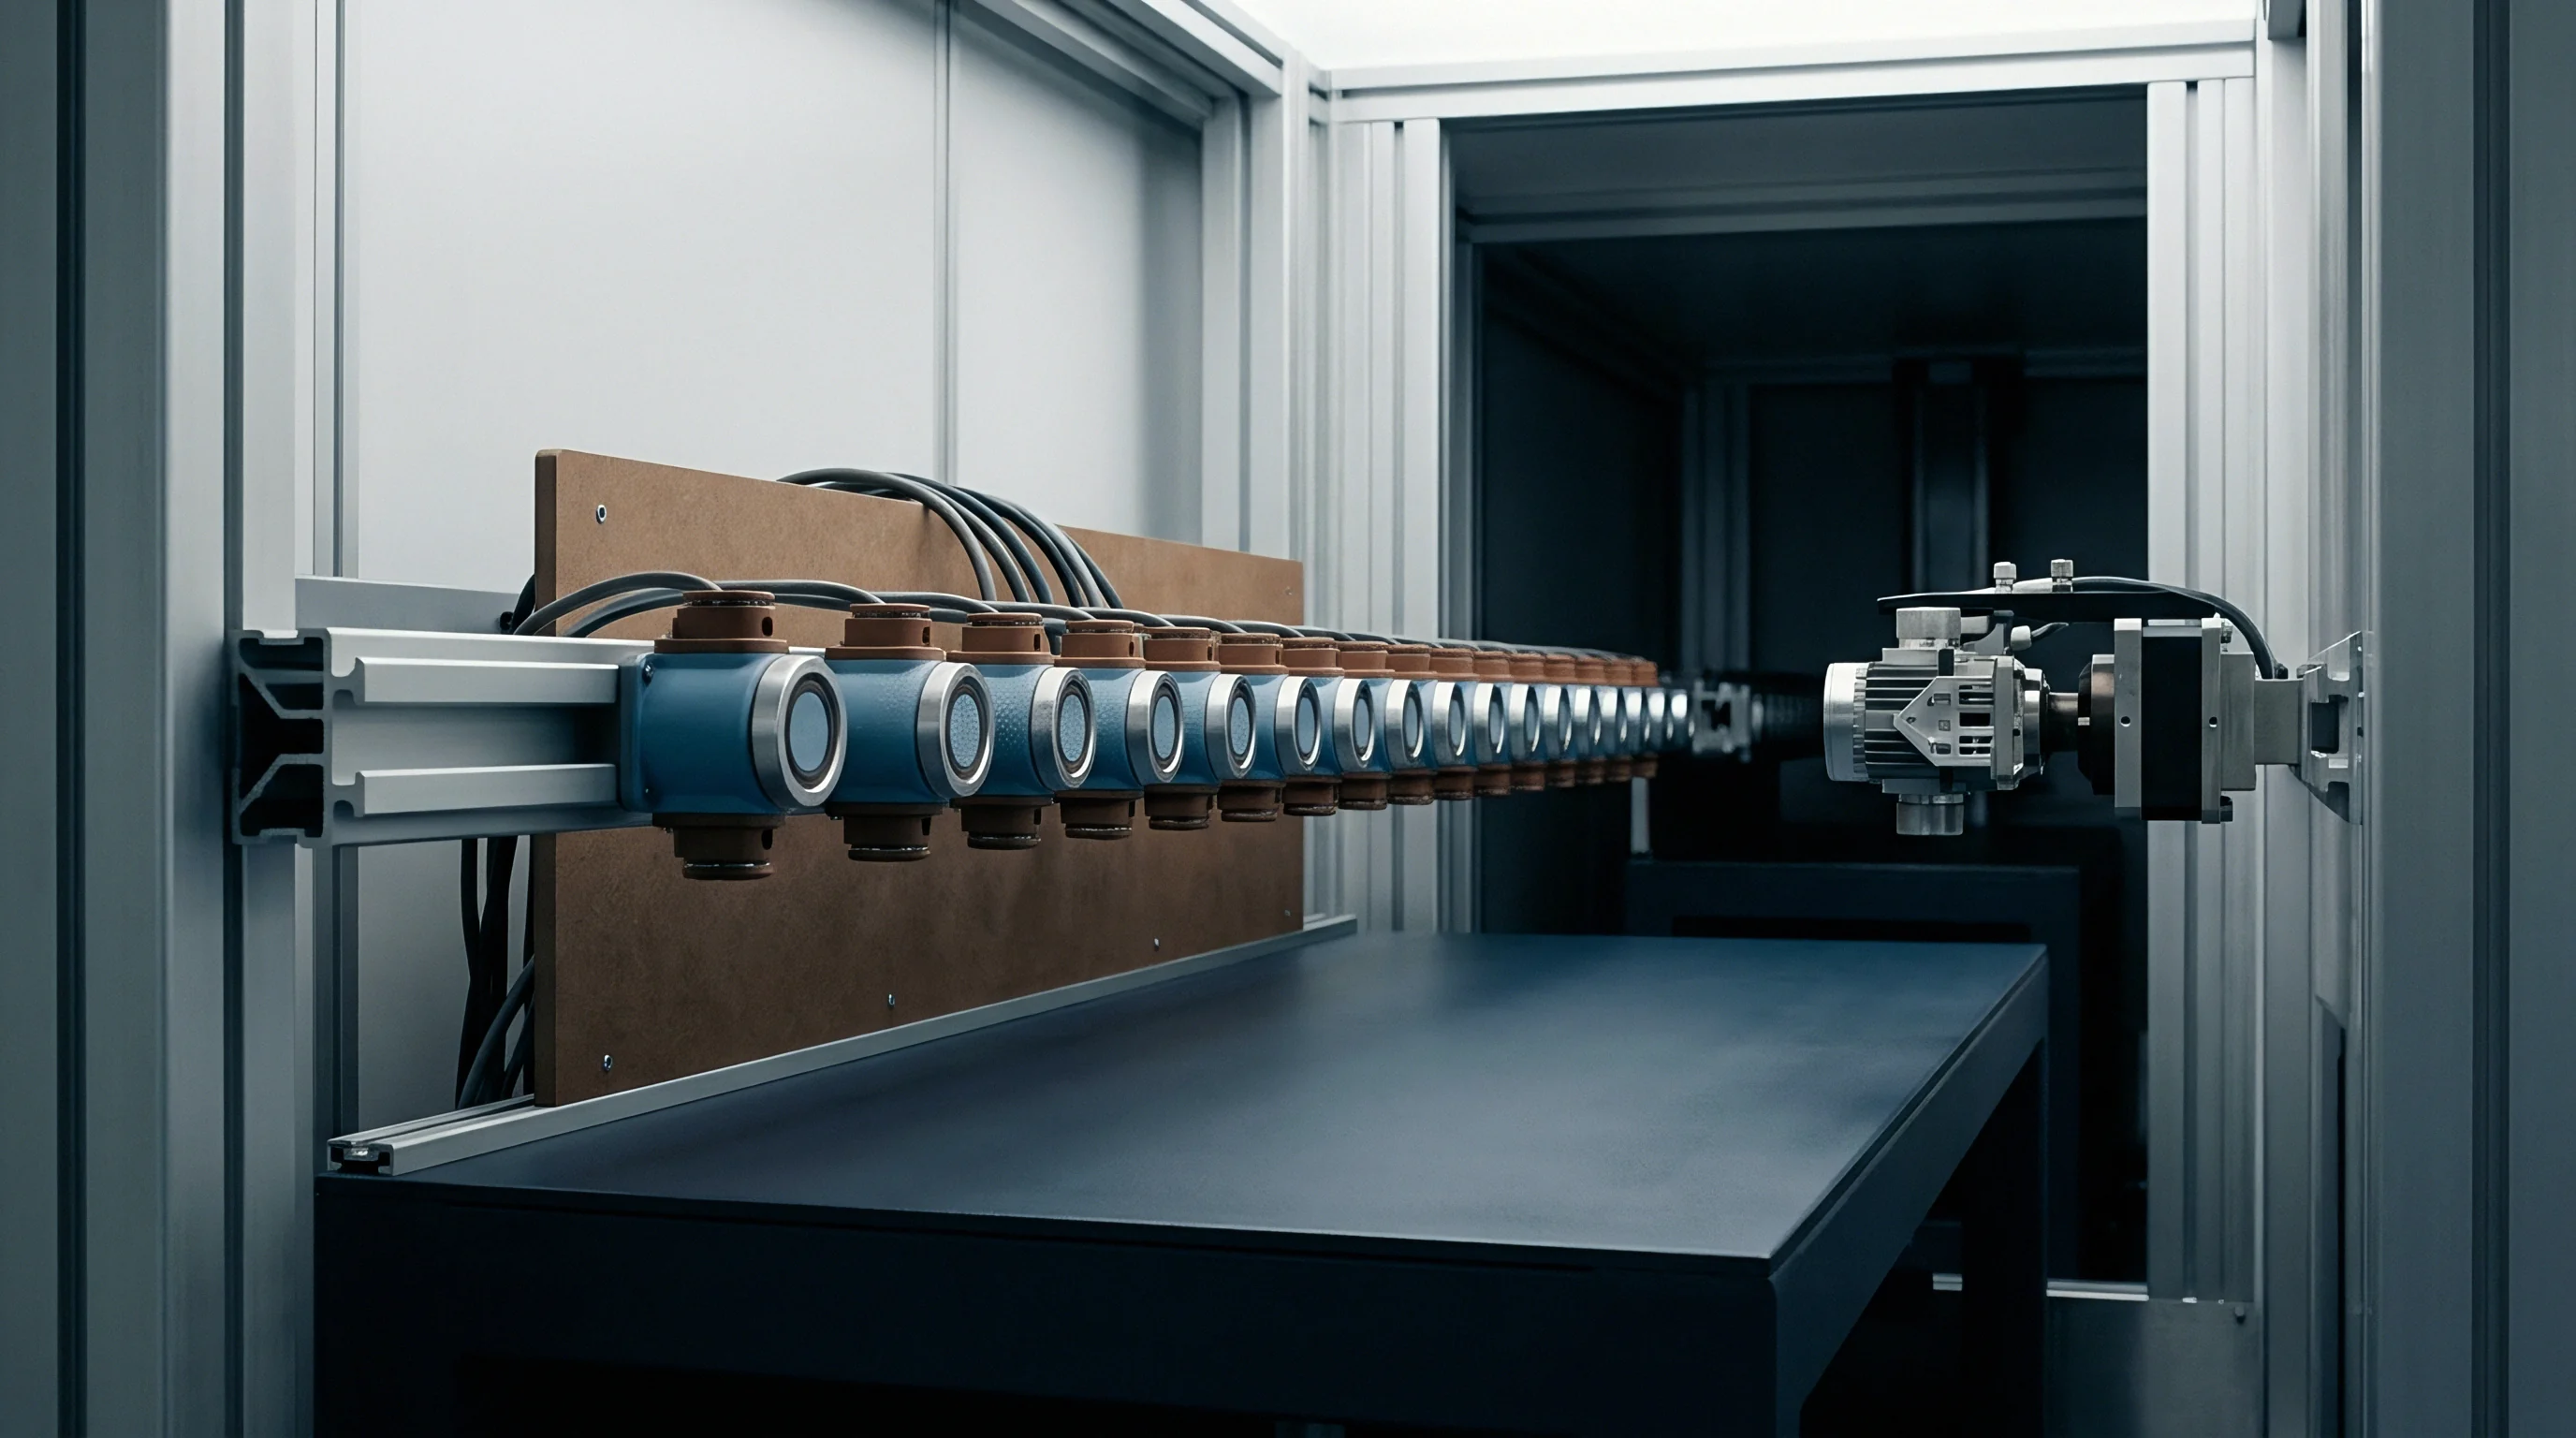
Worked Lifetime Prediction Model
Assume a nominal 5.33 mm cross-section FKM O-ring installed in an EN 10088-3 1.4404 stainless steel groove with a surface finish of Ra = 0.4 micrometers (sigma_s = 0.51 micrometers). The assembly operates in sweet crude condensate with 15 percent aromatic fraction, undergoing one thermal cycle per day between 10 degrees Celsius and 130 degrees Celsius. The nominal initial compression is 20 percent.
The prediction sequence proceeds through defined computational checkpoints:
- Initial Modulus Estimation sets E_0 = 7.5 MPa based on an unaged Shore A hardness of 75, yielding an initial assembly contact stress of 6.2 MPa and an initial mean pore radius r_0 = 0.05 micrometers.
- Solvent Diffusion Iteration evaluates swelling kinetics using D = 1.8e-8 cm2/s at average operating temperatures, projecting an equilibrium volume swell of 4.2 percent with an extraction coefficient of 0.015 percent per cycle.
- Stress Decay Profiling implements Arrhenius-driven thermal degradation with activation energy E_a = 92 kJ/mol, calculating a 42 percent permanent loss of counterforce over 1,095 thermal cycles.
- Thermal Mismatch Adjustment applies a contraction differential of 1.88e-4 /K across each 120-degree cooling excursion, identifying minimum instantaneous contact stresses at the 10-degree trough.
- Hydraulic Gap Resolution recalculates real contact area A_real and mean hydraulic pore radius r_pore at the base of every 100th thermal cycle using degraded modulus values.
After Year 1 (365 cycles), the calculation indicates an effective modulus E_eff = 5.8 MPa due to dominant solvent plasticization. The cold-state contact stress at 10 degrees Celsius falls to 2.8 MPa. The corresponding mean interfacial pore radius widens from 0.05 micrometers to 0.18 micrometers.
Capillary containment remains functional, keeping liquid hydrocarbon leakage below measurable thresholds.
By Year 2 (730 cycles), plasticizer extraction reverses the softening effect. Stiffening elevates E_eff to 8.9 MPa, while the baseline counterforce at 130 degrees Celsius degrades through ongoing crosslink scission. At the cold trough of the cycle, contact stress drops to 1.1 MPa.
The real contact area falls to 54 percent, and the mean pore radius expands to 0.65 micrometers. Capillary resistance drops to 0.07 MPa, below the operational fluid pressure of 0.2 MPa, triggering micro-seepage at cold restarts.
By Year 3 (1,095 cycles), the cumulative compression set reaches 72 percent. During the cold phase of each cycle, thermal contraction completely unloads the seal from the asperity troughs. Contact stress registers 0 MPa over 65 percent of the footprint.
The calculated mean pore diameter reaches 3.2 micrometers. Interfacial pores form a continuous open labyrinth across the seal face, resulting in continuous product escape at an estimated rate of 1.4 ml/min.
| Uncertainty Source | Standard Uncertainty (u_i) | Probability Distribution | Sensitivity Coefficient (c_i) | Uncertainty Contribution (um) |
|---|---|---|---|---|
| Activation Energy (E_a +/- 5 kJ/mol) | 2.89 kJ/mol | Normal | 0.082 um/(kJ/mol) | 0.237 |
| Solvent Swell Equil (+/- 1.5%) | 0.866 % | Rectangular | -0.145 um/% | -0.126 |
| Surface Roughness Ra (+/- 0.08 um) | 0.046 um | Normal | 2.15 um/um | 0.099 |
| Thermal Expansion Coeff (+/- 10%) | 0.108e-4 /K | Rectangular | 12400 um K | 0.134 |
| Plasticizer Leaching Rate (+/- 20%) | 0.115 %/cycle | Normal | 1.82 um/(%/cycle) | 0.209 |
| Combined Standard Uncertainty u_c = 0.368 um; Expanded Uncertainty U (k=2) = 0.736 um | ||||
The uncertainty budget proves that the prediction holds an expanded boundary of 3.20 +/- 0.74 micrometers at a 95 percent confidence level (k = 2). The primary contributors to this variation are the chemical activation energy of the elastomer formulation and the extraction rate of plasticizers by the hydrocarbon stream. A slight change in fuel composition that accelerates extraction moves the critical leak transition forward by hundreds of cycles.
A procurement contract that omits specific tolerances on filler grade, plasticizer loading, and thermal expansion properties leaves the buyer absorbing all financial risk when early pore enlargement triggers environmental compliance fines.


Protocol
To defend against premature interface pore expansion, engineering and quality teams implement comprehensive qualification testing on incoming production batches. Relying solely on raw material certificates of conformance (CoC) invites substantial operational risk. Sourcing protocols verify material properties through physical counterforce decay logging, dynamic mechanical analysis, and immersion testing under representative thermal swings.
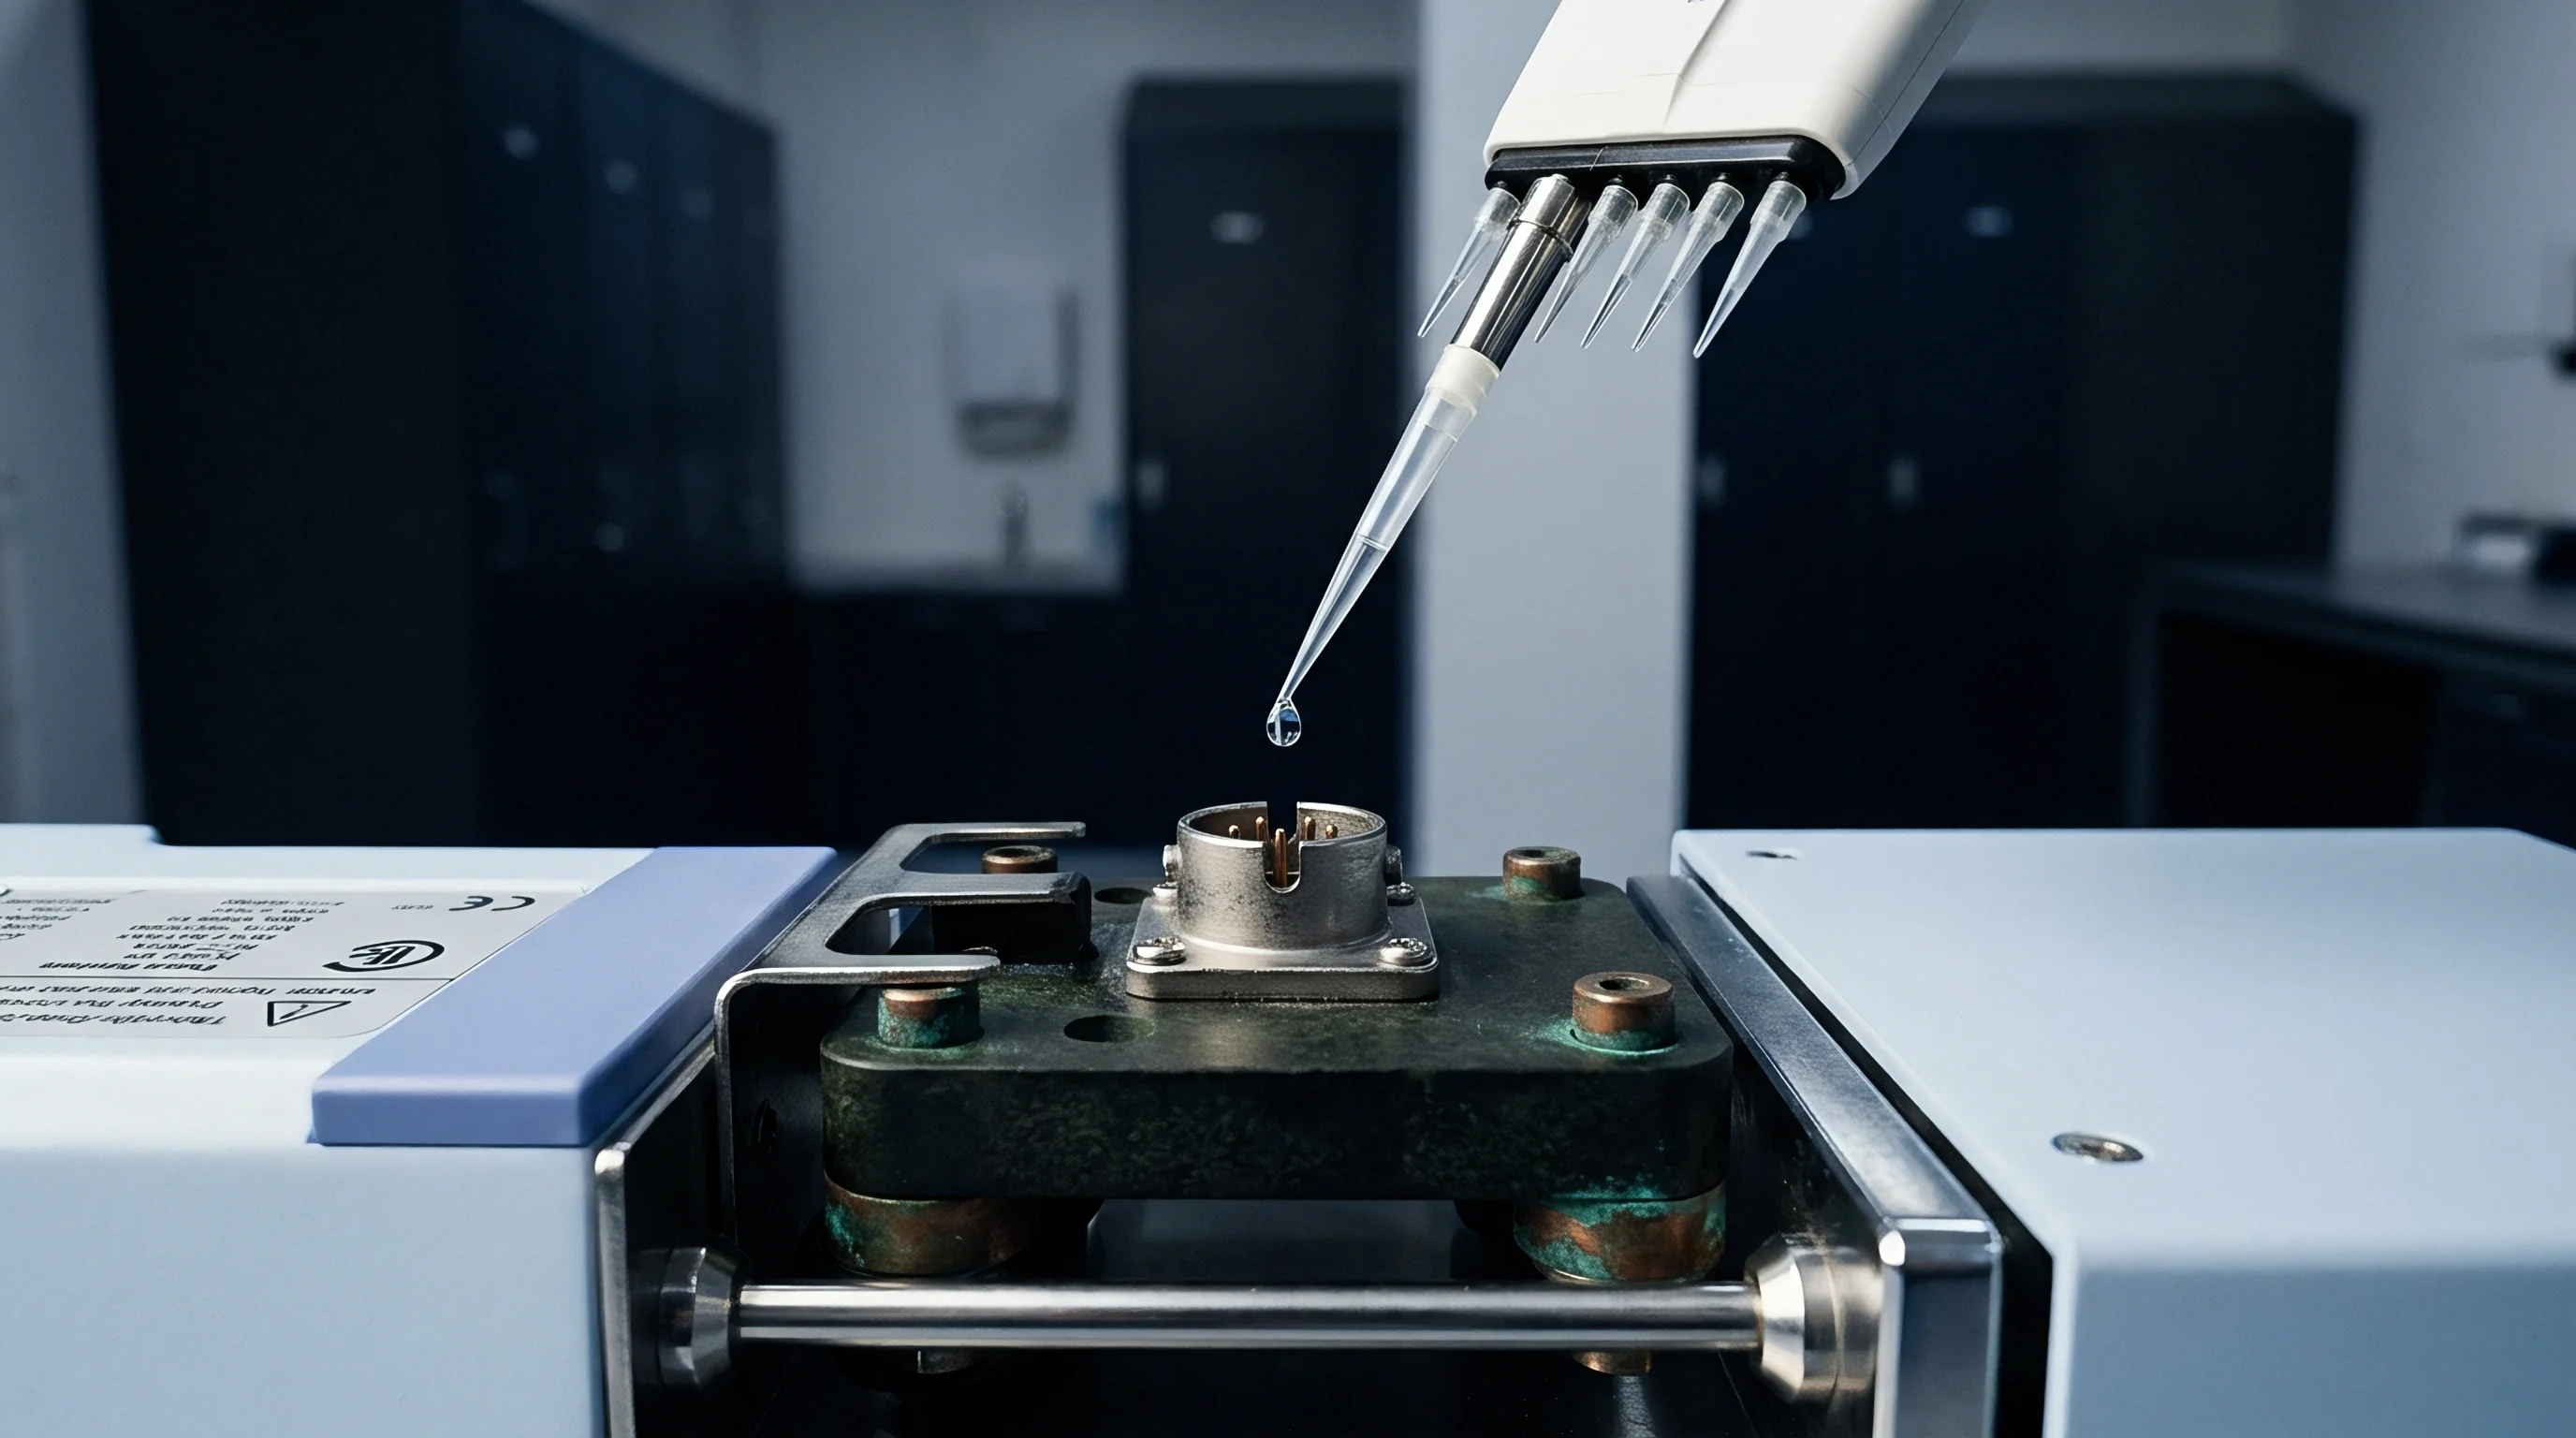
Material Qualification Requirements
Acceptance testing procedures demand verification beyond baseline tensile strength and elongation metrics specified in standard ASTM D2000 callouts. Qualification packages require documented testing of three specific performance criteria:
Continuous stress relaxation testing conducted per ISO 3384 Method B tracks counterforce retention while submerged in reference fuel blends. The test profile imposes alternating thermal plateaus. Materials exhibiting a counterforce drop greater than 50 percent after 168 hours of cyclic immersion face rejection.
Low-temperature retraction is determined using the TR-10 value per ASTM D1329. The qualification threshold requires the TR-10 temperature to remain at least 15 degrees Celsius below the minimum design operating limit after 70 hours of pre-immersion in aromatic hydrocarbons followed by 24 hours of vacuum drying. This step accounts for plasticizer depletion and subsequent glass transition elevation.
Direct measurement of asperity contact conductance via gas permeation tracking under simulated thermal gradients verifies mechanical compliance. The test assembly compresses candidate seals between optical sapphire flats and production steel plates, monitoring interfacial contact area through real-time imaging.

Incoming Inspection and Quality Governance
Production batches undergo rigorous batch testing to verify vulcanization consistency and avoid premature crosslink scission. Sourcing specifications mandate continuous logging of rheometer cure curves (M_H, M_L, t_90) per ASTM D5289 for every mixed batch. Variation in t_90 scorch time exceeding 8 percent signals compounding inconsistency, altering final network density and accelerating relaxation rates in the field.
Buyers specify surface finish quality controls for production seals. Flange surfaces receive tactile or optical stylus profilometry to ensure Ra does not exceed 0.4 micrometers, with an Rz limit of 1.6 micrometers. Tool marks running perpendicular to the seal line are rejected, because these features function as seed sites for interfacial pore expansion under cyclical shear stresses.
ISO/IEC 17025 accredited laboratory test reports must accompany each critical delivery lot, documenting specific gravity, micro-hardness, and volume swell in reference fluid. Testing without third-party laboratory accreditation leaves the buyer without legal recourse if material properties fail during field qualification.
Unresolved questions persist regarding how low-level additive migration from next-generation synthetic lubricants affects long-term crosslink stability during severe temperature transitions.