PdCr Film Apparent Strain Compensation and Thermal Drift Calculation
PdCr film apparent strain compensation combines polynomial thermal subtraction with parabolic oxidation drift modeling to achieve static strain tolerances.

Signal
A thin palladium-chromium filament bonded to a high-temperature structural component registers electrical resistance changes from both mechanical load and ambient thermal expansion. Thermal gradients induce apparent strain. When gas turbine components undergo thermal cycles from ambient temperature to 1100 K, the sensor grid expands at a rate determined by its own thermal expansion coefficient, while the underlying component substrate expands at a differing rate.
Concurrently, the intrinsic resistivity of the alloy shifts with temperature. These simultaneous physical effects produce a net resistance shift indistinguishable from mechanical strain on a standard Wheatstone bridge readout without compensation.
Metrological characterization defines the apparent strain as the net indicated strain output of an installed sensor exposed to temperature changes under zero mechanical load. The relationship links thermal resistivity shifts and differential thermal expansion directly to the transducer gage factor:
εapp(T) = ∫T0T dT
In this governing equation, βg represents the thermal coefficient of resistance of the palladium-chromium film, Sg represents the gage factor of the sensor, αs represents the linear coefficient of thermal expansion of the test substrate, and αg represents the linear coefficient of thermal expansion of the sensor film itself. Ambient reference temperature serves as T0.
A bare palladium-chromium sensor grid deposited on Hastelloy X exhibits an apparent strain exceeding 6200 microstrain when heated from 293 K to 1073 K without compensation.

Mechanical Strain against Thermally Induced Output
Static load verification at elevated temperatures faces the challenge of separating physical component displacement from temperature-induced electrical artifacts. The resistance shifts. When an engine component experiences five hundred microstrain of mechanical deformation while concurrently heating by five hundred kelvin, the thermal output can exceed the mechanical signal by more than an order of magnitude.
If an installation exhibits a nominal gage factor of 1.90, a fractional resistance change (ΔR / R0) of 0.001 represents approximately 526 microstrain of true mechanical deformation. Over the same thermal excursion, the uncompensated resistivity and thermal expansion mismatch can generate a fractional resistance change exceeding 0.012, equivalent to over 6300 microstrain of indicated deflection.
Resolving true mechanical response requires precise knowledge of the thermal output baseline across the entire thermal operating envelope. Laboratory calibrations establish polynomial calibration curves on coupon samples of identical substrate metallurgy. Variations in alloy batch composition between the test coupon and the real turbine component produce systematic offsets that degrade baseline subtraction precision.
Transducer Sensitivity Parameters across Thermal Gradients
Evaluating sensor performance over wide operating bands requires establishing exact values for the gage factor and temperature coefficient of resistance. Sputter-deposited thin films of palladium-13 weight percent chromium exhibit electrical and thermal characteristics that diverge from bulk alloy reference data due to surface scattering, grain boundary density, and film thickness constraints. Sputter deposition sets grain size.
| Substrate Material | Substrate CTE (10-6 / K) | Film CTE (10-6 / K) | Film TCR (10-6 / K) | Gage Factor at 873 K | Apparent Strain at 1073 K (με) |
|---|---|---|---|---|---|
| Hastelloy X | 16.2 ± 0.4 | 11.8 ± 0.3 | 145 ± 12 | 1.88 ± 0.03 | +6240 ± 180 |
| Inconel 718 | 15.1 ± 0.3 | 11.8 ± 0.3 | 145 ± 12 | 1.89 ± 0.03 | +5420 ± 160 |
| Silicon Nitride (Si3N4) | 3.4 ± 0.2 | 11.8 ± 0.3 | 145 ± 12 | 1.92 ± 0.03 | -3890 ± 140 |
| Alumina (Al2O3) | 8.6 ± 0.3 | 11.8 ± 0.3 | 145 ± 12 | 1.91 ± 0.03 | +180 ± 90 |
| Sapphire | 8.4 ± 0.2 | 11.8 ± 0.3 | 145 ± 12 | 1.91 ± 0.03 | +30 ± 80 |
Film resistivity measures approximately 75 to 85 micro-ohm centimeters at room temperature for a film thickness of 1.2 micrometers. The thermal coefficient of resistance remains stable and repeatable between 130 and 160 ppm/K from room temperature up to 1073 K, provided the film receives appropriate thermal stabilization annealing before service. Variations in film thickness across the active grid introduce local variations in the temperature coefficient of resistance.
A deposition thickness gradient of ten percent across a sensor batch causes up to fifteen ppm/K spread in the thermal coefficient of resistance, shifting apparent strain curves between individual units.
Uncorrected thermal output within gas turbine static strain audits generates false structural yield indications that decommission functional hot-section components before their rated creep lifespan expires.
Alloy
Sputtered palladium combined with thirteen weight percent chromium forms a stable solid solution that avoids the order-disorder lattice transformations found in nickel-base elements. Nickel-chromium elements undergo metallurgical short-range ordering between 623 K and 823 K, producing anomalous resistance increases that introduce large hysteresis loops during heating and cooling cycles. The palladium-chromium binary system exhibits solid solubility across operating temperatures up to 1273 K, preventing crystallographic phase shifts.
Lattice distortion elevates film resistivity.
Chromium dissolved within the face-centered cubic palladium lattice limits the temperature coefficient of resistance to a moderate, predictable positive slope. Pure palladium exhibits a thermal coefficient of resistance near 3800 ppm/K, an order of magnitude too high for direct high-temperature strain sensing. Thirteen weight percent chromium reduces the temperature coefficient of resistance below 160 ppm/K while maintaining mechanical ductility and thermal stability.
A solid-solution binary sensing element eliminates phase-transformation hysteresis across wide thermal excursions.
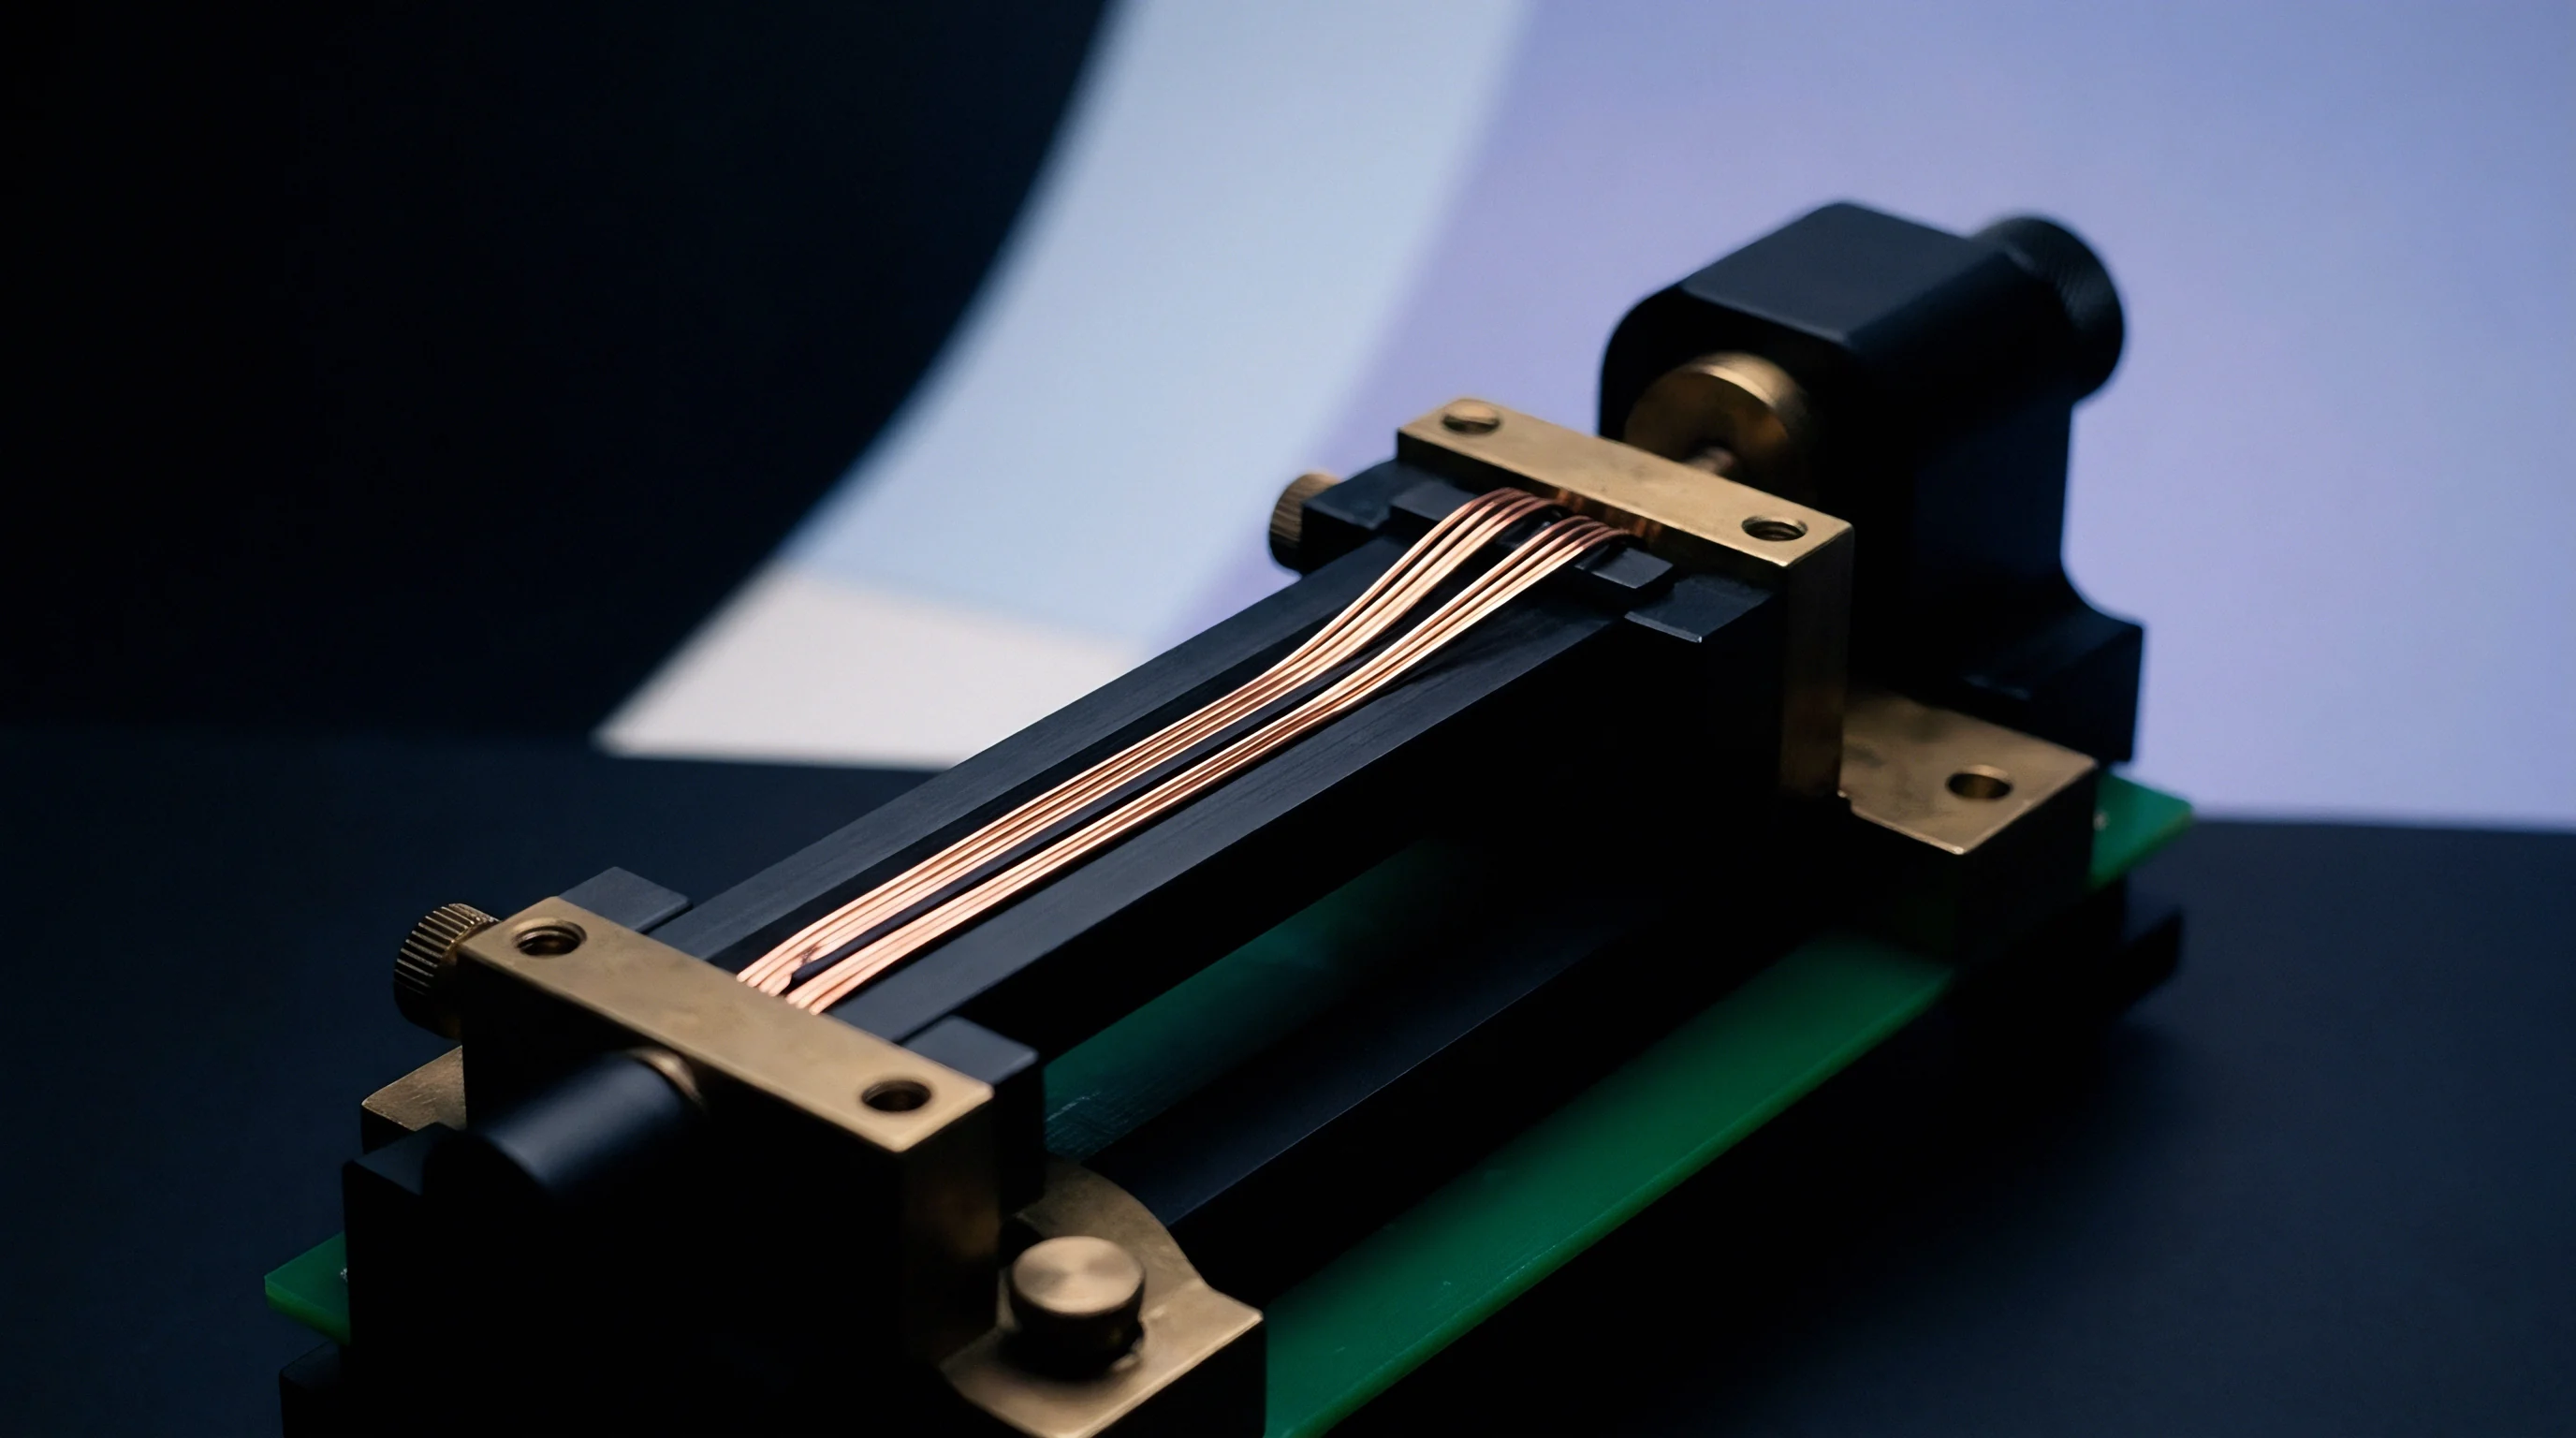
Microstructural Stability under High Operating Temperatures
Thermal exposure up to one thousand degrees Celsius produces minimal crystalline phase segregation when chromium remains fully dissolved within the palladium face-centered cubic lattice. Thin films deposited via magnetron sputtering possess high initial defect densities, columnar grain morphology, and significant internal residual stresses. Without pre-test conditioning, these microstructural defects anneal out during initial thermal exposure, generating irreversible resistance drops that corrupt strain indications.
Stabilization thermal treatments conducted in air at 1173 K for thirty to fifty hours establish microstructural equilibrium. Thermal exposure drives grain growth, relieving internal lattice strains and stabilizing grain boundary junctions. Grain growth relaxes internal stress.
During this initial thermal soak, chromium atoms diffuse to the film surface, reacting with ambient oxygen to produce an external, protective chromia (Cr2O3) scale.

What Governs Apparent Strain in Thin Films?
Differential thermal expansion between the deposited sensor grid and the underlying substrate drives the primary mechanical component of the uncorrected thermal offset. The active grid adheres to an electrically insulating dielectric ceramic layer, which in turn adheres to the metallic or composite base material. The active sensor grid conforms to substrate dimensional changes through shear transfer across these ceramic interfaces.
The total apparent strain trajectory represents the balance between this thermal expansion mismatch and the net film resistivity slope. When deposited on superalloys such as Hastelloy X or Inconel 718, substrate thermal expansion exceeds film thermal expansion by three to five ppm/K. This positive differential expands the sensor grid mechanically as temperature rises, increasing indicated strain. On substrates with low expansion coefficients, including silicon nitride and silicon carbide, the substrate expands less than the film.
The resulting compressive mechanical strain counteracts the positive resistance shift, driving net apparent strain into negative values.
- Interfacial Shear Delamination occurs when extreme thermal expansion mismatches between metallic substrates and ceramic isolation layers exceed bond strength, rupturing electrical continuity.
- Subsurface Chromium Depletion develops when prolonged oxidation consumes surface chromium, altering film stoichiometry and causing baseline drift.
- Target Composition Segregation introduces spatial resistivity variations across the substrate holder when magnetron sputtering erosion alters sputtered flux ratios.
- Microvoid Coalescence appears within thin-film grain boundaries during extended mechanical thermal fatigue, precipitating open-circuit failure modes.
The apparent strain curve of palladium-13 weight percent chromium remains repeatable across consecutive heating cycles once grain growth and passivation layers stabilize.


Layer
Direct deposition onto metallic test articles utilizes a dielectric barrier of electron-beam evaporated aluminum oxide measuring between five and eight micrometers in thickness. The dielectric film isolates conduction. Without adequate isolation, parasitic leakage currents bypass the active strain gauge grid through the conductive turbine substrate at temperatures exceeding 773 K, dropping loop resistance and injecting false strain signals into bridge instrumentation.
High purity alumina provides electrical isolation resistance exceeding ten megaohms at 1073 K.
Thermal expansion matching between the metal substrate and the dielectric underlayer dictates structural reliability. Thermally grown oxide layers or deposited alumina coatings undergo significant thermal shear stresses during engine transients. Intermediate bond coatings composed of nickel-chromium-aluminum-yttrium (NiCrAlY) alloy provide graded thermal expansion transitions while improving alumina adhesion on nickel-base superalloys.

Dielectric Isolation and Adhesion Metallurgy
High-temperature electrical insulation between the metallic turbine alloy and the sensor grid depends on stoichiometric alumina films deposited via reactive sputtering. Pre-oxidizing an underlying bond coat generates a dense alpha-alumina scale that enhances adhesion for subsequent vapor-deposited insulation layers. Insufficient oxidation produces amorphous or gamma-phase alumina coatings, which undergo phase transformations to alpha-alumina above 1073 K accompanied by a ten percent volumetric shrinkage.
This volume contraction creates microcracking that compromises electrical isolation.
Lead wire junctions represent another critical interface within the thin film architecture. Palladium-chromium film pads accept lead wires composed of platinum or high-temperature nickel alloys joined via micro-resistance welding or parallel-gap welding. Platinum wire minimizes oxidation risk at contact points.
Interdiffusion between platinum leads and the palladium-chromium pad occurs over time, creating localized alloy gradients that shift lead resistance unless joint geometries remain strictly isothermal.

Passivation Boundary Kinetics
Oxidation at elevated temperatures creates a self-limiting chromium oxide scale across exposed gauge surfaces. Pure chromium oxidizes selectively. Because chromium possesses a higher thermodynamic affinity for oxygen than palladium, chromium diffuses toward the surface, forming a dense Cr2O3 outer barrier.
This oxide shell limits further oxygen ingress into the underlying palladium matrix.
Deposition of an additional chemical vapor deposition or sputtered alumina overcoat measuring one to two micrometers in thickness provides supplementary oxidation resistance. Overcoats retard the rate of chromium depletion from the active sensing filament into the external environment. Chromium loss from the metallic film shifts the bulk alloy composition toward pure palladium, increasing the temperature coefficient of resistance and destabilizing apparent strain calibration curves over time.
- Surface preparation strips native oxides and contaminants from the test substrate using automated alumina grit blasting.
- Thermal spray equipment deposits an eighty-micrometer NiCrAlY bond coating across the sensor installation zone.
- High-temperature furnace annealing at 1273 K in a controlled vacuum forms an initial, dense alpha-alumina interfacial layer.
- Reactive radio-frequency magnetron sputtering deposits eight micrometers of stoichiometric Al2O3 dielectric isolation.
- Photolithographic masking and physical vapor deposition pattern the palladium-13 chromium strain grid and connection pads.
- Radio-frequency sputtering deposits a two-micrometer protective Al2O3 passivation overcoat across the active grid footprint.
- Thermal stabilization annealing in an atmospheric furnace at 1073 K for thirty hours stabilizes the protective chromia scale.
Foundry technical representatives routinely state that high-temperature baseline wander stems entirely from test-article surface preparation rather than stoichiometric variation across the sputtering target.


Correction
Nullifying temperature-induced bridge imbalances across wide thermal sweeps relies on hardware symmetry or software subtraction algorithms. Hardware compensation incorporates a dedicated temperature-compensating resistor element adjacent to the active strain grid. The compensating resistor mounts in the adjacent arm of a Wheatstone bridge circuit.
If the compensating element shares the identical thermal environment as the active grid while remaining isolated from mechanical strain, resistance changes caused by temperature cancel each other out directly at the bridge output terminals.
Software compensation measures surface temperature in immediate proximity to the active sensor grid using a co-located thin-film thermocouple or resistance temperature detector. A mathematical algorithm evaluates the pre-calibrated apparent strain polynomial at the recorded temperature and subtracts the resulting offset from the gross indicated bridge strain in real time. Software algorithms accommodate complex non-linear thermal responses without requiring matched bridge arm resistances.
ASTM E251 compliance mandates apparent strain characterization across a minimum of three complete thermal cycles to establish repeatable calibration polynomials.

Dual Element Bridge Circuitry
Symmetric half-bridge configurations place an active sensing grid alongside a passive compensating resistor exposed to the identical thermal environment. Fabricating both elements from identical palladium-13 chromium material yields matched temperature coefficients of resistance. The compensating grid must remain mechanically detached from substrate strain, or its geometry must orient transverse to the principal strain axis on materials exhibiting negligible Poisson deformation.
Thin-film designs frequently employ a palladium-chromium active grid combined with a thin-film platinum resistor element connected in series or placed in an adjacent bridge arm. Platinum exhibits a large positive temperature coefficient of resistance (approximately 3000 to 3800 ppm/K) compared to palladium-chromium (145 ppm/K). Combining a small platinum resistor with the palladium-chromium element creates an integrated dual-element sensor capable of self-temperature compensation on a targeted substrate.

Why Does Platinum Resistance Tracking Fail?
Thin platinum resistance thermometers exhibit non-linear temperature coefficients that diverge from the near-linear behavior of palladium-chromium at temperatures exceeding six hundred degrees Celsius. Platinum resistance characteristics follow the Callendar-Van Dusen relation, displaying curvature across extended temperature ranges. Palladium-chromium displays near-linear resistance changes up to 1073 K. This divergence causes the temperature-compensating balance point of a dual-element sensor to drift off null when the installation experiences wide temperature sweeps away from the design target.
Differential thermal aging between platinum and palladium-chromium thin films introduces additional tracking error. Platinum undergoes significant grain boundary migration, recrystallization, and contamination pickup from substrate elements at elevated temperatures. These metallographic shifts alter the nominal resistance of the platinum element independently of the palladium-chromium element, degrading bridge balance over time.
| Compensation Architecture | Residual Error Band (293 K to 1073 K) | Lead Wire Complexity | Sensor Footprint Area | Dynamic Thermal Response Tracking |
|---|---|---|---|---|
| Dual-Grid PdCr Half Bridge | ± 250 με | 3 or 4-wire installation | Expanded (> 25 mm2) | Moderate (thermal gradient sensitive) |
| Integrated PdCr / Pt Series Pair | ± 180 με | 2-wire or 3-wire bridge | Compact (< 15 mm2) | High (shared thermal zone) |
| Polynomial Software Correction | ± 60 με | 4-wire bridge + 2-wire TC | Minimal (< 10 mm2) | High (limited by TC time constant) |
| Dummy Coupon External Bridge | ± 450 με | 4-wire external loop | Remote installation | Poor (lagging coupon temperature) |

Polynomial Mathematical Compensation
Software-based zero-point adjustments compute real-time corrections through high-order polynomial equations calibrated during pre-test thermal exposure. A fourth-order polynomial curve captures non-linear apparent strain curvature across broad thermal sweeps:
εapp(T) = a0 + a1 T + a2 T2 + a3 T3 + a4 T4
The coefficients a0 through a4 derive from least-squares regression fits applied to apparent strain calibration datasets acquired at steady-state thermal intervals. The bridge voltage unbalances. The corrected true mechanical strain (εmech) emerges from the gross measured strain (εmeas):
εmech = εmeas – εapp(T)
Precise polynomial compensation requires that temperature measurements reflect the exact thermal condition of the active gauge grid. A temperature difference of only two kelvin between a reference thermocouple and the active strain grid introduces an apparent strain compensation error of approximately twenty-five to thirty-five microstrain on superalloy substrates.
Hardware bridge compensation eliminates thermal noise at the sensor, while polynomial digital compensation preserves mechanical bandwidth at the cost of processing latency.

Decay
Isothermal resistance wander represents an irreversible drift process caused by selective chromium oxidation and subsequent grain boundary relaxation. Long-term thermal exposure under static zero-strain conditions produces monotonic resistance shifts following classical oxidation kinetics. The drift rate accelerates.
In an unpassivated thin film, chromium reacts with ambient oxygen to form Cr2O3 scale, depleting the metallic core of its primary alloying component. Chromium depletion shifts the zero-point.
Because chromium atoms scattered throughout the palladium lattice suppress electrical conductivity, selective removal of chromium through surface oxidation increases the bulk electrical conductivity of the remaining filament. Isothermal drift in palladium-13 chromium thin films typically manifests as a steady, negative resistance change (ΔR / R0 < 0) over time at constant temperature. This resistance decay generates a false compressive drift in indicated strain records.
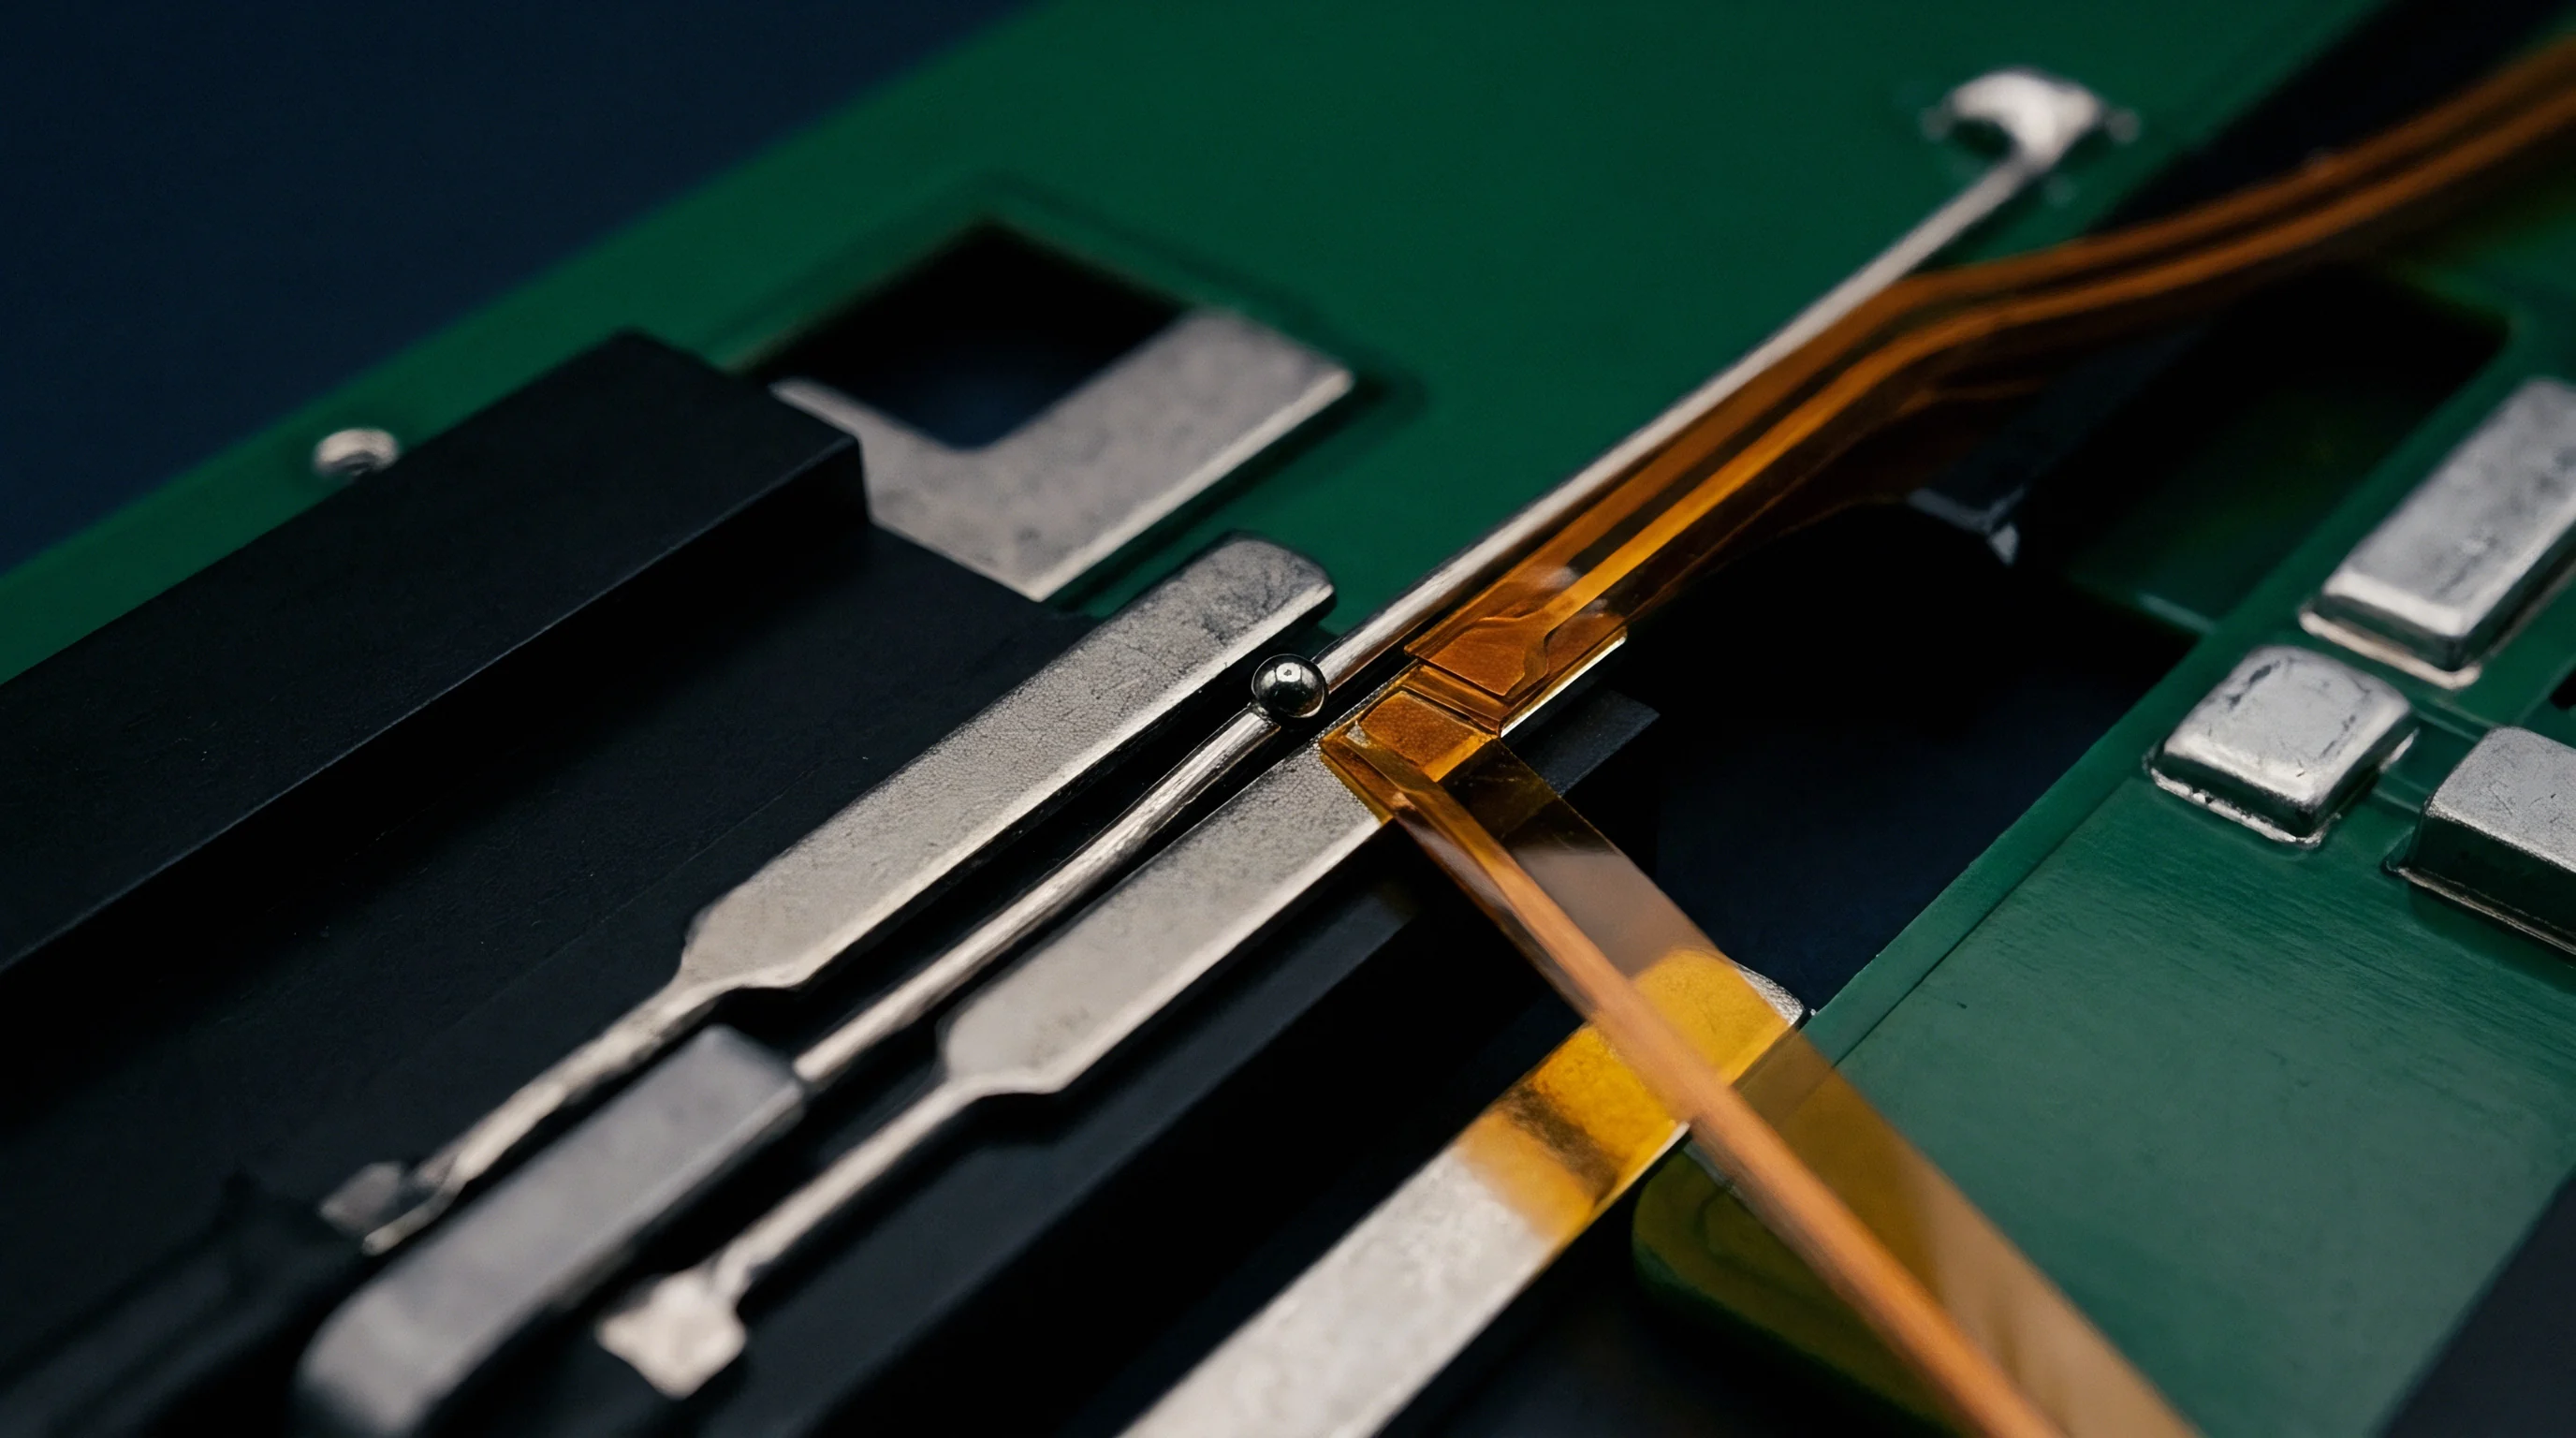
Isothermal Resistance Drift Formulations
Diffusion-controlled oxidation processes follow parabolic kinetic relationships over extended durations at elevated temperatures. The fractional change in resistance under steady-state isothermal soak conditions is expressed mathematically:
(ΔR / R0)drift(t) = – A · tn
In this formulation, t represents exposure time in hours, A represents a temperature-dependent rate constant governed by Arrhenius behavior, and n represents the kinetic exponent. Parabolic scaling dominates early oxidation. For pure diffusion-limited oxidation through a protective oxide scale, the kinetic exponent n approaches 0.50.
In real sputtered thin-film sensors, simultaneous grain boundary healing, structural defect annihilation, and mixed oxidation kinetics yield empirical exponents typically spanning 0.40 to 0.70.
The rate constant A depends heavily on absolute temperature, scaling with the activation energy of chromium diffusion within the palladium matrix:
A(T) = A0 · exp(- Q / (R · T))
Here, A0 represents a pre-exponential material constant, Q represents the activation energy for the degrading diffusion mechanism (approximately 160 to 210 kJ/mol for chromium diffusion in palladium thin films), R represents the universal gas constant (8.314 J/mol·K), and T represents absolute temperature in kelvin.
Converting indicated resistance drift into apparent drift strain (εdrift) requires scaling by the sensor gage factor Sg:
εdrift(t) = (1 / Sg) · (ΔR / R0)drift(t)

Worked Drift Calculation in High Temperature Testing
Static strain measurements during a fifty-hour soak at eight hundred degrees Celsius demonstrate how diffusion kinetics introduce uncorrected baseline offset. Assume a sensor installation characterized by the following verified baseline parameters:
Film gage factor Sg = 1.90. Operating temperature T = 1073 K (800 °C). Drift parameters determined by prior coupon calibration: kinetic exponent n = 0.50, and Arrhenius rate constant A = 1.80 × 10⁻⁴ h-0.5.
Active test duration t = 50 hours.
The fractional resistance shift at fifty hours computes directly from the parabolic formulation:
(ΔR / R0)drift(50) = – (1.80 × 10-4) · (50)0.5 = – (1.80 × 10-4) · (7.071) = – 1.273 × 10⁻³
The resulting accumulated drift strain calculation follows:
εdrift(50) = (1 / 1.90) · (- 1.273 × 10⁻³) = – 6.70 × 10-4 = – 670 με
The uncorrected sensor indicates an apparent compressive drift of 670 microstrain after fifty hours of isothermal hold, independent of any external mechanical loading on the test article. The average drift rate across this fifty-hour window evaluates to:
Drift Rate = (- 670 με) / (50 h) = – 13.4 με / h
Because drift kinetics follow a parabolic profile, the instantaneous drift rate decays over time. During the first hour of exposure, the instantaneous drift rate reaches – 94.7 microstrain per hour, whereas between hour 49 and hour 50, the instantaneous rate drops to – 9.5 microstrain per hour.
- Verify Pre-Conditioning History to confirm the sensor underwent at least thirty hours of air annealing at 1073 K before experimental data acquisition.
- Calculate Instantaneous Drift Rates across discrete test intervals rather than applying average linear rates across the complete test duration.
- Track Parabolic Kinetic Exponents during coupon characterization to identify whether defects originate from bulk diffusion or protective barrier cracks.
- Isolate Thermal Soaks From Dynamic Loads to prevent mechanical plastic deformation from confounding baseline isothermal drift logs.
Whether chromium diffusion within the bulk palladium matrix reaches an asymptotic steady state before depletion compromises sensor gage factor remains unsettled across multi-thousand-hour exposure profiles.


Contract
Procurement documentation for high-temperature thin-film strain sensors frequently omits the thermal cycle stabilization history needed to secure zero-point repeatability. Calibration certificates prove the variance. Specifying a thin-film strain installation for aerospace structural qualification requires establishing contractual tolerances for initial apparent strain scatter, thermal hysteresis, and maximum allowable isothermal drift rates.
Commercial agreements that cite ambient-temperature gage factor specifications while ignoring high-temperature apparent strain dispersion leave purchasing organizations vulnerable to invalid engine certification data.
Traceable calibration workflows link delivered sensors to verified thermal standards. Sputtering batches require qualification through sample coupon testing, where thin-film coupons undergo controlled oven profiling alongside calibrated Type S or Type N thermocouples traceable to national metrology institutes. Apparent strain profiles must demonstrate stability across three consecutive thermal runs prior to component installation.
Baseline apparent strain scatter between individual deposition runs exceeds contractual measurement tolerances unless batch qualification protocols enforce coupon witness testing.

Calibration Traceability across Thermal Cycles
Secondary laboratory standards for high-temperature strain testing link measurements to primary dimensional and electrical quantities defined under ISO/IEC 17025 accredited scopes. Thermal calibration furnaces utilize multi-zone heat control to limit thermal gradients along the sensor grid below one kelvin. Calibrated digital bridges record fractional resistance shifts with an expanded measurement uncertainty not exceeding 0.005 percent (ΔR / R0) at a coverage factor of k = 2.
The complete traceability chain connects the sensor readout through the bridge amplifier, precision decade resistance standards, reference platinum resistance thermometers, and national primary temperature realizations. If an installation vendor performs sensor calibrations using uncertified thermocouple readouts, the resulting apparent strain compensation polynomials carry unquantified systematic errors that scale throughout engine testing campaigns.

Acceptance Standards for Delivered Thin Film Sensors
Factory qualification dossiers specify thermal output scatter bands across three successive heating runs rather than quoting single-cycle vendor data. The first thermal cycle routinely exhibits anomalous hysteresis due to the relief of residual deposition stresses and final oxide growth. Conforming acceptance protocols require that cycle-to-cycle hysteresis between the second and third thermal ramps remain below a designated threshold across the entire operating range.
| Inspection Parameter | Contractual Threshold (1073 K) | Standard Test Method | Non-Conformance Consequence |
|---|---|---|---|
| Dielectric Isolation Resistance | ≥ 10.0 MΩ at 50 V DC | ASTM E251 Section 6 | Batch rejection; substrate isolation re-coating |
| Cycle-to-Cycle Apparent Strain Hysteresis | ≤ ± 75 με (Run 2 to 3) | ISO/IEC 17025 Protocol | Re-annealing; sensor stripping and re-deposition |
| Maximum Isothermal Drift Rate | ≤ 15.0 με / h (at 50 h soak) | In-House Witness Coupon | Vendor deduction; application of drift offsets |
| Gage Factor Tolerance Band | ± 3.0 % of nominal value | ASTM E251 Section 8 | Batch re-calibration; software correction update |
| Passivation Barrier Integrity | Zero blistering under 50x optical | Visual Inspection ASTM E3 | Direct lot rejection; overcoat chamber re-clean |
Invoking ASTM E251 Clause 8.2 establishes that the vendor supplies individual apparent strain polynomial coefficients derived from the third thermal stabilization run, eliminating unbudgeted baseline drift from the customer calibration ledger.