Implementing Bivariate Polynomial Thermal Compensation Surfaces in Embedded Transducer Firmware
Implementing bivariate polynomial thermal surfaces in firmware requires Horner evaluation of scaled Q1.31 fixed-point coefficients derived from Chebychev nodes.
Grid
Calibration of piezoresistive or capacitive transducers begins with empirical point acquisition inside an environmentally controlled chamber. A raw transducer response drifts across both applied pressure and ambient temperature. Piezoresistive silicon strain gauges exhibit positive temperature coefficients of resistance alongside negative temperature coefficients of gauge factor.
These opposing physical effects twist the sensor output into a non-linear, cross-coupled characteristic. Isolating individual primary axis signals requires constructing a two-dimensional matrix of reference points. The quality of the final compensation surface depends entirely on the stability and geometric distribution of this acquisition lattice.
Thermal Soak Dynamics and Reference Uncertainty
Chamber air temperature equilibrates long before internal sensor dies reach thermal stability. Packaging materials, ceramic substrates, silicon gel potting compounds, and metallic header pins possess disparate thermal conductivities and volumetric heat capacities. Raw piezoresistive bridges drift violently across temperature.
Attempting point collection while internal gradients persist introduces artificial hysteresis into the empirical dataset. A standardized soak period ensures that the sensing core matches the calibrated chamber reference probe within 0.05 degrees Celsius. Establishing this thermal plateau demands continuous monitoring of bridge resistance stability over time.
A thermal gradient of 0.15 degrees Celsius across a silicon die induces up to 0.08 percent full-scale span error in piezoresistive bridge transducers.
Reference instruments tracking the primary measurand and thermal conditions must hold calibrations traceable to national metrology institutes. A deadweight tester or quartz resonant reference barometer provides pressure tracking with expanded uncertainties below 0.01 percent of reading. Digital thermometers utilizing four-wire platinum resistance detectors maintain uncertainties below 0.03 degrees Celsius across the target range.
Calculating surface coefficients using substandard reference data guarantees permanent offset errors across all downstream units. Every acquired data pair ties directly to the uncertainty budget of the calibration rig.
Thermal equilibrium dictates chamber soak time. Transducer dies housed inside heavy stainless-steel pressure ports demand soak periods exceeding forty-five minutes per temperature setpoint. Rushing this step produces apparent non-repeatability between rising and falling temperature runs.
Gradients destroy calibration surface validity.

Point Distribution across the Operational Envelope
Placing test coordinates at uniform intervals introduces substantial Runge oscillations at operating extremes. Polynomial surfaces fitted over equidistant points tend to diverge sharply near the boundaries of the calibration domain. Distributing temperature and pressure setpoints according to Chebychev node distributions minimizes interpolation ripple.
Clustered sampling near the operational limits restrains edge divergence without necessitating higher polynomial degrees. The physical limits of the transducer dictate the boundary coordinate placement.
Orthogonal test points prevent singular matrices. The test matrix requires balancing mathematical rigor against the financial reality of environmental chamber run times.
- Piezoresistive Bridge Offset Shift represents the temperature-dependent change in zero-pressure electrical balance caused by doping asymmetries and residual packaging stresses.
- Piezoresistive Sensitivity Drift originates from the reduction of piezoresistive gauge factors at elevated lattice temperatures, which flattens the pressure-to-voltage response curve.
- Substrate Mismatch Hysteresis occurs when differential thermal expansion between silicon membranes and borosilicate glass pedestals generates non-recoverable mechanical strain loops.
- Bridge Nonlinearity Curvature manifests as a pressure-dependent sensitivity variation that flexes further away from linear behavior under extreme temperature swings.
A typical calibration grid covers five temperature plateaus and seven primary pressure increments, generating thirty-five discrete measurement pairs. Gathering redundant measurements at the baseline reference temperature allows firmware developers to quantify and decouple pure uncompensated thermal drift from mechanical creep. Collecting data across both ascending and descending thermal runs exposes internal friction and packaging strain relaxation before regression algorithms process the surface numbers.
| Lattice Configuration | Calibration Nodes | Condition Number | Maximum Edge Error | Chamber Duration |
|---|---|---|---|---|
| Equidistant 3×3 Grid | 9 | 4.82e+08 | 0.380 percent FS | 3.5 Hours |
| Equidistant 5×7 Grid | 35 | 1.24e+11 | 0.145 percent FS | 12.0 Hours |
| Chebychev 4×5 Grid | 20 | 6.10e+05 | 0.042 percent FS | 7.5 Hours |
| Chebychev 5×7 Grid | 35 | 8.45e+06 | 0.018 percent FS | 12.5 Hours |
Failure to eliminate thermal gradients during grid collection produces skewed coefficient sets that fail temperature qualification audits and generate warranty returns across seasonal field transitions.

Surface
Mathematical correction of coupled transducer non-linearity maps raw analog-to-digital counts directly to calibrated physical units. The physical interaction between temperature and pressure on a micromachined membrane lacks mechanical isolation. Silicon piezoresistors show pronounced non-linear sensitivity.
A bivariate polynomial creates a smooth mathematical topography over the raw dual-input space, converting raw digital pressure counts and raw digital temperature readings into a single linear output. Selecting the appropriate mathematical degrees for the primary and secondary axes decides whether the model achieves high fidelity or degenerates into severe numerical instability.

Formulation of the Bivariate Equation
A dual-variable power series expresses compensated output as a sum of scaled monomial products. Let variable X represent normalized raw pressure counts from the analog front end, and let variable Y represent normalized raw temperature counts. The bivariate polynomial models the corrected output pressure P through a double summation:
P(X, Y) = sum from i=0 to N of sum from j=0 to M of (A_ij X^i Y^j)
The integer index N represents the polynomial degree along the primary measurand axis, while M designates the degree along the thermal axis. For modern piezoresistive microelectromechanical transducers, third-degree modeling in pressure (N=3) paired with third-degree modeling in temperature (M=3) captures both span temperature coefficients and thermal zero shifts. This full cross-coupled surface requires determining sixteen distinct coefficients from A_00 through A_33.
Cross-terms capture thermal sensitivity shift.
Polynomial degree expansion beyond the third order typically amplifies boundary errors instead of smoothing them.
Solving for these coefficients relies on linear least-squares regression applied to the empirical calibration matrix. Constructing the Vandermonde matrix from raw integer counts produces numbers that differ by tens of orders of magnitude. A 24-bit analog front end produces numbers near 16 million; raising that count to the third power yields values exceeding 4e+21.
Direct inversion of unnormalized Vandermonde matrices produces catastrophic numerical roundoff, driving the matrix condition number into complete singularity. Data normalization rescales raw integer inputs to a balanced range between negative one and positive one before matrix inversion begins.

Horner Nested Form for Computational Stability
Direct evaluation of high-degree terms causes devastating catastrophic cancellation when subtraction occurs between nearby large numbers. Transforming the bivariate polynomial into nested Horner form minimizes the raw multiplication count while preserving numerical precision. Expressing the equation as nested single-variable polynomials reduces the computational workload from exponential monomial evaluations to a sequence of multiply-accumulate operations.
The bivariate formulation nests the primary variable evaluations inside coefficients dictated by the secondary variable:
P(X, Y) = C_0(Y) + X (C_1(Y) + X (C_2(Y) + X C_3(Y)))
Each thermal parameter C_k(Y) resolves through an identical nested evaluation along the temperature dimension:
C_k(Y) = A_k0 + Y (A_k1 + Y (A_k2 + Y A_k3))
Computing the surface via Horner form strips the computational footprint down to twelve multiplications and twelve additions for a complete sixteen-coefficient bicubic surface. Horner forms minimize intermediate rounding errors. This algorithmic structure executes within tight loop boundaries, maintaining high deterministic efficiency across low-cost microcontrollers lacking floating-point hardware.
When higher order terms begin magnifying boundary ripples, reducing polynomial degree stabilizes the interpolated surface far better than adding calibration points.


Arithmetic
Execution of compensation polynomials inside microcontrollers confronts strict register bit-width and execution cycle budgets. Many ultra-low-power industrial field transmitters rely on ARM Cortex-M0+ or RISC-V cores lacking dedicated floating-point units. Floating point instructions consume processor cycles.
Emulating IEEE 754 single-precision floating-point arithmetic through software libraries inflates code size by several kilobytes and drags conversion times into millisecond territory. Fixed-point representations deliver deterministic latency and low microampere current draw, provided that fractional word sizing receives meticulous mathematical treatment.

Where Does Truncation Error Overwhelm Integer Arithmetic?
Fixed-point mathematics avoids hardware floating-point unit dependencies in low-power embedded processors. A standard 32-bit signed integer format partitions register width into sign, integer, and fractional domains. The Q15.16 format allocates fifteen bits to integer magnitude and sixteen bits to the fractional tail, while the Q1.31 format handles normalized inputs bounded strictly between negative one and positive one.
Q31 arithmetic preserves fractional resolution. When evaluating successive products in nested Horner forms, multiplying two 32-bit values produces a 64-bit intermediate result.
Integer overflow during intermediate Horner term evaluation silently flips numerical signs and corrupts actuator control loops.
Truncating this intermediate 64-bit value back to 32 bits discards the least significant bits, injecting quantization noise into the calculation stream. Rounding accumulates across successive multiplications. If coefficient scaling fails to account for intermediate dynamic growth, intermediate registers saturate or overflow.
Integer overflow causes sudden output clipping. In industrial closed-loop valve positioners, a single sign flip caused by integer wrap-around drives pneumatic actuators to full scale, tripping safety shutoff systems.
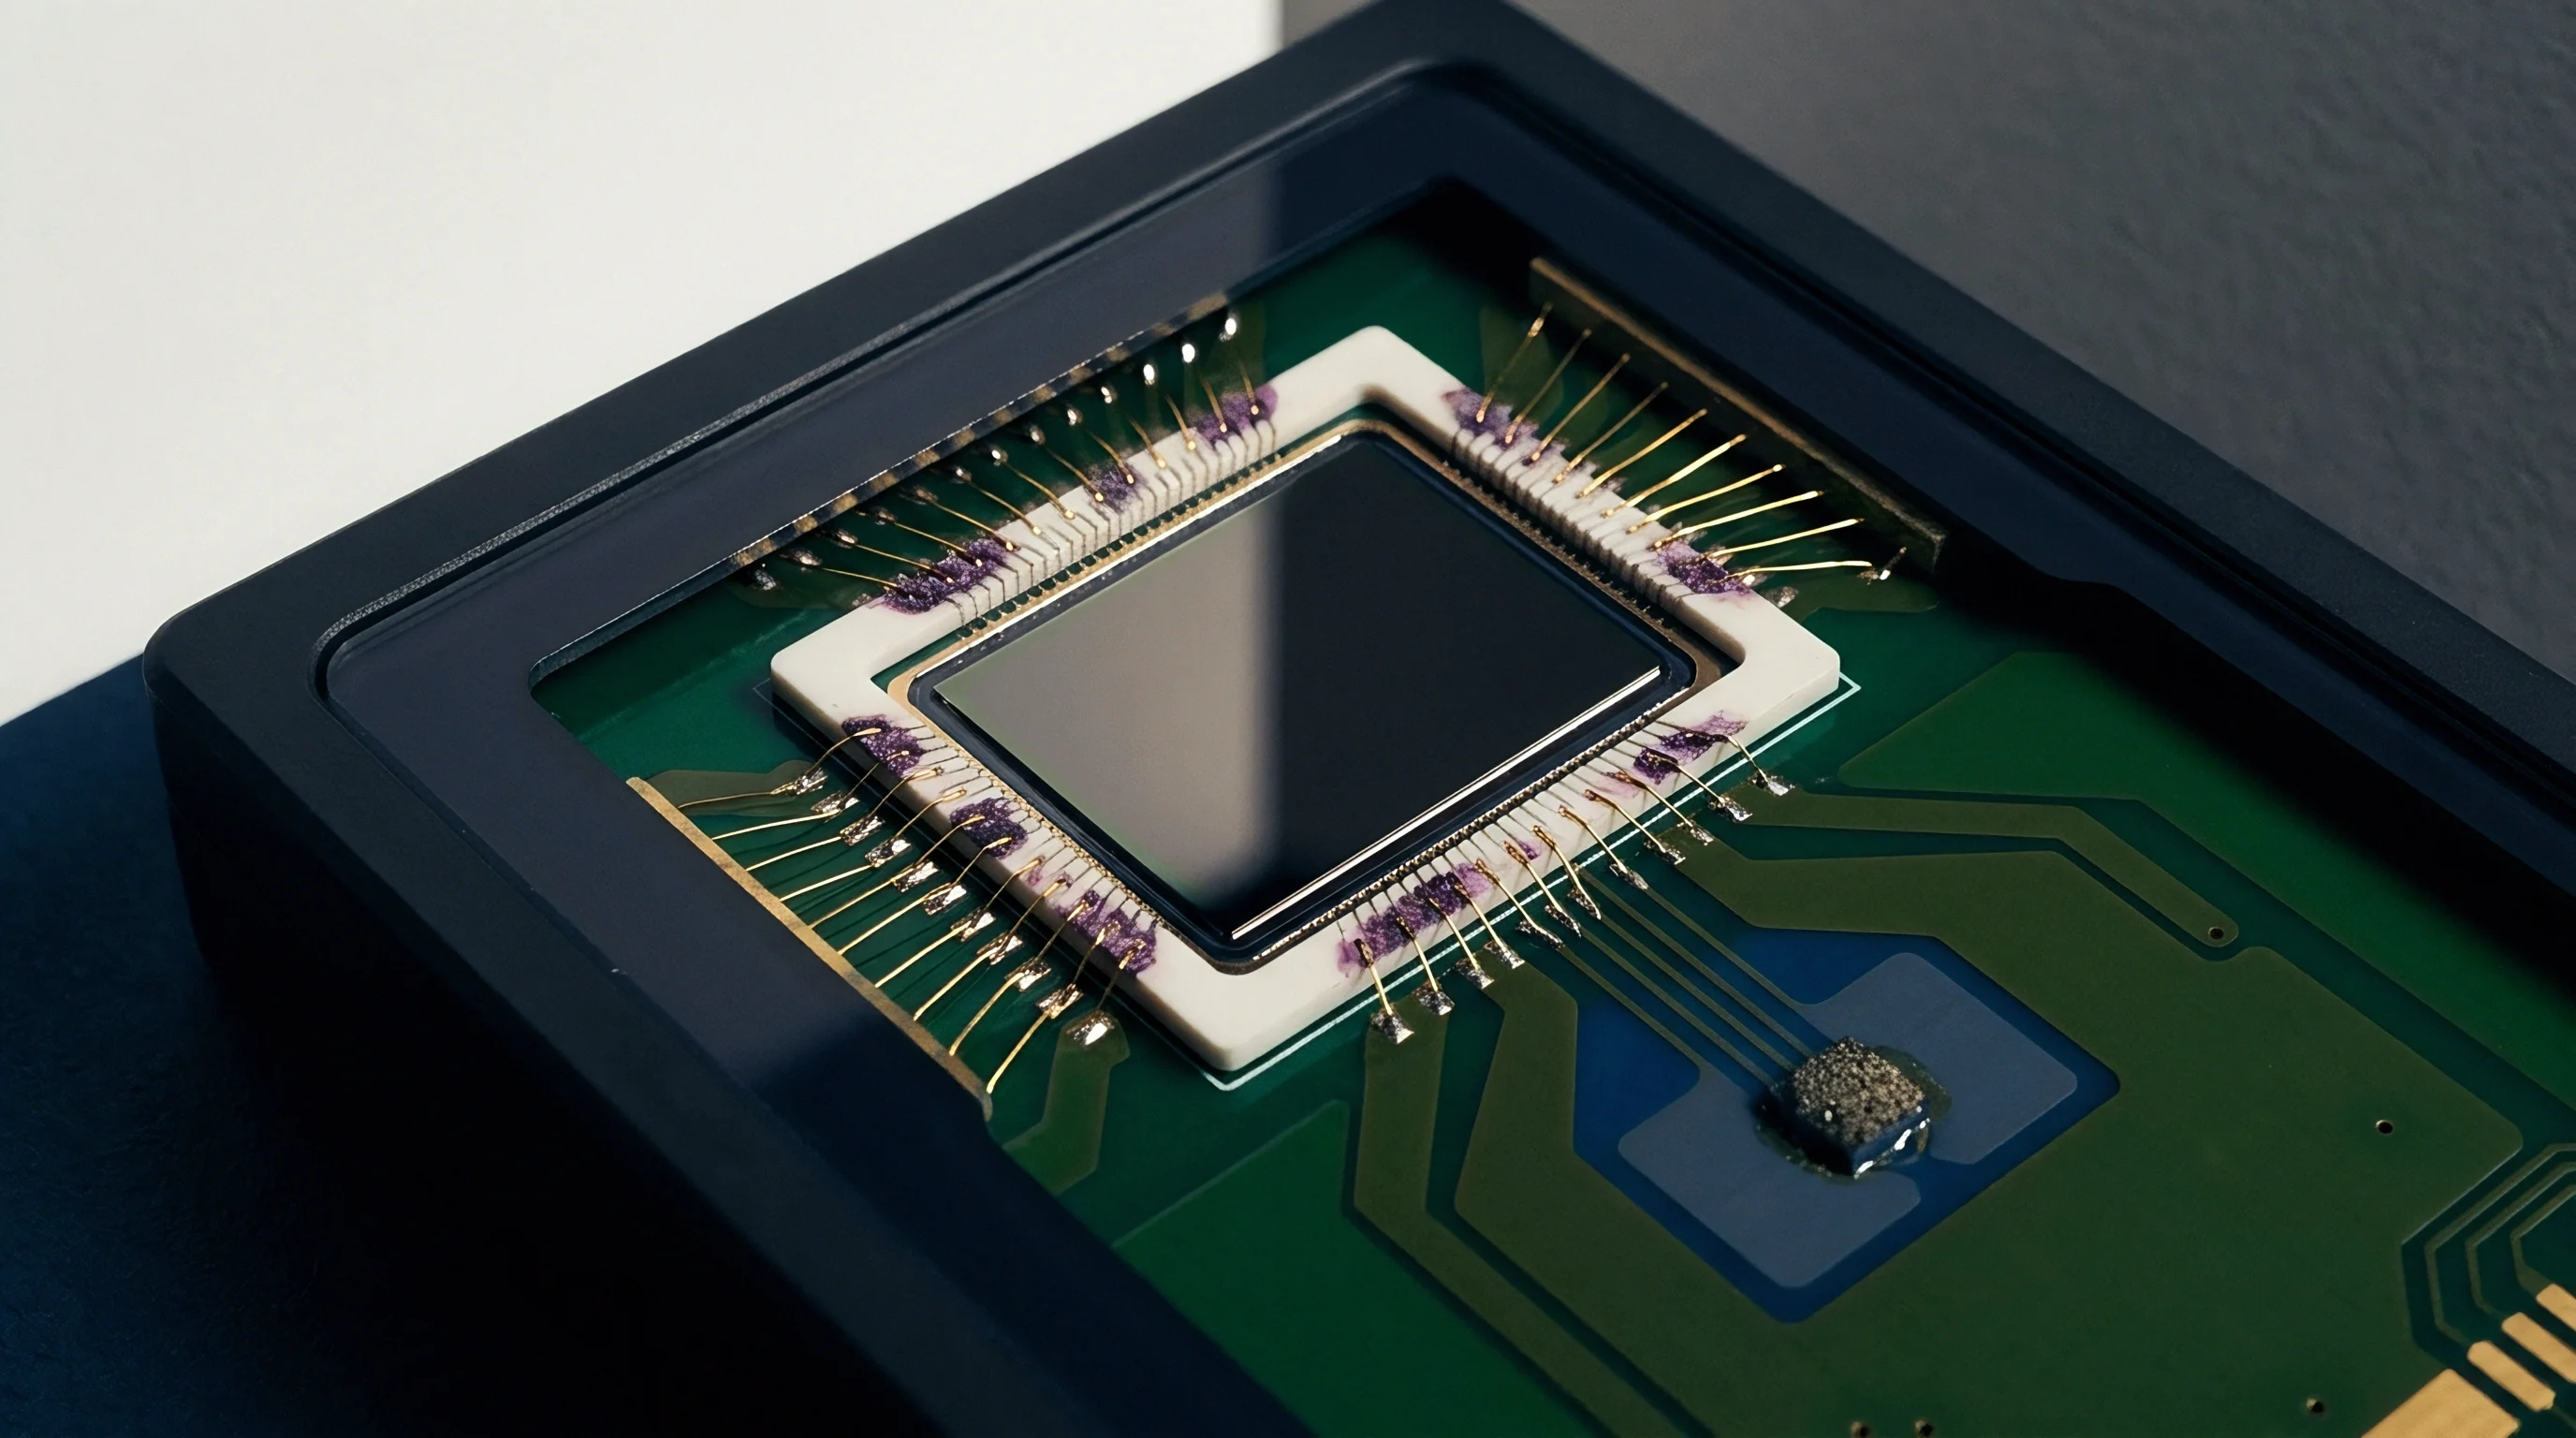
Fixed Point Scaling and Q Format Selection
Implementing a bicubic compensation surface within a fixed-point pipeline requires systematic scaling of the sixteen calibration coefficients. Because polynomial coefficients decrease in magnitude as monomial degree increases, storing all coefficients in a single rigid Q format forfeits significant resolution. High-order cross-term coefficients often sit five orders of magnitude below zero-order offset terms.
Storing an A_33 coefficient in standard Q15.16 leaves the most significant bits entirely populated by dead zeros, truncating the operational numbers down to a handful of noisy bits.
A structured coefficient container pairs every polynomial constant with an individual scale factor or shifts each term into a dedicated Q format:
- ADC Conversion Stage normalizes raw 24-bit signed unipolar sensor counts into a scaled signed Q1.31 fractional variable through subtraction of zero-point offsets and multiplication by a pre-computed span reciprocal.
- Temperature Kernel Evaluation computes the four intermediate thermal functions using 64-bit multiply-accumulate operations, shifting results down to prevent 32-bit register saturation before output generation.
- Cross Term Accumulation evaluates the outer Horner pressure pipeline, applying individual arithmetic shifts to match dissimilar intermediate coefficient scaling formats without losing precision.
- Physical Scale Output Formatting expands the final normalized Q1.31 pressure result into engineering units through a single multiplication against the calibrated range constant, storing the result in the active transmission buffer.
| Execution Engine | Flash Memory Footprint | Execution Duration | Current Consumption | Max Numerical Deviation |
|---|---|---|---|---|
| Software IEEE 754 Float | 3,840 Bytes | 412 Microseconds | 1.82 Milliamps | Reference Zero |
| Software IEEE 754 Double | 7,210 Bytes | 1,640 Microseconds | 1.85 Milliamps | 1.2e-07 LSB |
| Fixed-Point Uniform Q15.16 | 420 Bytes | 18 Microseconds | 0.45 Milliamps | 42.5 LSB |
| Fixed-Point Scaled Q1.31 | 580 Bytes | 24 Microseconds | 0.46 Milliamps | 0.8 LSB |
| Execution times measured over 10,000 continuous conversion cycles; current figures include core execution plus internal analog regulator draw. | ||||
The foundry representatives maintained that standard integer truncation noise remains safely buried below the analog front-end thermal noise floor.

Span
Production validation assesses whether the mathematical correction holds across the full operational range. A compensation surface that tracks calibration points perfectly can still reveal major interpolation deviations when tested at intermediate pressures and thermal plateaus. Residual error bands dictate factory yield.
Verification requires submitting a statistically significant sample of programmed transducers to multi-point environmental profiles distinct from the grid points utilized during calibration regression.
Why Do Static Matrix Inversions Degrade over Operating Life?
Coefficients calculated during factory characterization reflect mechanical stress profiles present at the time of manufacturing. Silicon membranes bonded to glass headers through anodic bonding experience gradual relaxation of internal lattice strains over months of thermal cycling. This metallurgical relaxation produces long-term zero drift, shifting the fundamental plane of the compensation surface.
Thermal hysteresis evades polynomial compensation. Furthermore, exposure to moisture ingress alters dielectric values across capacitive sensor cells, introducing parasitic phase angles that the original factory matrix cannot correct.
Piezoresistor metal contacts also experience subtle electromigration under sustained excitation currents. This aging process changes the initial bridge resistance balance. If the sensor firmware relies on a static, immutable coefficient array burned into non-volatile memory during factory calibration, the initial accuracy window narrows relentlessly across field operation.
High-tier industrial transducers counter this drift by embedding field-accessible offset adjustment registers, which translate the entire bivariate surface vertically along the primary output axis without modifying the underlying curvature coefficients.

Residual Error Bands and Coverage Factors
Subtracting polynomial surface predictions from verified reference standards yields a map of local compensation errors. These residuals represent the sum of unmodeled sensor non-linearity, measurement noise, and mathematical fitting compromises. Defining the stated accuracy of the transducer demands establishing an expanded uncertainty statement compliant with international metrological guidelines.
ISO 10012 clause 7.3 binds production acceptance directly to documented measurement uncertainty rather than raw instrument display values.
The total expanded uncertainty U combines several distinct physical and mathematical variances:
U = k sqrt(u_ref^2 + u_fit^2 + u_trunc^2 + u_hys^2 + u_drift^2)
The parameter k represents the coverage factor. Setting k equal to two establishes an approximate 95 percent level of confidence, standard for industrial instrumentation. The component u_ref accounts for reference standard uncertainty, u_fit isolates polynomial surface fitting residuals, u_trunc quantifies fixed-point firmware rounding loss, u_hys captures maximum observed thermal and mechanical hysteresis, and u_drift estimates long-term drift between annual calibration intervals.
A rigorous calibration certificate must document the parameters underpinning the surface verification dossier:
- Traceable Reference Identification details the unique serial numbers, accreditation scopes, and active calibration due dates for all environmental chambers and primary standards.
- Expanded Uncertainty Budget tabulates the individual standard uncertainty contributions alongside the final coverage factor and calculated boundary confidence intervals.
- Environmental Test Boundaries records the verified ambient pressure, relative humidity, and thermal extremes applied during acceptance testing.
- Residual Deviation Matrix maps the maximum recorded delta between reference standards and compensated device output across all qualification nodes.
Incorporation of ISO/IEC 17025 clause 7.8.4 forces vendors to report actual expanded calibration uncertainty alongside surface residuals, exposing hidden sensor drift before assembly acceptance.

Ledger
Financial balance sheets reveal that calibration time inside multi-stage thermal chambers accounts for the largest fraction of transducer assembly expense. Cleanroom fabrication, silicon wafer etching, and electronic component placement represent highly parallelized operations where volume scales amortize machine depreciation. Environmental characterization, conversely, creates a physical bottleneck.
Transducers must sit inside thermal chambers while massive heat sinks and heating coils force slow atmospheric transitions. Chamber cycle time drives unit cost. Balancing mathematical compensation accuracy against commercial viability forms the primary manufacturing trade-off.
Chamber Residence Time and Point Decimation
Thermal dwell periods create massive production bottlenecks during factory test routines. A single automated calibration run collecting a five-by-seven grid across five thermal plateaus requires twelve hours of chamber operation. Operating an industrial environmental chamber carrying fifty sensor manifolds incurs significant facility power, maintenance, and capital depreciation expenses.
Ten extra points triple calibration overhead. To lower unit manufacturing costs, production managers aggressively reduce calibration matrices down to the absolute mathematical minimum.
| Surface Order | Calibration Points | Chamber Time | Test Cost per Unit | Target Accuracy |
|---|---|---|---|---|
| Bilinear (N=1, M=1) | 4 Nodes | 1.8 Hours | $3.20 USD | 1.50 percent FS |
| Biquadratic (N=2, M=2) | 9 Nodes | 4.2 Hours | $7.45 USD | 0.25 percent FS |
| Bicubic (N=3, M=3) | 16 Nodes | 8.5 Hours | $15.10 USD | 0.05 percent FS |
| High-Density Grid | 35 Nodes | 16.0 Hours | $28.50 USD | 0.02 percent FS |
Decimating points without sacrificing product performance requires implementing batch-level statistical modeling. Instead of mapping sixteen individual points for every individual unit, factory software applies a hybrid compensation strategy. High-order non-linear curvature terms are characterized across a small sample of representative silicon dies taken from each production wafer run.
Individual production units then undergo a rapid four-point or six-point calibration cycle. The firmware combines the generic wafer-level curvature surface with individualized low-order offset and sensitivity trim factors, slashing chamber residence times by more than sixty percent.

Yield Balance against Warranty Exposure
Scrapping assemblies that fail strict verification thresholds directly increases landed bill-of-materials costs. If a production specification mandates an expanded uncertainty of 0.05 percent full-scale across a wide automotive temperature range, minor thermal fitting errors cause catastrophic yield collapse. A calibration matrix that lacks sufficient point density produces interpolation swings exceeding the error band, turning functional sensors into scrap.
Conversely, relaxing verification tolerances protects immediate factory yields while transferring severe financial liabilities to long-term warranty reserves. In process automation and chemical manufacturing, an unmodeled 0.2 percent thermal drift translates to massive volumetric measurement discrepancies over months of continuous transfer pumping. Transducer buyers faced with failing field audits levy warranty clawback penalties that vastly exceed initial procurement savings.
Procuring verified measurement accuracy requires pricing both the factory calibration chamber run and the mathematical rigor embedded within the sensor firmware.
Whether automated on-chip regression engines can someday replace factory chamber characterization without inflating silicon die cost remains unresolved across high-volume transducer manufacturing.