Triaxial Strain Rosette Signal Acquisition during Board Depaneling Audits
Triaxial strain rosette signal acquisition during depaneling audits requires simultaneous 50 kHz sampling and 10 kHz anti-aliasing filtering to capture true strain peaks.
Mount
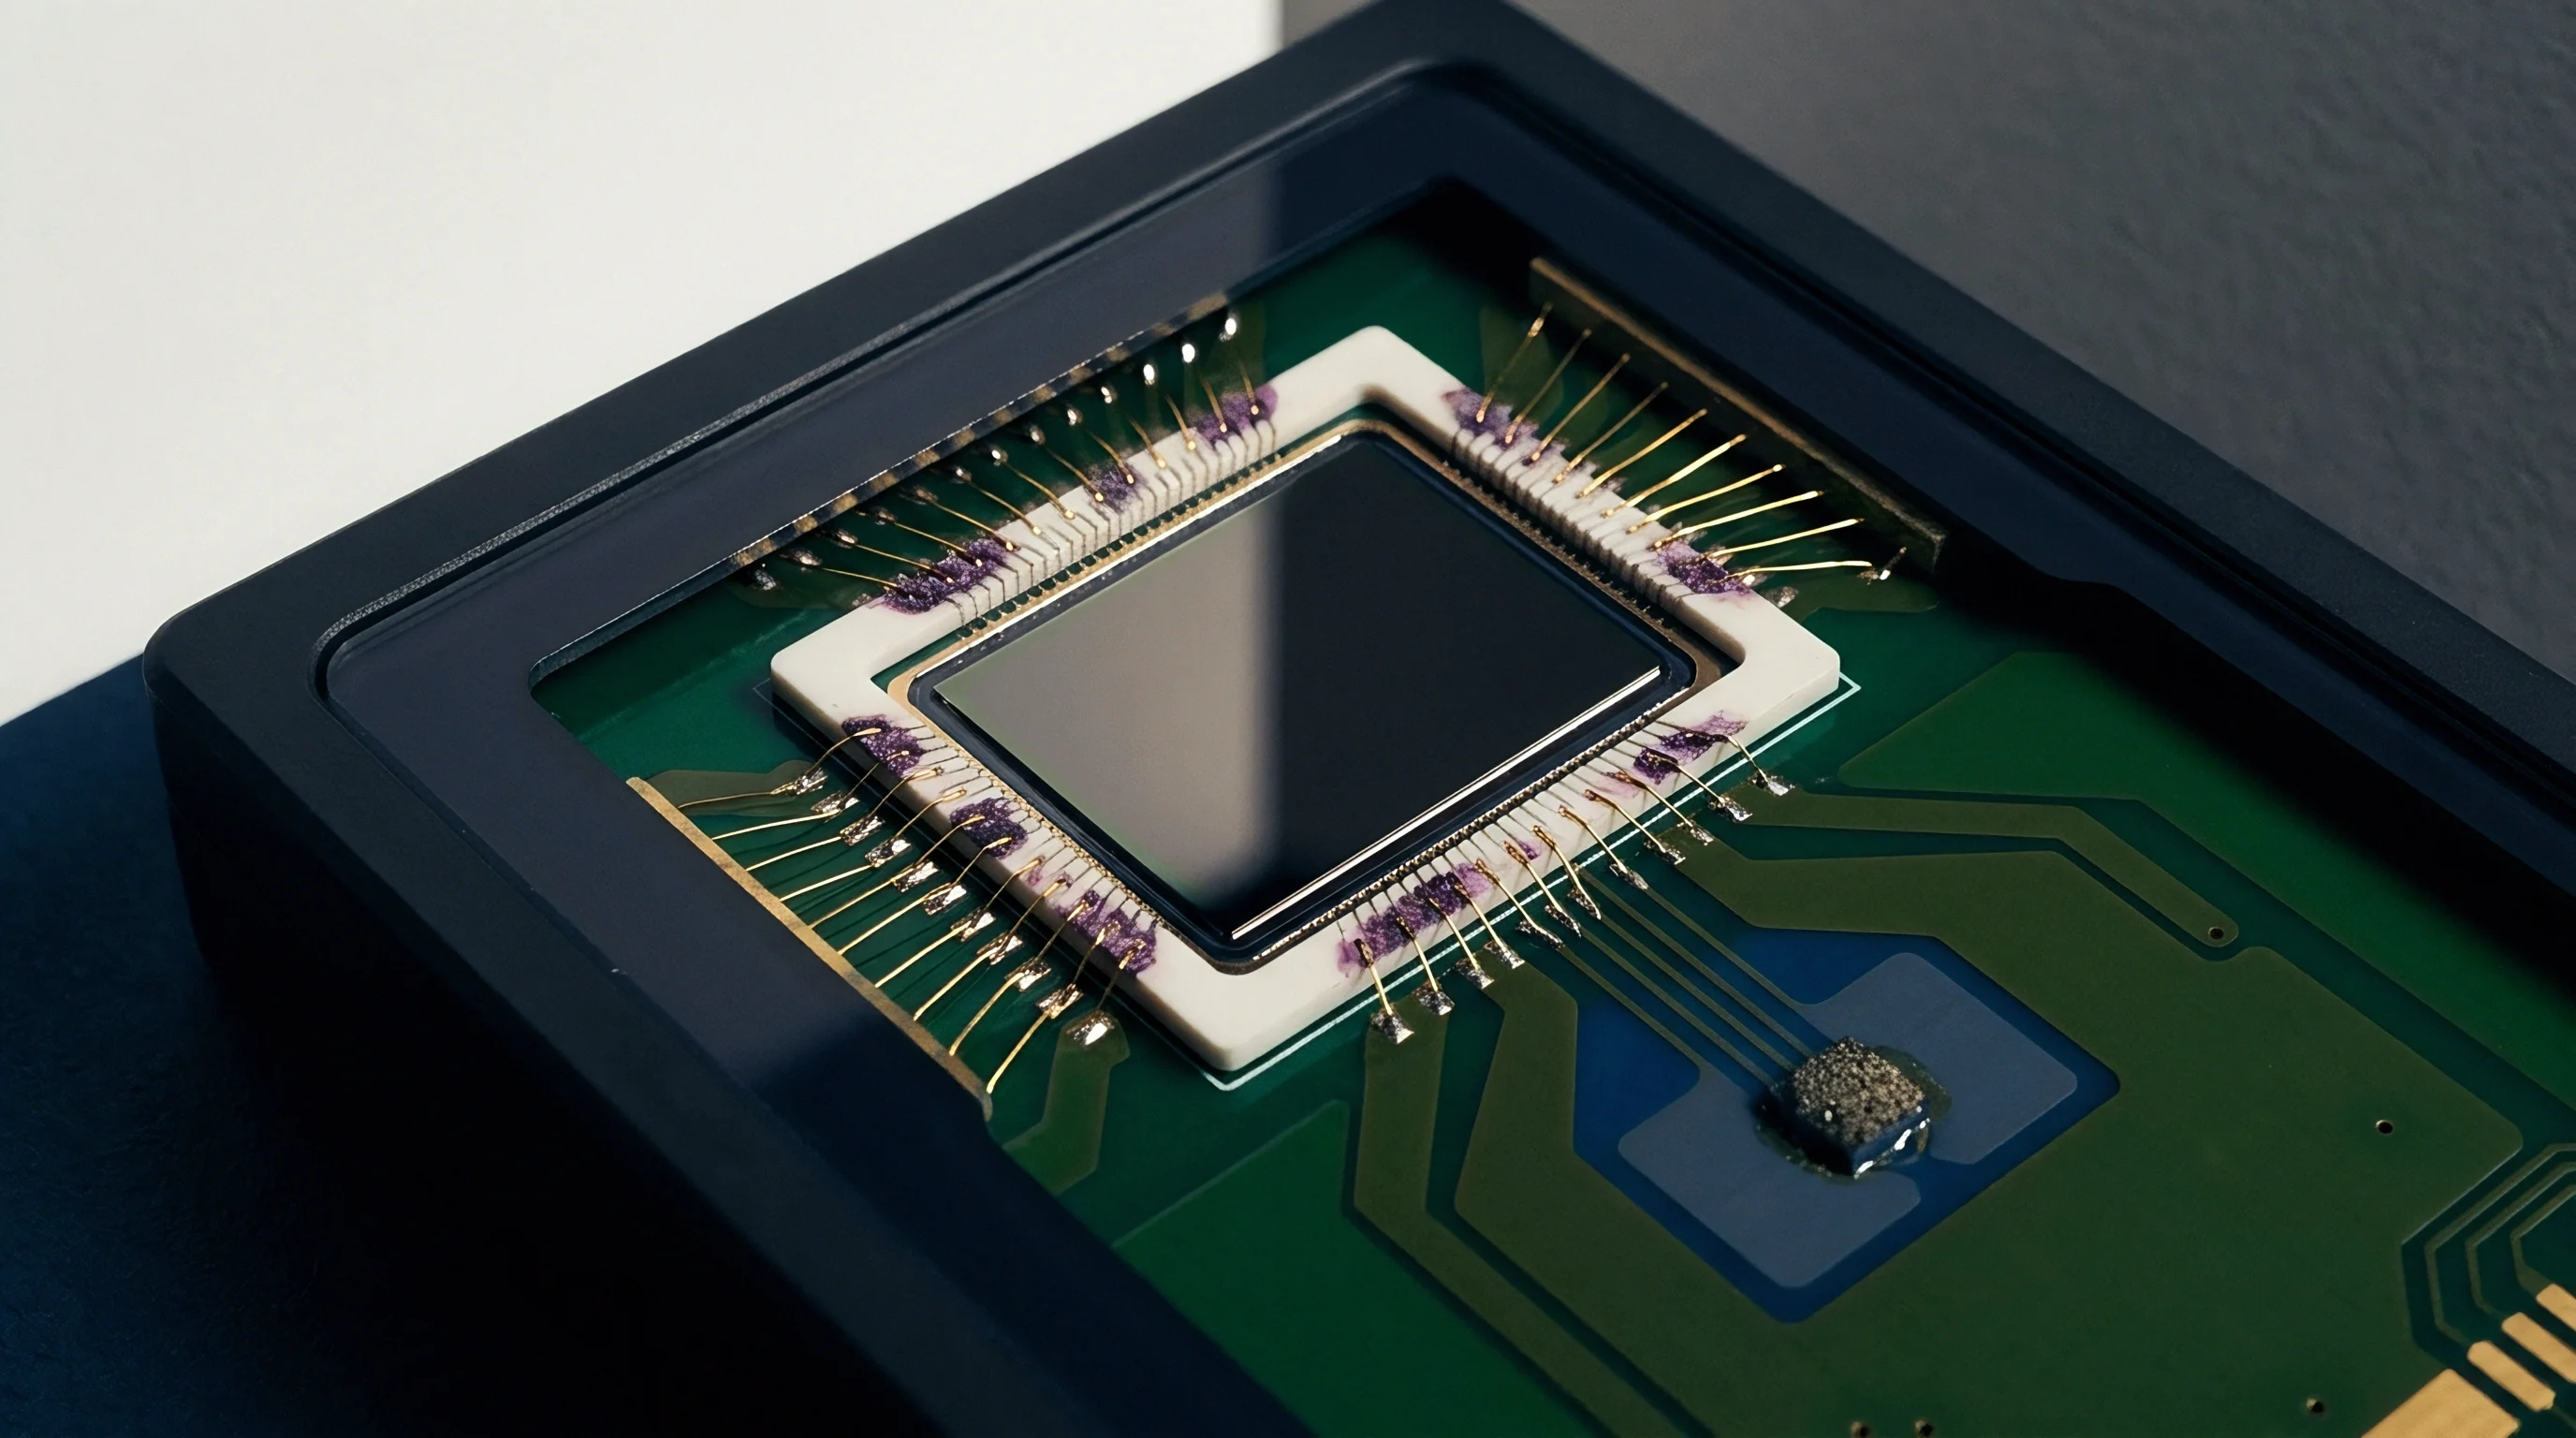
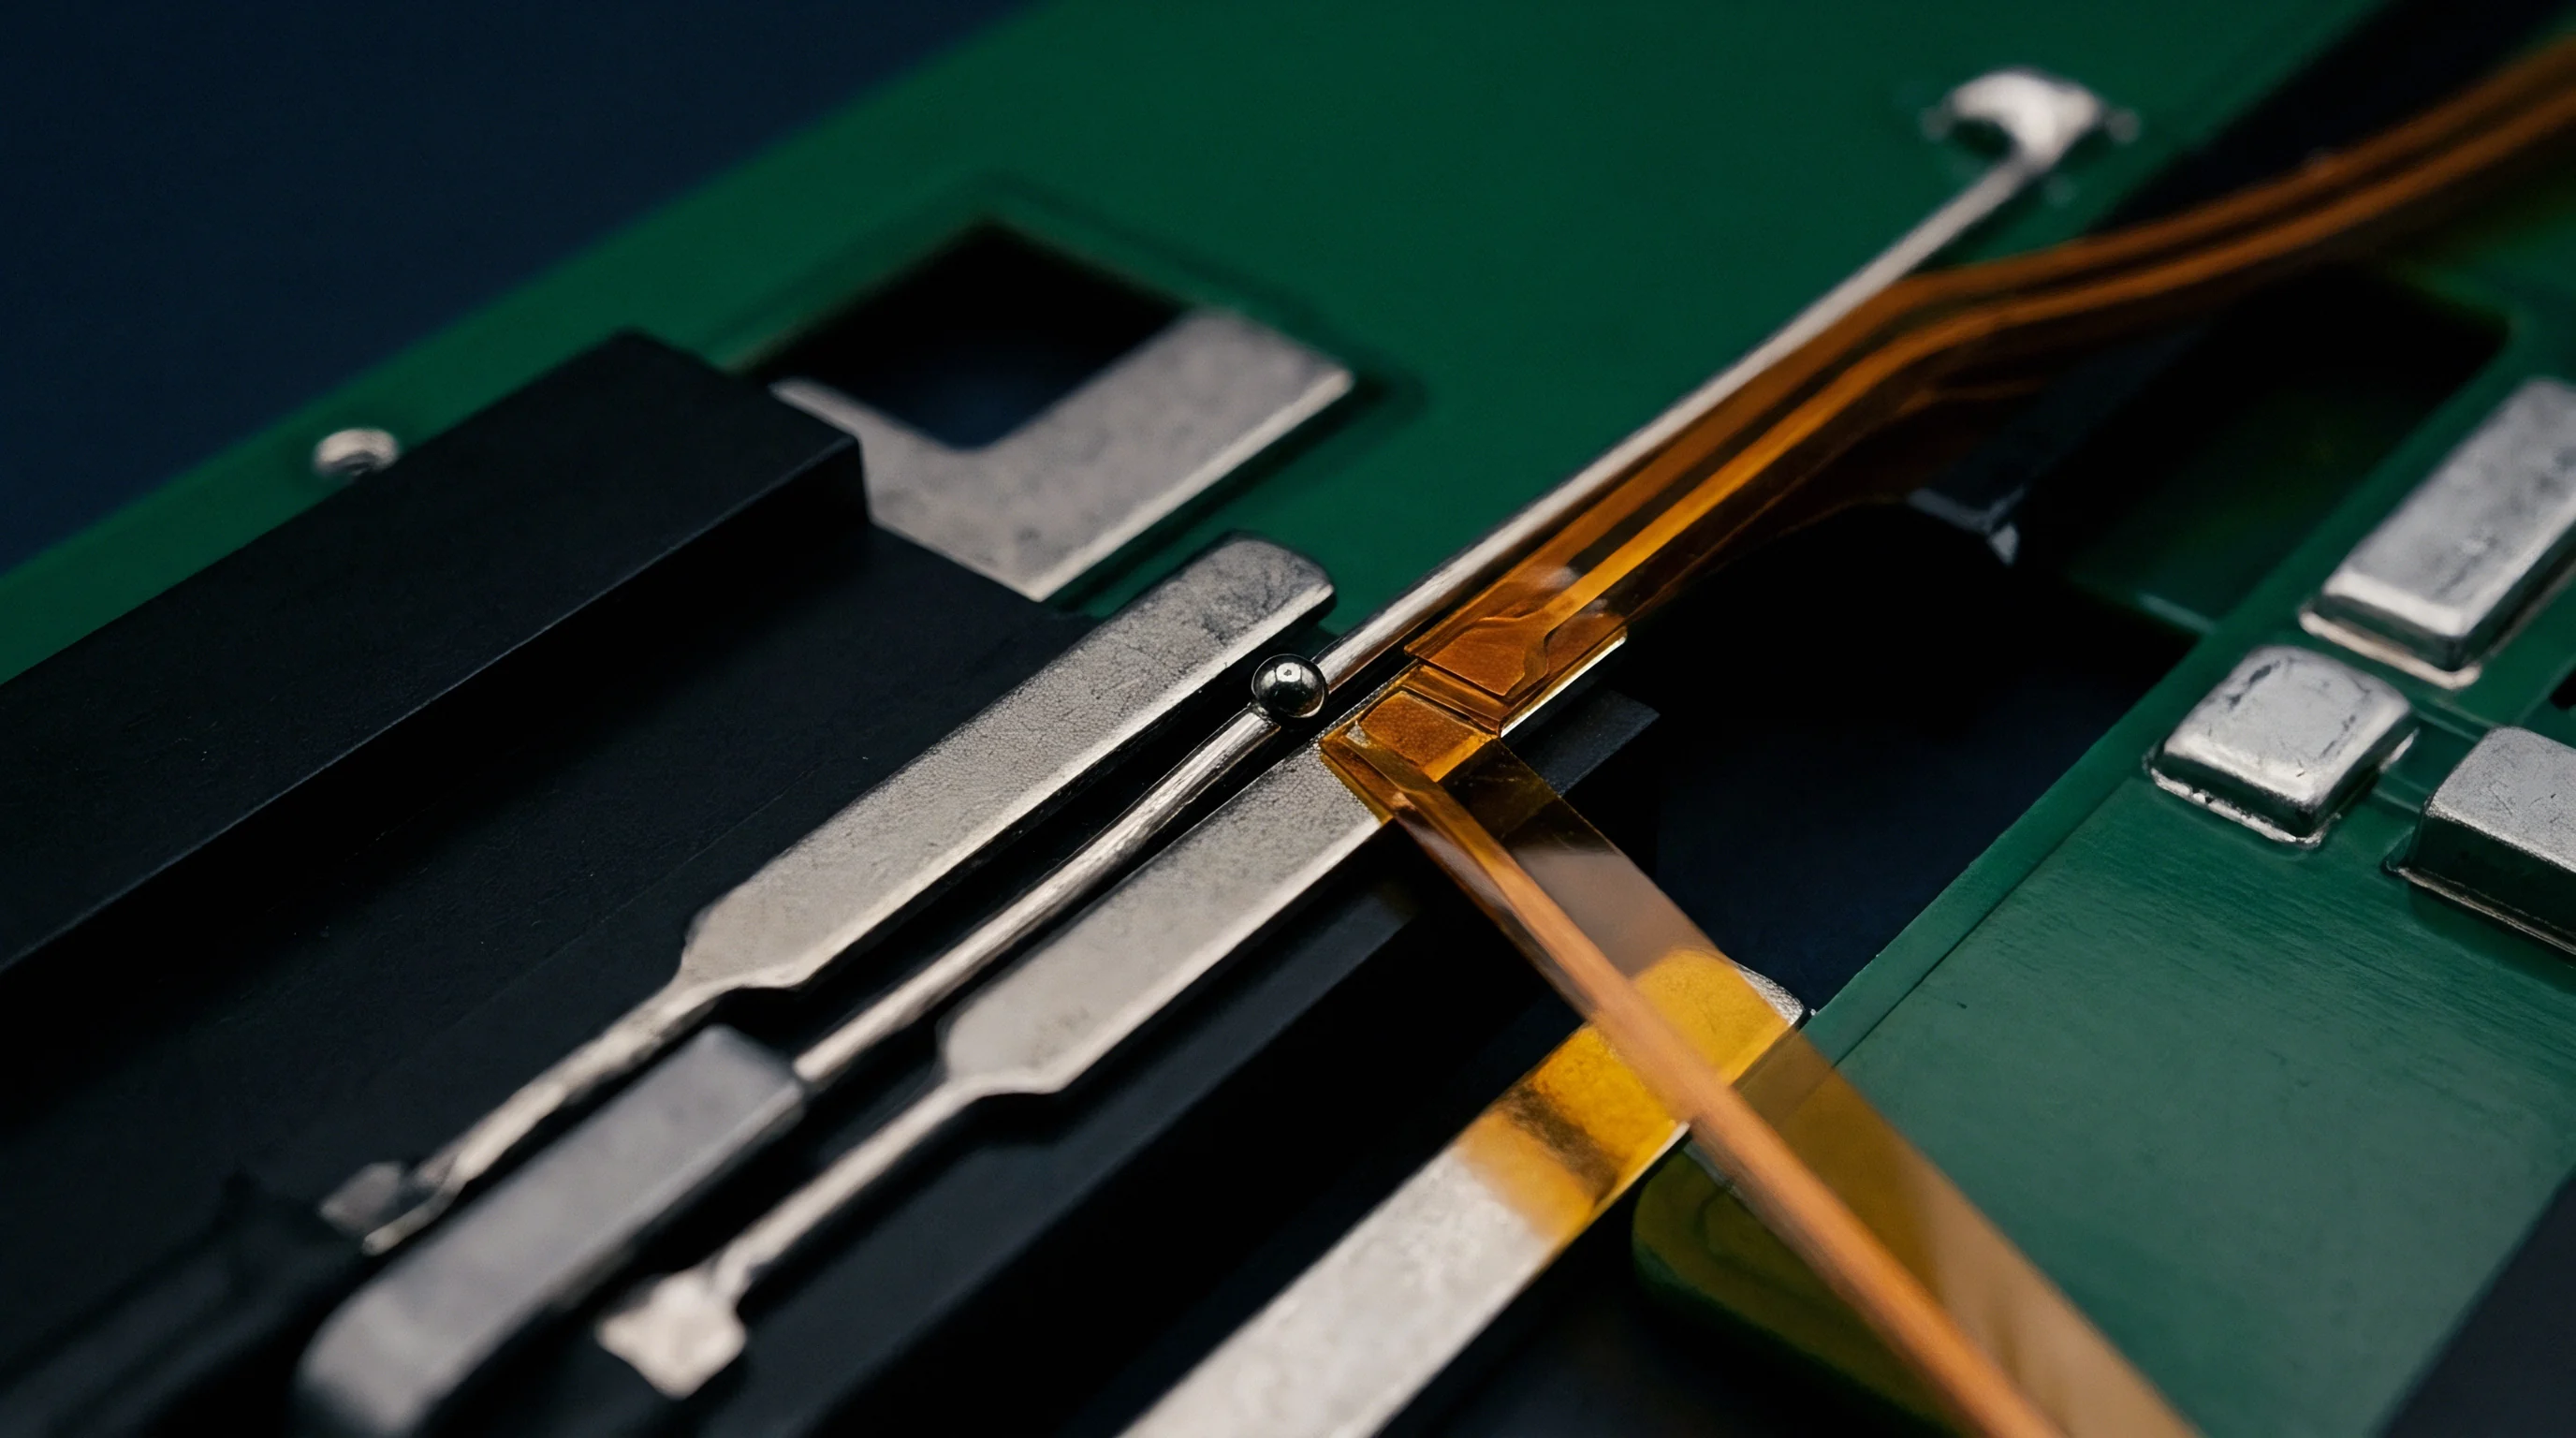
Precision strain measurement during printed circuit board singulation depends entirely on the mechanical coupling between the board substrate and the sensing element. During mechanical routing, V-scoring, or laser depaneling, transient physical waves propagate through FR-4 and high-density interconnect laminates at speeds exceeding 2,000 meters per second. Capturing these high-frequency strain transients without mechanical damping or phase lag demands rigorous surface preparation and exact rosette package selection.
A triaxial rosette integrates three independent strain gauge grids, typically arranged at 0-degree, 45-degree, and 90-degree orientations, onto a single polyimide backing film to resolve the complete two-dimensional planar strain tensor.
Selecting between planar and stacked rosette geometries fixes the physical boundaries of measurement accuracy. Planar triaxial rosettes place all three gauge elements directly on the copper or laminate surface within a single plane. This arrangement eliminates thermal gradient discrepancies across grids and avoids z-axis distance offsets.
However, planar configurations occupy a larger board footprint, typically requiring a 5.5 millimeter by 5.5 millimeter clear area on the target assembly. Stacked triaxial rosettes layer the 45-degree and 90-degree grids directly above the 0-degree grid, reducing the surface footprint to roughly 2.0 millimeters by 2.0 millimeters. The structural height of a stacked rosette introduces a 0.75 millimeter vertical offset from the laminate neutral axis, which generates false strain readings when the circuit board undergoes severe out-of-plane bending during edge-clamping or router bit engagement.
Adhesive layer thickness exceeding 5 micrometers induces viscoelastic shear lag that systematically attenuates high-frequency strain peaks above 2 kilohertz.
Surface preparation controls the bondline integrity. Solder mask must be mechanically cleared using 400-grit silicon carbide abrasive paper, followed by surface degreasing using isopropyl alcohol or acidic surface cleaners. Methyl-2-cyanoacrylate adhesive serves as the standard bonding agent for short-duration depaneling audits due to its rapid glass-transition timeline and high shear modulus.
The adhesive line thickness must be maintained under 3 micrometers; excessive adhesive layers act as a mechanical low-pass filter, absorbing sharp transient pulses generated when the depaneling router bit first contacts the tab margin.
| Package Feature | Planar Triaxial Rosette | Stacked Triaxial Rosette |
|---|---|---|
| Footprint Area | 5.5 mm x 5.5 mm (30.25 mm²) | 2.0 mm x 2.0 mm (4.00 mm²) |
| Grid Z-Axis Offset | 0.00 mm (Single plane) | 0.35 mm to 0.75 mm (Layered) |
| Shear Lag Susceptibility | Minimal | Moderate to High |
| Thermal Dissipation Rate | 45 mW/cm² | 18 mW/cm² |
| Target Application | High-accuracy audit, flat surfaces | Tight component clearance, dense BGAs |
Board flexing damages solder joints. Routing generates harsh vibration. Shear lag attenuates transient signals.
Positioning rosettes closer than 1.5 millimeters to delicate ball grid array (BGA) corner pads or multilayer ceramic capacitors (MLCCs) exposes the audit to severe spatial strain gradients. If the gauge grid center sits too far from the high-stress boundary, the recorded peak strains underreport the actual stress experienced at the solder-to-pad interface.
Improper cleaning or uneven adhesive clamping causes localized micro-debonding beneath one of the three sensing grids during high-vibration routing cuts. The compromised grid suffers baseline drift and false apparent strain spikes, leading directly to the false acceptance of a depaneling process that is actively fracturing internal traces on adjacent surface-mount components.

Filtering
Analog signal conditioning converts the fractional resistance shifts of the triaxial rosette into low-noise voltage signals suitable for high-speed analog-to-digital conversion. Standard metallic foil strain gauges present an unamplified output on the order of 1 to 2 millivolts per volt of excitation at 1,000 microstrain. Bridge excitation sources supply a regulated 2.5-volt or 5.0-volt direct-current potential across the Wheatstone bridge networks.
Ratiometric excitation topology ensures that any microvolt-level drift in the excitation power rail cancels out proportionally inside the differential measurement stage.
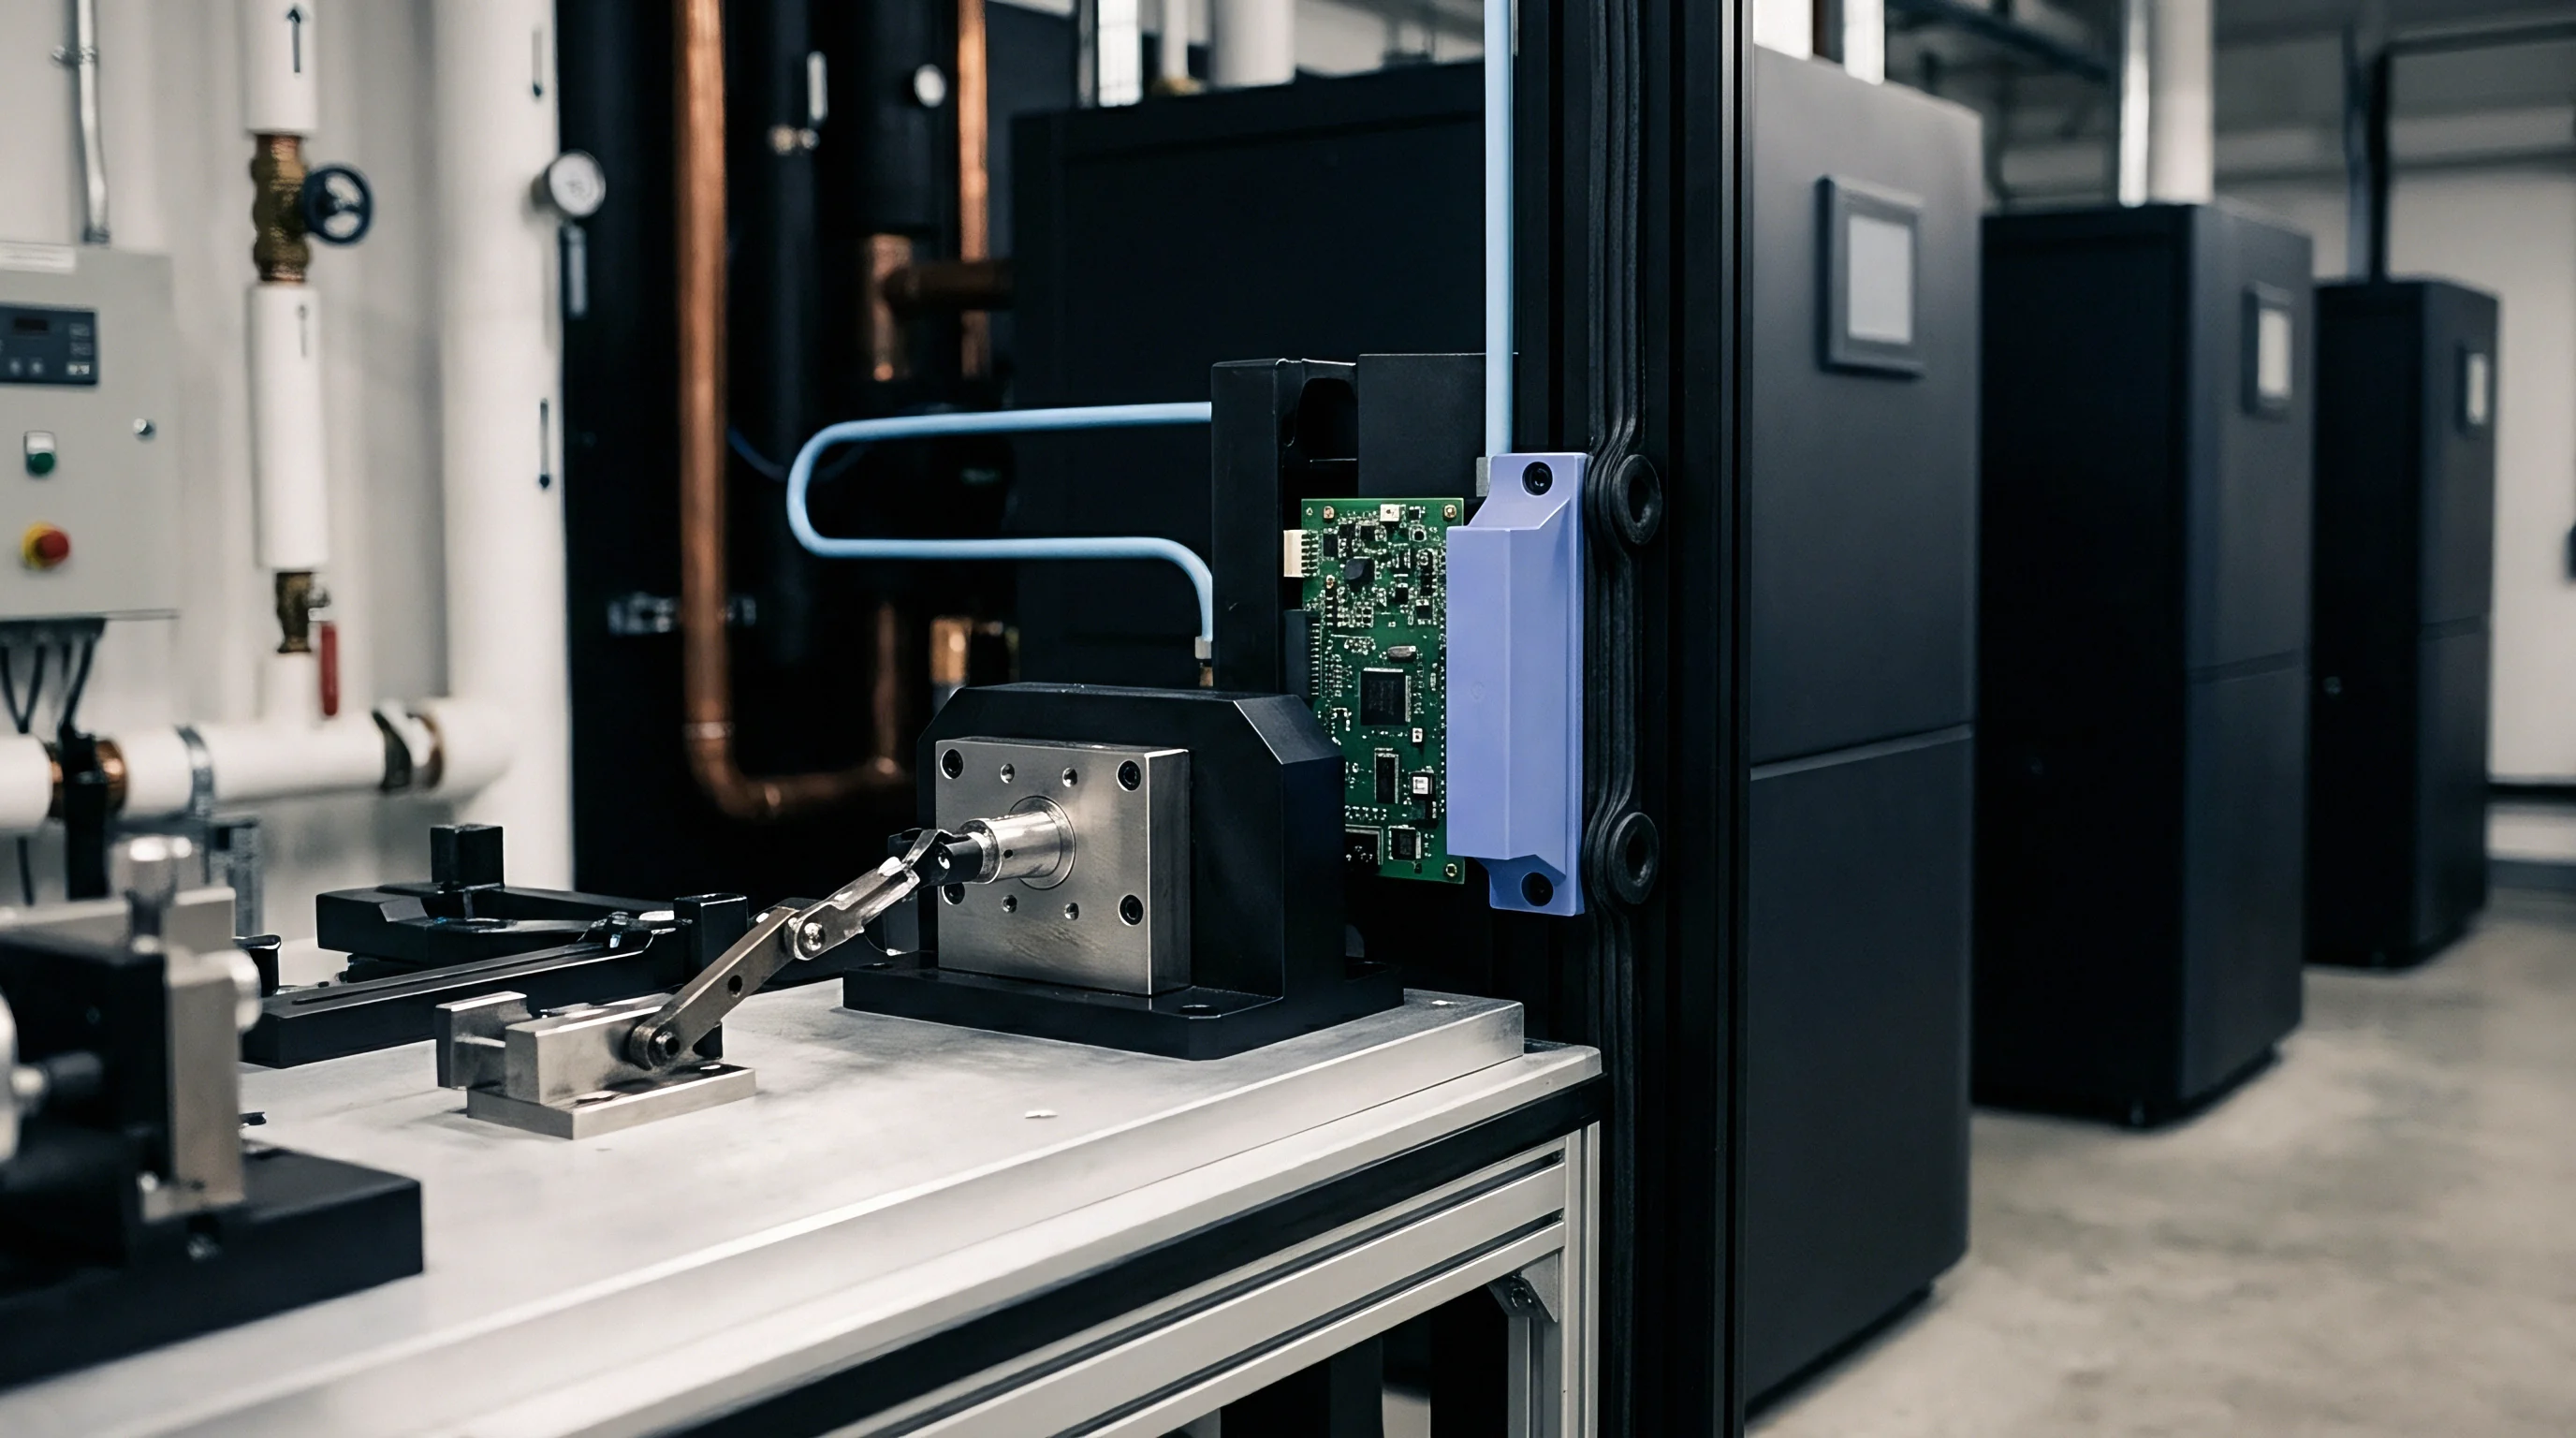
Amplification requires precision instrumentation amplifiers exhibiting a common-mode rejection ratio (CMRR) greater than 110 decibels at factory line frequencies. Depaneling spindle motors, vacuum dust collectors, and pneumatic clamps generate high ambient electromagnetic noise. Amplifiers must maintain gain stability within 0.05 percent across a operational temperature window of 15 to 45 degrees Celsius.
Settling times for gain stages set at 100 to 500 gain multipliers must remain below 5 microseconds to preserve peak transient profiles during board breaking.
Sequence for Analog Front End Noise Calibration
- Connect the triaxial rosette leads to the high-impedance terminal block using shielded twisted-pair cabling to minimize loop inductance.
- Apply 2.500-volt excitation power and allow the bridge network to reach thermal equilibrium over a 120-second stabilization period.
- Perform an initial automatic balance adjustment to null residual offset voltages caused by lead wire resistance and installation prestrain.
- Inject a known 1,000-microstrain shunt calibration resistor across the active arm to establish the voltage-to-strain scale factor.
- Verify common-mode noise suppression by running the depaneling spindle motor at full speed while the board sits passively clamped in the fixture.
Anti-aliasing hardware filters protect the digitized signal from mechanical spectral folding. Routing bits with three flutes spinning at 60,000 revolutions per minute create structural tooth-pass excitation frequencies exactly at 3.0 kilohertz, accompanied by high-order harmonics stretching past 20 kilohertz. The analog front end incorporates a 4th-order low-pass active Butterworth filter with a -3 decibel corner frequency fixed at 10 kilohertz.
This filter topology maintains a flat passband amplitude response while providing a 24 decibel per octave roll-off, attenuating high-frequency mechanical vibration before it aliases into the lower frequency domain where structural board deflection resides.
IPC-9704 mandates anti-aliasing low-pass filter cutoff frequencies configured to preserve peak strain transients without introduced phase distortion.
Filter selection dictates system response speed. High-order linear-phase Bessel filters reduce signal overshoot, though they trade away sharp frequency roll-off characteristics. RC passive input filters must utilize low-temperature-coefficient C0G/NP0 ceramic capacitors to prevent thermal drift from distorting the attenuation slope during continuous audit runs.
Sensor manufacturers routinely attribute unexplained signal spikes to ambient factory electrical noise rather than admitting that an under-damped amplifier stage ringing under high-frequency excitation caused the artifact.
Sampling
Digitizing triaxial strain transients during depaneling demands simultaneous sampling across all three analog channels. Multiplexed analog-to-digital converters (ADCs), which scan channels sequentially via a single converter, introduce microsecond time offsets between the 0-degree, 45-degree, and 90-degree rosette arms. At high depaneling strain rates exceeding 100,000 microstrain per second, a time lag of just 20 microseconds between channel conversions introduces up to a 15 percent error in the calculated principal strain angle and magnitude.
Simultaneous-sampling Successive Approximation Register (SAR) or Delta-Sigma ADCs solve this timing skew by capturing the voltage on all three channels within a single clock cycle window. Resolution must reach at least 16 bits, yielding a dynamic range capable of resolving 0.5 microstrain per least significant bit over a total operating range of ±5,000 microstrain. High-speed depaneling audits mandate a sampling rate between 10 kilohertz and 50 kilohertz per channel.
This conversion speed guarantees that a 100-microsecond mechanical strain pulse contains a minimum of 5 discrete data points for accurate peak waveform reconstruction.
| Bus Interface | Maximum Data Rate | Channel Capacity (at 50 kHz, 16-Bit) | Cable Length Limit | Deterministic Latency |
|---|---|---|---|---|
| SPI (4-Wire) | 25.0 Mbps | 12 Channels (4 Triaxial Rosettes) | 0.3 meters (On-board) | Microsecond deterministic |
| I2C (Fast Mode) | 1.0 Mbps | 1 Channel (Partial Rosette) | 0.5 meters (On-board) | Non-deterministic bus contention |
| USB 2.0 (High Speed) | 480.0 Mbps | 64 Channels | 3.0 meters (External Pod) | 1.0 millisecond packet jitter |
| Ethernet (100Base-TX) | 100.0 Mbps | 32 Channels | 100.0 meters (Distributed) | Sub-millisecond with IEEE 1588 |
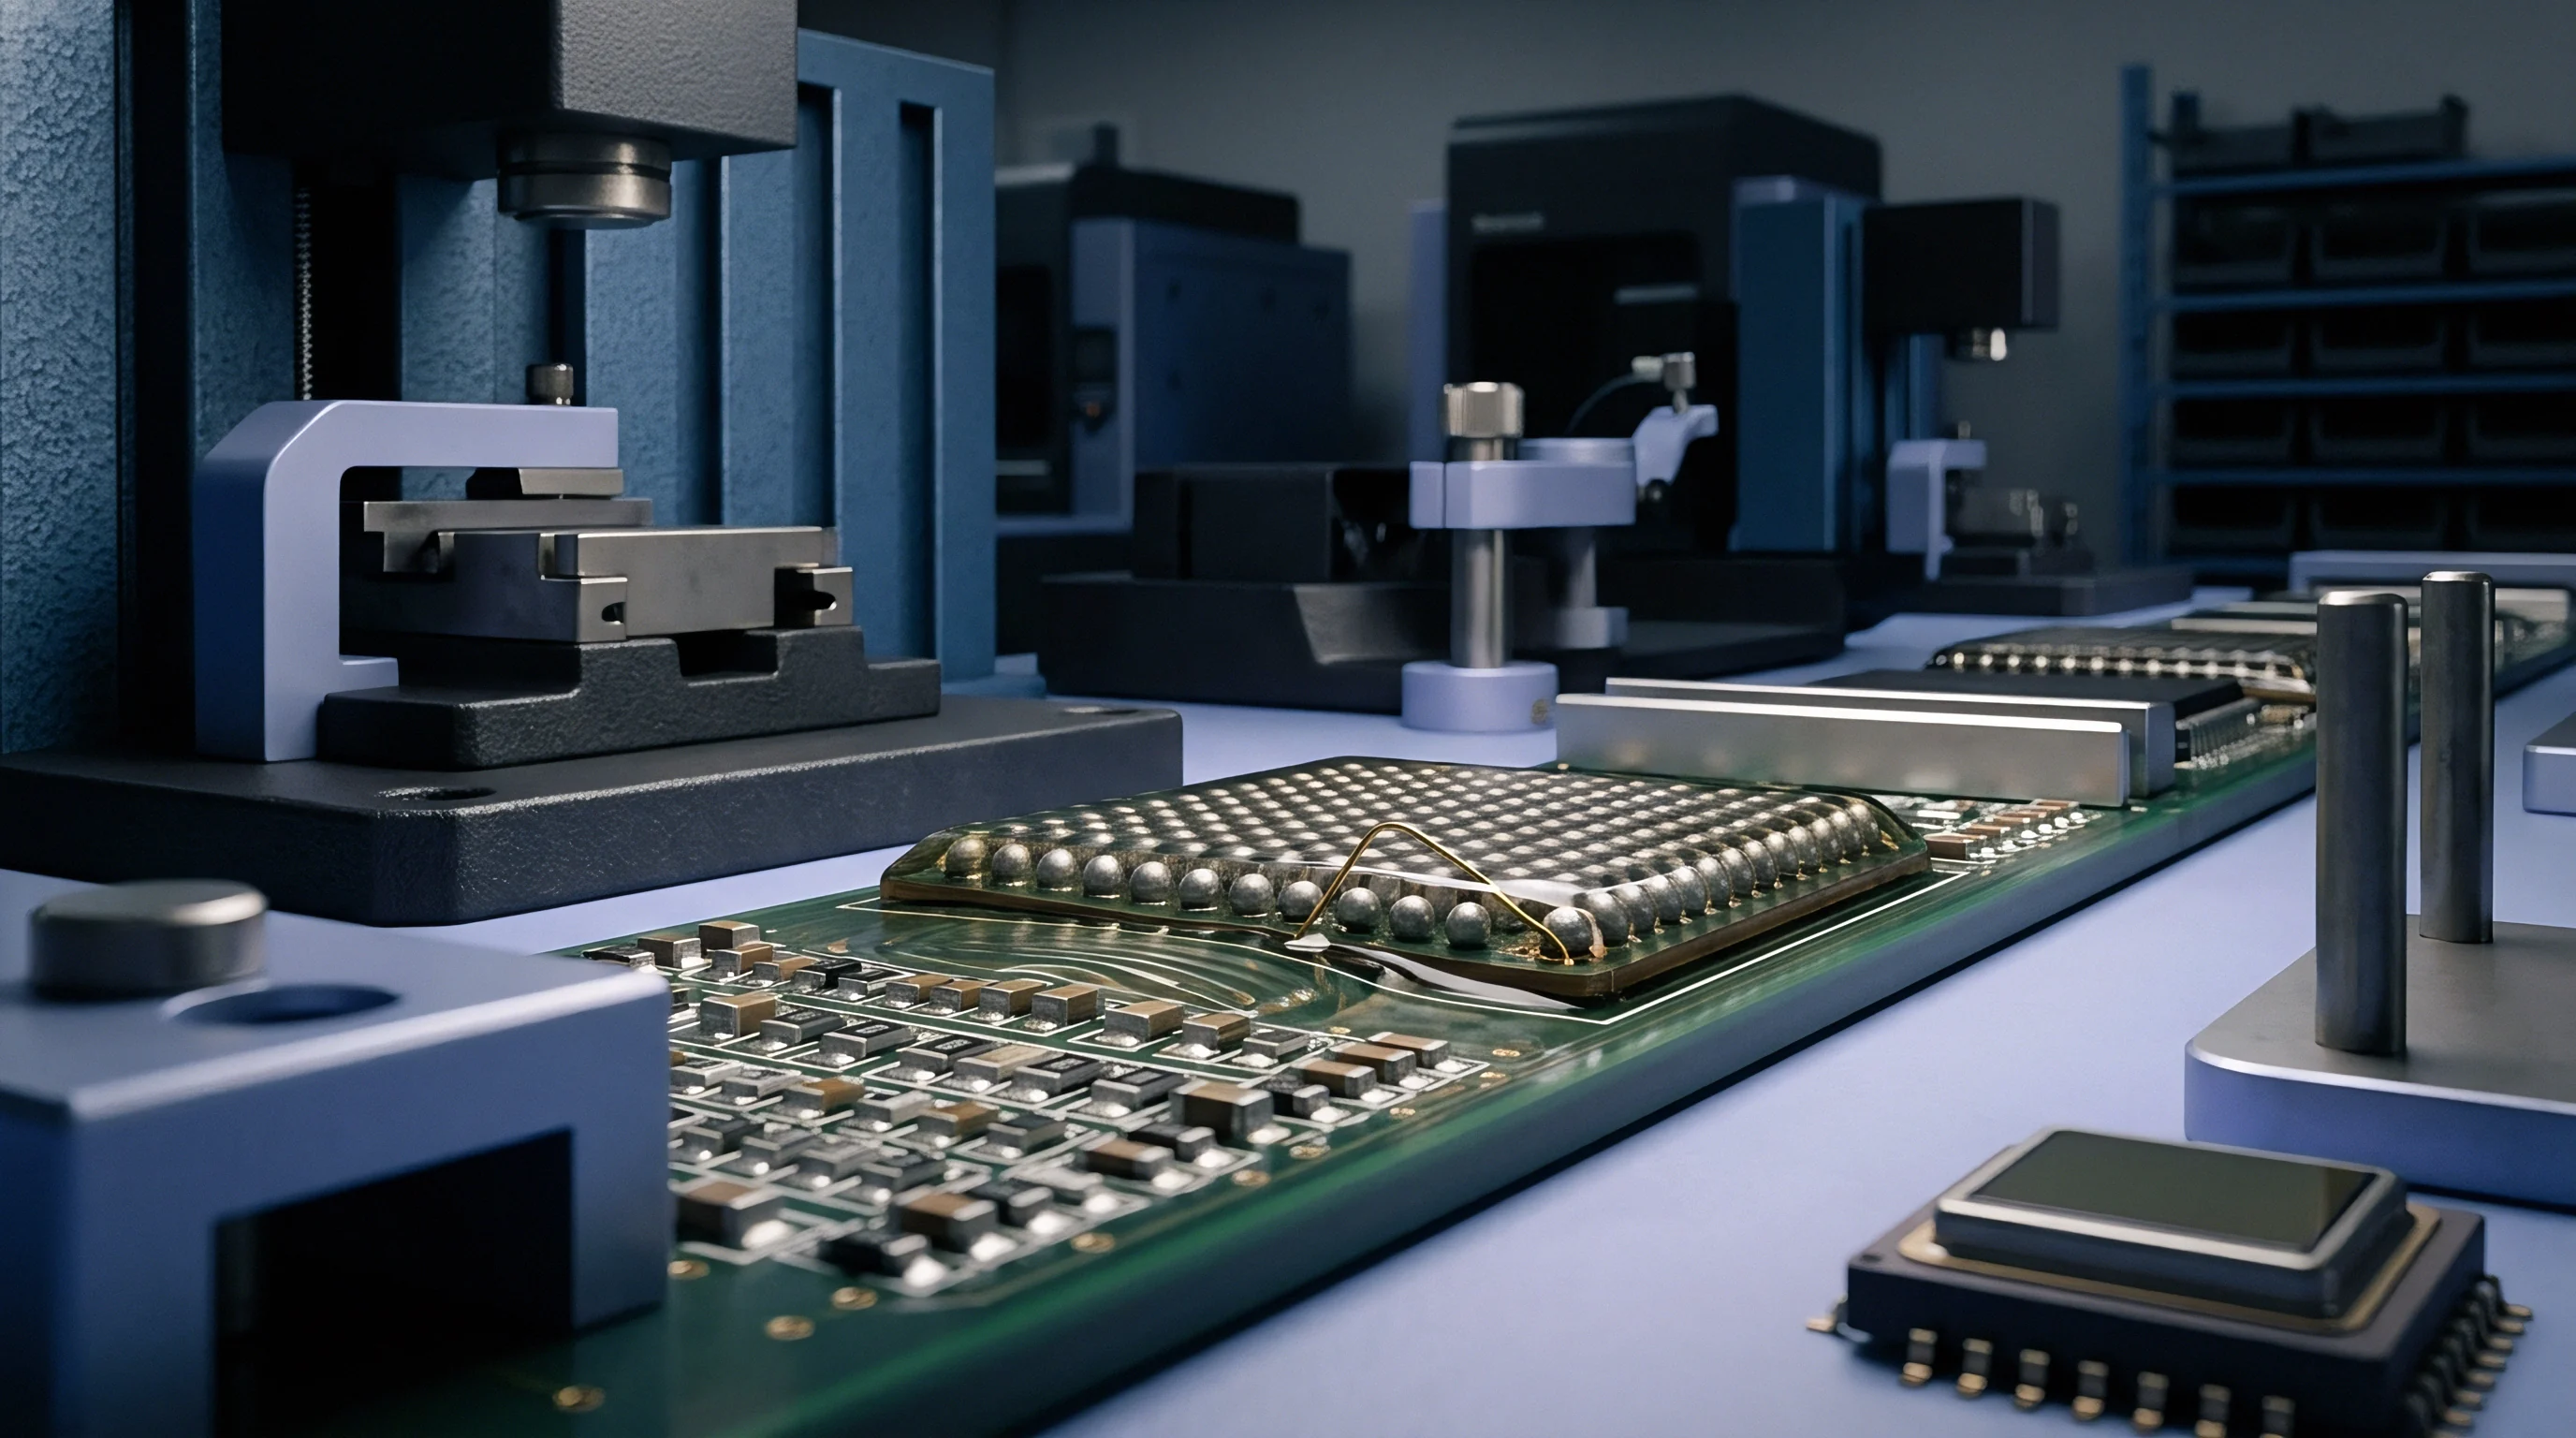
Data transmission from the digitizer module to the host collector relies on SPI or differential bus hardware. On-board embedded acquisition units utilize SPI running at clock frequencies up to 25 megahertz. High clock speeds require low bus capacitance; trace lengths exceeding 15 centimeters cause signal degradation and bit corruption unless driven by active bus buffer ICs.
External acquisition pods convert analog signals directly at the fixture and transmit formatted packet streams via USB 2.0 or Ethernet utilizing hardware-based IEEE 1588 Precision Time Protocol synchronization.
How Does Clock Jitter Distort Transient Peaks?
Clock jitter on the ADC conversion trigger pin shifts the exact moment of voltage capture away from the uniform time base. In high-speed strain acquisition, aperture jitter exceeding 50 nanoseconds causes uncertainty in signal amplitude during steep strain ramps. When the strain rate dvarε/dt rises sharply during a violent V-score break, timing jitter translates directly into amplitude voltage errors, flattening the recorded transient peak or producing artificial high-frequency noise spikes that compromise data integrity.
- Aperture Jitter Target limits phase uncertainty below 100 picoseconds to guarantee peak amplitude precision on sharp router impact waves.
- SPI Bus Capacitance must be held below 15 picofarads per line using active buffering to prevent clock edge rounding at 20 megahertz.
- Local FIFO Buffering prevents host operating system latency from dropping transient strain packets during high-speed burst logging.
- Differential Signaling converts single-ended SPI to LVDS lines when routing acquisition buses across long fixture cables.
Whether embedded high-speed streaming architectures can completely eliminate buffer overflow conditions during multi-station continuous depaneling audits remains an open question in system integration design.
Vector
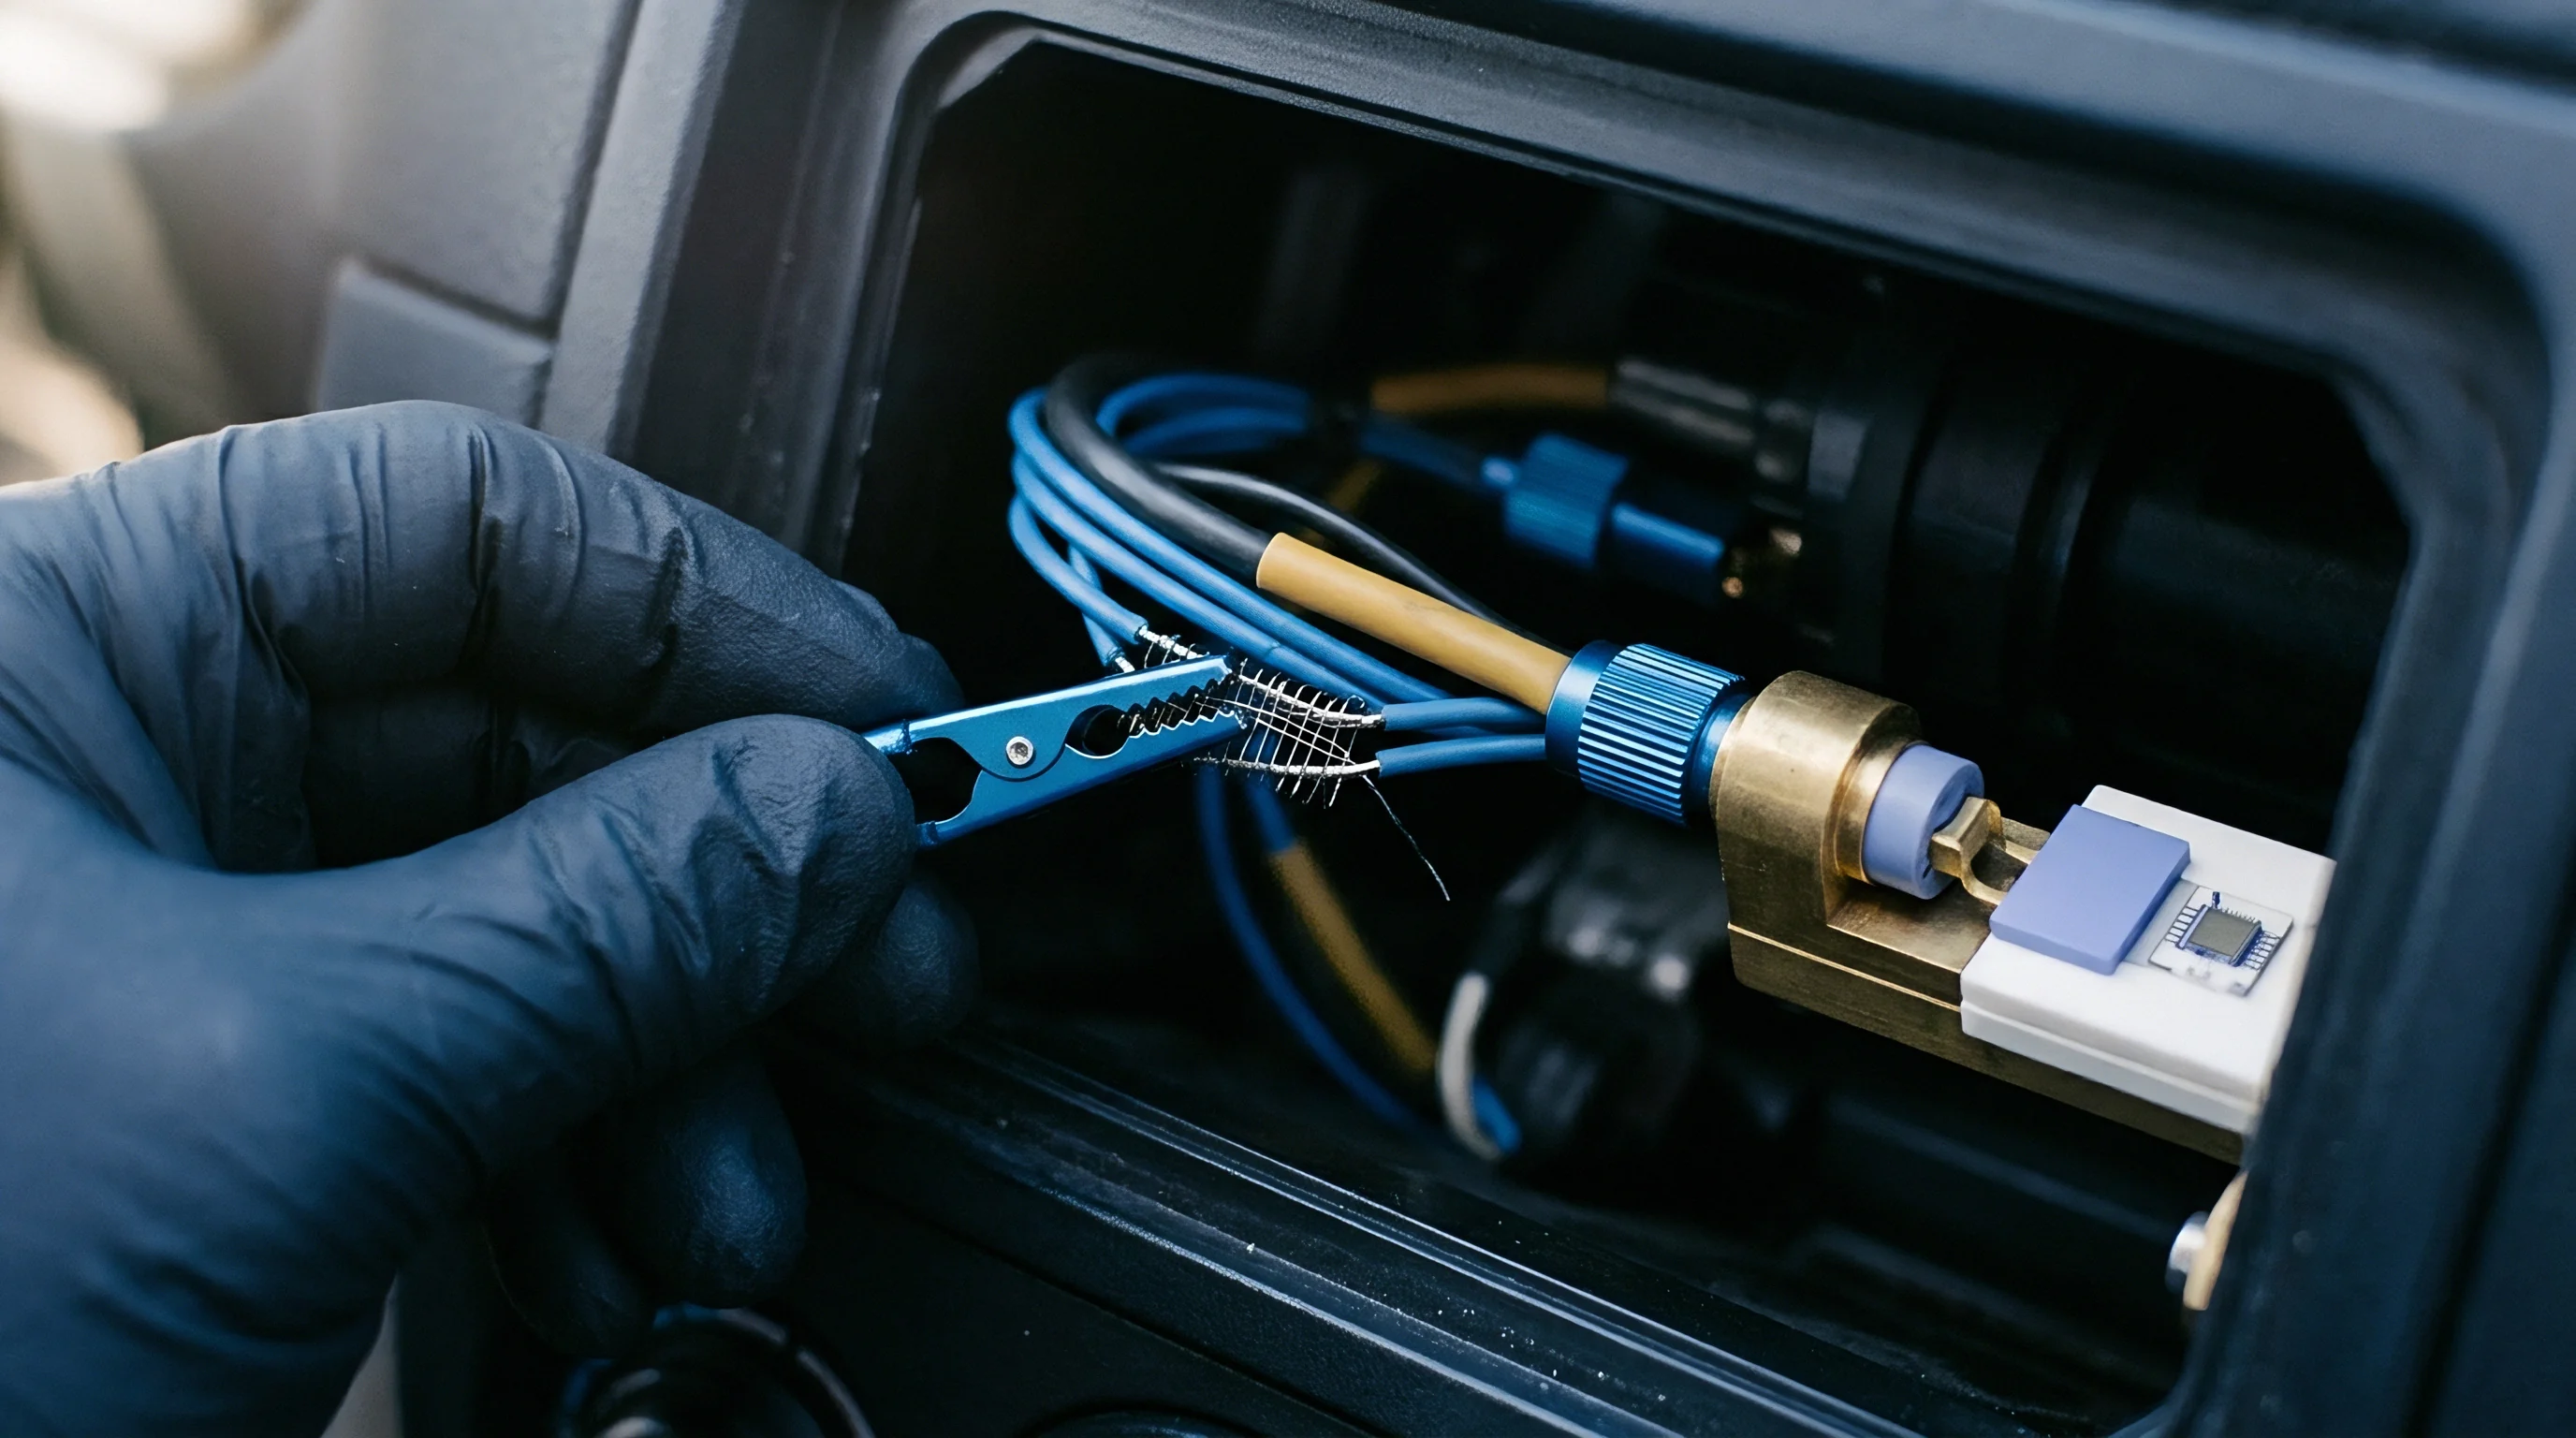
Mathematical transformation converts raw microstrain values from the three rosette channels into principal strain vectors, maximum shear strains, and strain rates. Given raw strain readings varεa (0 degrees), varεb (45 degrees), and varεc (90 degrees), the equations for principal strains varε1 (maximum principal strain) and varε2 (minimum principal strain) derive directly from Mohr’s Circle transformation for plane strain.
varε1, varε2 = fracvarεa + varεc2 ± frac1sqrt2 sqrt(varεa – varεb)2 + (varεb – varεc)2
The orientation angle thη of the maximum principal strain relative to the 0-degree grid axis is calculated using the two-argument arctangent function to preserve quadrant orientation:
thη = frac12 operatornameatan2left(2varεb – varεa – varεc, varεa – varεcright)
Maximum shear strain γmax represents the ultimate angular distortion experienced by the dielectric matrix and solder joints:
γmax = sqrt2 sqrt(varεa – varεb)2 + (varεb – varεc)2
Calculated strain rates exceeding 100,000 microstrain per second lower the safe allowable peak strain threshold for SAC305 solder joints by up to 40 percent.
Audit evaluation relies on IPC/JEDEC-9704 guidelines, which specify allowable microstrain limits based on PCB thickness and local strain rates. Thinner circuit boards flex more readily, but thicker boards transfer higher shear loads directly into component packages due to their elevated flexural rigidity. Calculating the strain rate requires taking the first derivative of the principal strain with respect to time (dvarε1/dt).
Fast strain rates severely reduce the brittle fracture threshold of ceramic capacitors and lead-free solder interconnects.
Consider a depaneling audit on a 1.6-millimeter-thick FR-4 assembly equipped with 0201 ceramic MLCC components adjacent to a router tab. During tab cutting, the simultaneous 50-kilohertz acquisition system records the following peak strain values on a planar 0/45/90 rosette: varεa = 450 μvarε, varεb = 120 μvarε, and varεc = -280 μvarε. Applying the principal strain equation yields:
fracvarεa + varεc2 = frac450 + (-280)2 = 85 μvarε
sqrt(varεa – varεb)2 + (varεb – varεc)2 = sqrt(450 – 120)2 + (120 – (-280))2 = sqrt3302 + 4002 = 518.56 μvarε
varε1 = 85 + frac518.561.4142 = 85 + 366.68 = 451.68 μvarε
varε2 = 85 – 366.68 = -281.68 μvarε
The maximum principal strain varε1 reaches 451.68 microstrain. If the transient rise time from baseline to peak occurs within 2.5 milliseconds, the calculated strain rate reaches approximately 180,670 microstrain per second. Under IPC/JEDEC-9704 limits for a 1.6-millimeter board at this strain rate, the maximum allowable strain threshold drops to 500 microstrain.
The observed value of 451.68 microstrain falls inside the acceptable envelope, passing the audit, though the margin of safety remains under 10 percent.
- Verify IPC/JEDEC-9704 Limit Compliance against the specific board thickness curve before issuing pass or fail audit certificates.
- Calculate Strain Rate Continuously using a sliding-window numerical derivative algorithm across all acquired time-series data.
- Flag Diagonal Shear Components when maximum shear strain values exceed 1.5 times the single-axis principal strain limit.
- Correlate Spatial Rosette Coordinates directly with mechanical CAD overlay drawings to pinpoint fixture pin adjustments.
IPC/JEDEC-9704 Section 6.2 states that any recorded transient strain peak exceeding the strain-rate-adjusted limit line shall require immediate line shutdown, tool bit replacement, and 100 percent non-destructive inspection of all boards processed during the audit shift.
Procurement
Sourcing strain acquisition hardware for depaneling audits involves evaluating total cost per channel, fixture integration complexity, and calibration lifecycles. Acquisition hardware presents three distinct integration formats: standalone benchtop DAQ instruments, USB-based modular acquisition pods, and custom embedded audit boards built directly into test fixtures. Pricing scales non-linearly based on simultaneous sampling speeds, analog bandwidth, and onboard signal conditioning capabilities.
Standalone benchtop systems deliver high precision and built-in display interfaces, but carry a substantial unit cost ranging from 800 to 1,500 dollars per channel. USB modular acquisition pods reduce hardware expense to 300 to 600 dollars per channel by delegating data processing, display, and storage duties to an external host laptop. Custom embedded audit PCBs integrate multi-channel instrumentation amplifiers and high-speed ADCs directly onto a fixture overlay card, dropping the landed BOM hardware cost down to 80 to 150 dollars per channel for high-volume manufacturing environments operating multiple depaneling lines.
| Hardware Form Factor | Landed Cost per Channel | Bring-Up Time | Recalibration Effort | Minimum Deployment Volume |
|---|---|---|---|---|
| Benchtop DAQ System | $800 – $1,500 | 1 Day | Annual lab calibration | 1 Unit (Flexible) |
| USB Modular Pod | $300 – $600 | 2 Weeks | Factory module swap | 2 to 5 Units |
| Embedded Fixture PCB | $80 – $150 | 8 Weeks | Board replacement | 10 Lines |
Hardware selection dictates firmware development efforts. Modular pods and embedded cards require custom driver integration, register map verification, and local software ring-buffer management, adding an estimated 3 to 6 engineering weeks to the initial audit deployment phase. Lead times for high-precision 24-bit simultaneous-sampling ADCs and low-drift excitation amplifiers range from stock to 16 weeks depending on silicon availability and semiconductor supply chain stability.
Selecting custom embedded cards without establishing dedicated lab calibration routines results in uncertified audit data that fails tier-one automotive and medical quality compliance checks. Sourcing off-the-shelf calibrated USB pods provides traceable verification records while keeping total capital expenditure controllable across low-to-medium audit volumes.
A sensible sourcing baseline limits hardware expenditure to modular pods until audit station counts exceed ten concurrent lines.