IPC-JEDEC-9704 Strain Gauge Qualification Guidelines for Surface Mount Line Audits
IPC-JEDEC-9704 line audits deploy triaxial strain rosettes at high-stress component corners to calculate principal strain vectors and enforce process microstrain limits.
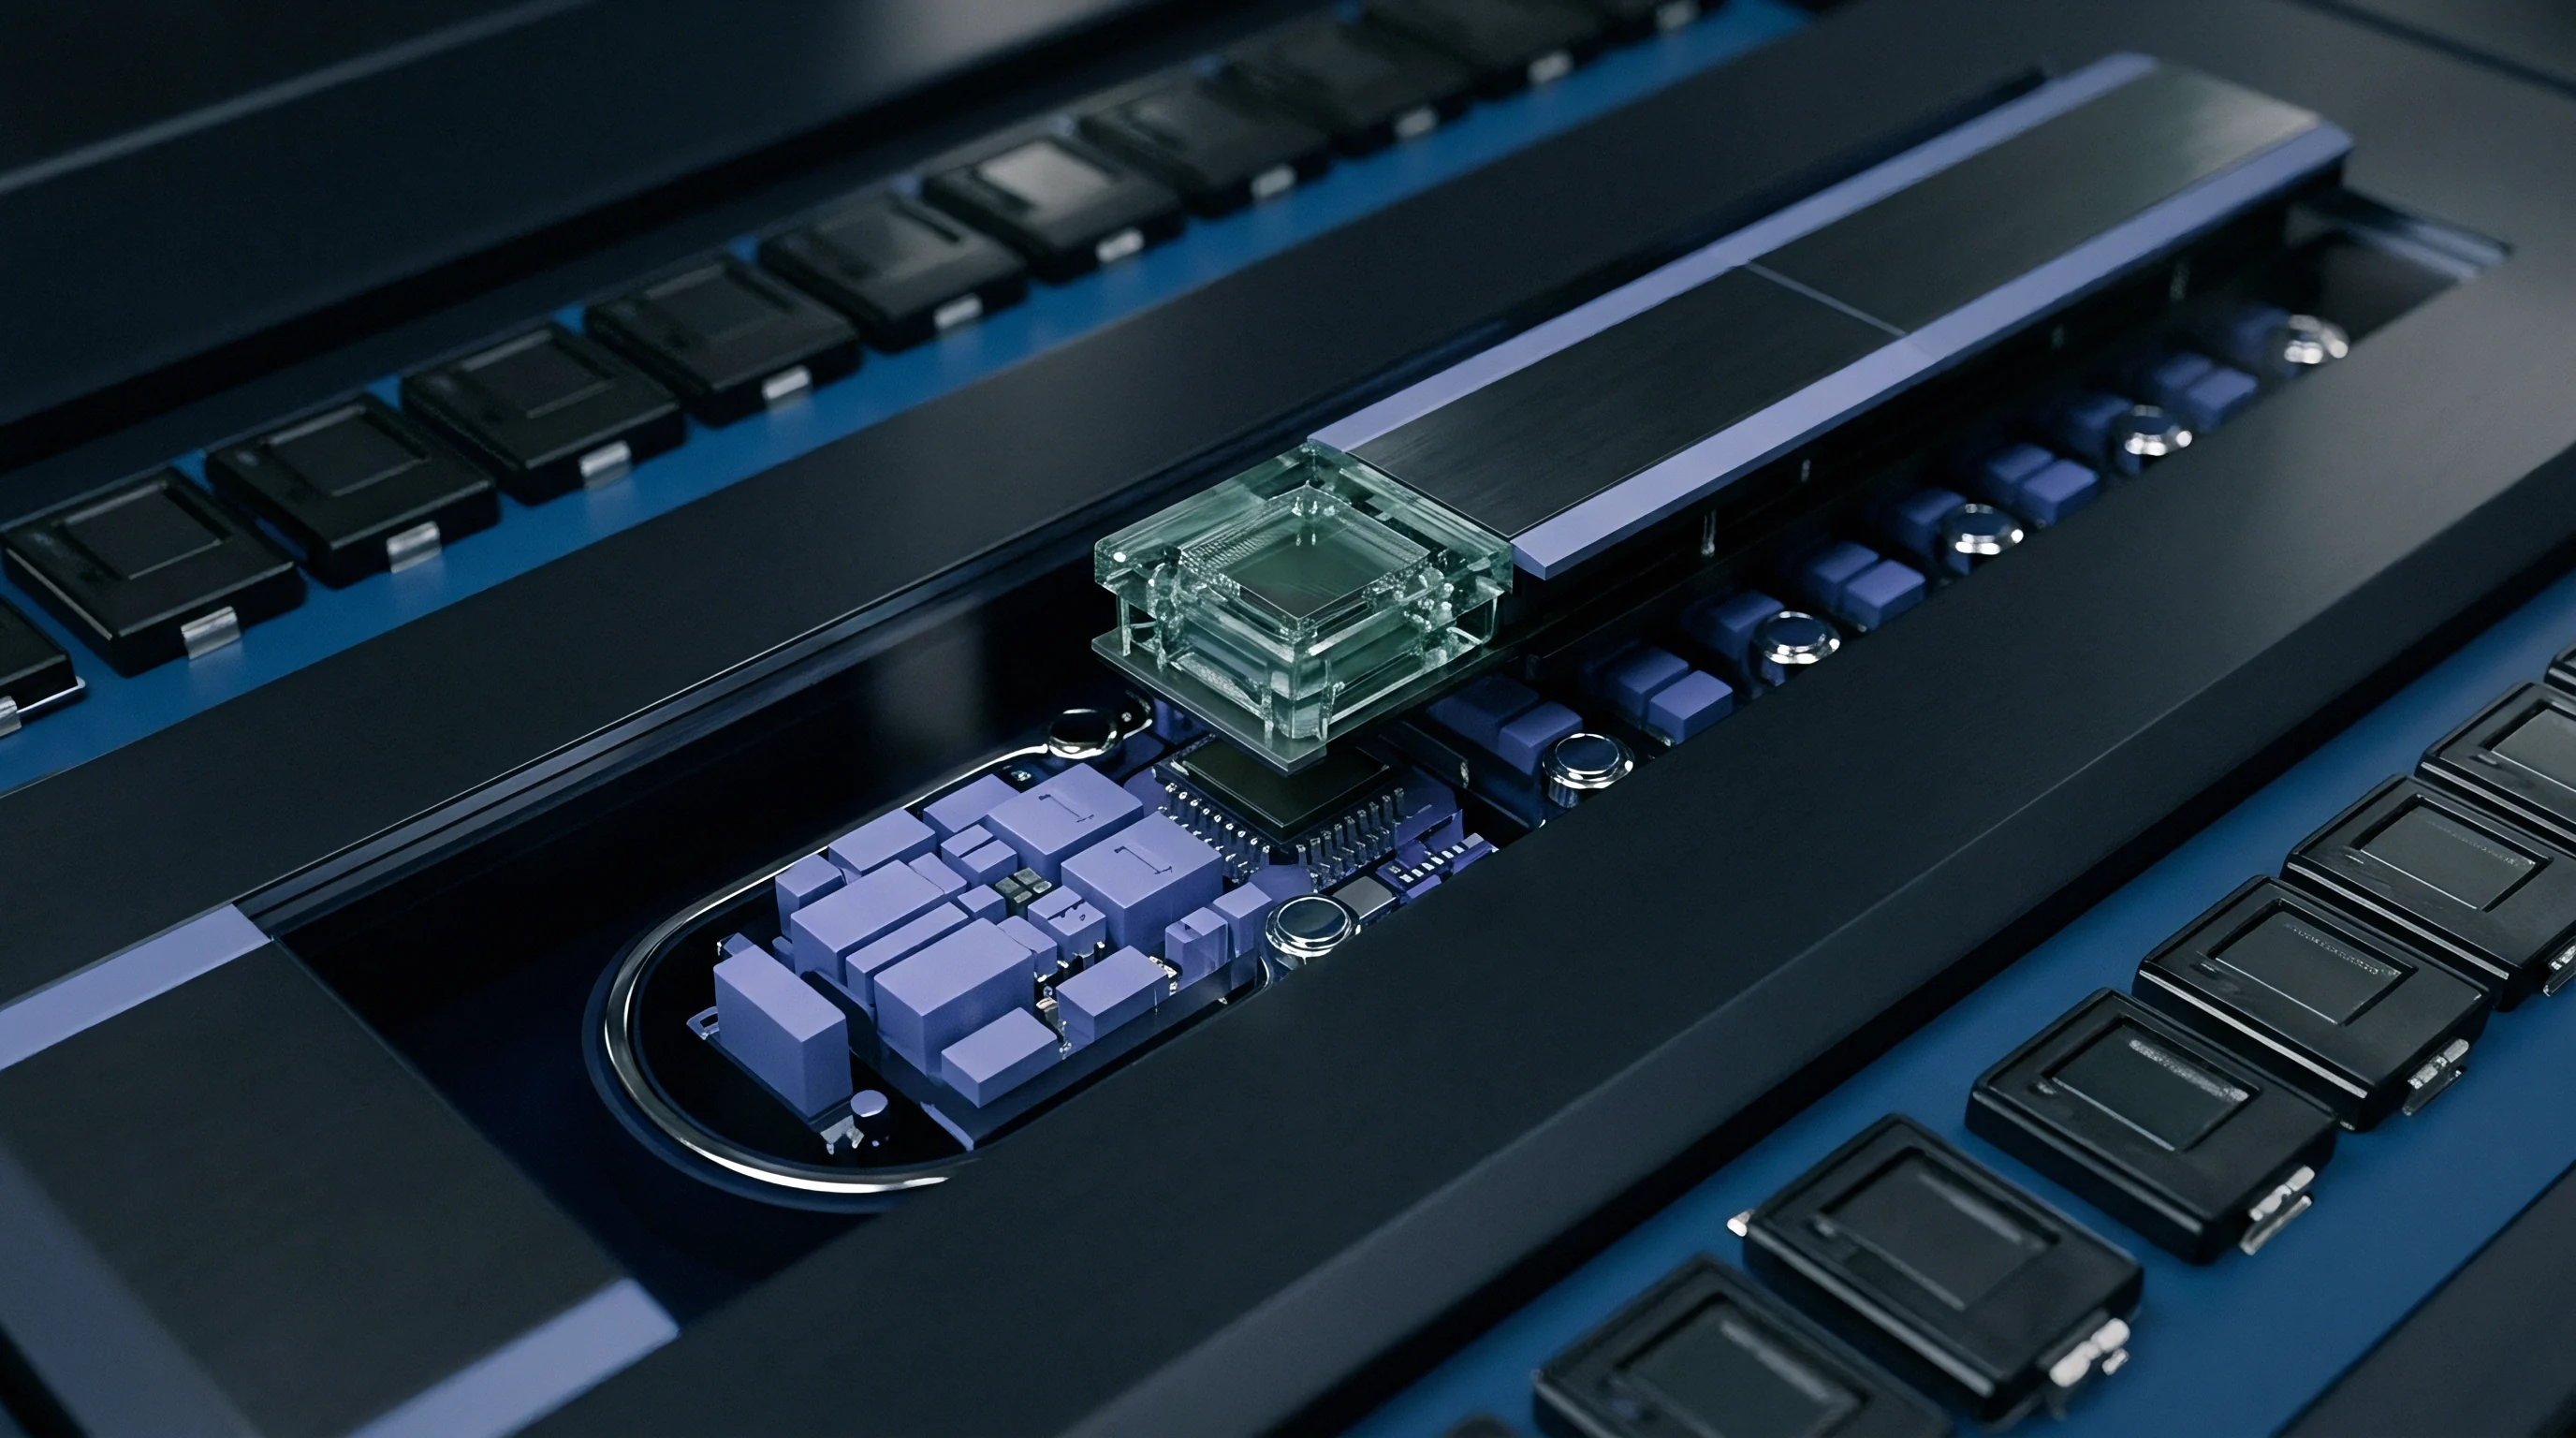

Foil
Mechanical stress measurements on printed circuit board assemblies during surface mount manufacturing depend entirely on the physical characteristics of the metallic resistance grid affixed to the substrate. Sensor selection for IPC-JEDEC-9704 line audits requires matching grid geometry to the stress gradients anticipated around component terminations. Standard stacked or planar triaxial rosette configurations, consisting of three independent resistance elements oriented at 0 degrees, 45 degrees, and 90 degrees, provide the complete two-dimensional surface strain field required to calculate principal strains and orientation angles.
Selecting a sensor grid size involves balancing spatial resolution against signal integration across localized high-stress gradients. Standard grid lengths range from 0.6 millimeters to 1.5 millimeters. A 0.6-millimeter grid element integrates strain across a localized area, making it appropriate for fine-pitch ball grid array package corners where stress gradients decay sharply within two millimeters of the pad edge.
Larger 1.5-millimeter grids average the strain over a broader region, artificially reducing peak readings near steep strain concentrators.

Rosette Architecture Selection Mechanics
Planar rosettes lay out three sensor grids across a single plane on a common polyimide backing film. This flat arrangement conducts heat directly into underlying board copper, checking thermal drift during high-excitation voltage sweeps. The trade-off is board area: a planar rosette demands at least 3.5 millimeters by 3.5 millimeters of clear space beside the target component corner.
Stacked rosettes layer the three grids directly on top of one another between thin insulating films, shrinking the required footprint to roughly 1.2 millimeters by 1.2 millimeters so the sensor fits inside dense component clusters.
That smaller footprint introduces higher thermal resistance and an off-plane Z-axis offset. Upper grids shed heat poorly through the polyimide stack, producing differential resistance shifts if excitation currents cause self-heating. Because the upper elements sit slightly further from the board’s neutral axis, they also register a small bending bias relative to the bottom grid.
On substrates thicker than 1.6 millimeters in pure bending, this layer separation creates a measurement discrepancy under 1.5 percent ~ well within standard line audit tolerances.
| Rosette Configuration | Active Grid Length (mm) | Clearance Footprint (mm) | Nominal Grid Resistance (Ω) | Maximum Shear Gradient Bias (%) |
|---|---|---|---|---|
| Planar Triaxial 0/45/90 | 0.60 ±0.05 | 3.50 x 3.50 ±0.10 | 120 ±0.5% | 1.2 |
| Planar Triaxial 0/45/90 | 1.00 ±0.05 | 5.00 x 5.00 ±0.10 | 350 ±0.5% | 4.8 |
| Stacked Triaxial 0/45/90 | 0.60 ±0.05 | 1.50 x 1.50 ±0.10 | 120 ±0.5% | 2.1 |
| Stacked Triaxial 0/45/90 | 1.00 ±0.05 | 2.20 x 2.20 ±0.10 | 350 ±0.5% | 6.5 |
Nominal grid resistances are almost always 120 ohms or 350 ohms. Higher-resistance grids draw less current and generate less internal heat, tolerating higher excitation voltages without drifting. A 350-ohm gauge powered at 2.5 volts dissipates noticeably less heat than a 120-ohm gauge at that same voltage, cutting thermal noise across extended environmental profiling runs.
Lead wires must be thin, flexible enamel-coated copper or pre-attached ribbon; heavy lead wires exert peel forces against the gauge backing during routine handling, introducing false strain offsets or lifting the foil from the solder mask.

Surface Preparation and Bonding Integrity
Securing a sensor to a board requires thorough surface preparation to ensure strain transfers cleanly through the glue line. Solder mask is slick and hydrophobic, making wet-out difficult. Lightly scuffing the target area with 400-grit silicon carbide paper clears surface contamination and builds mechanical tooth without breaking into underlying copper traces or glass bundles.
The abraded zone is then cleaned with isopropyl alcohol or methyl ethyl ketone using lint-free cotton swabs until swabs pull away clean.
Planar gauge architectures require larger installation clearances around component corners but maintain superior thermal stability compared to multi-layer stacked configurations.
Cyanoacrylate adhesives serve as the standard bonding agent for short-term line audits, curing at room temperature in two to three minutes under firm thumb pressure. The glue line needs to be uniform and thinner than 0.005 millimeters; a thick or uneven adhesive layer acts as a mechanical cushion, damping high-frequency strain transients during depaneling or snapping and leaving peak microstrain underreported. For thermal profiling through a reflow oven, ethyl-based cyanoacrylates break down above 85 degrees Celsius.
Auditing reflow transit requires heat-cured epoxies rated to survive 260 degrees Celsius without losing shear strength.
Placement accuracy around target packages dictates whether audit data is usable. IPC-JEDEC-9704 focuses measurement on the outer corners of surface-mount components, particularly fine-pitch BGAs and ceramic capacitors. Moving a sensor grid more than 1.5 millimeters away from a package corner causes recorded microstrain to drop steeply as localized bending stresses disperse through the glass-epoxy matrix.
Misaligned sensors yield deceptively low readings that allow damaging assembly operations to clear qualification.
Sensor alignment is verified under magnification before running excitation sweeps. Gauge orientation relative to the component edge must stay within plus or minus 5 degrees to avoid rotational errors during principal strain calculation. Pre-attached lead wires require anchor taping to the board substrate three to five millimeters behind the gauge termination pads, preventing handling forces from tugging directly on the foil grids during board transfers.
Reported zero-drift errors during line runs typically track back to improper gauge handling rather than thermal breakdown of the adhesive film.
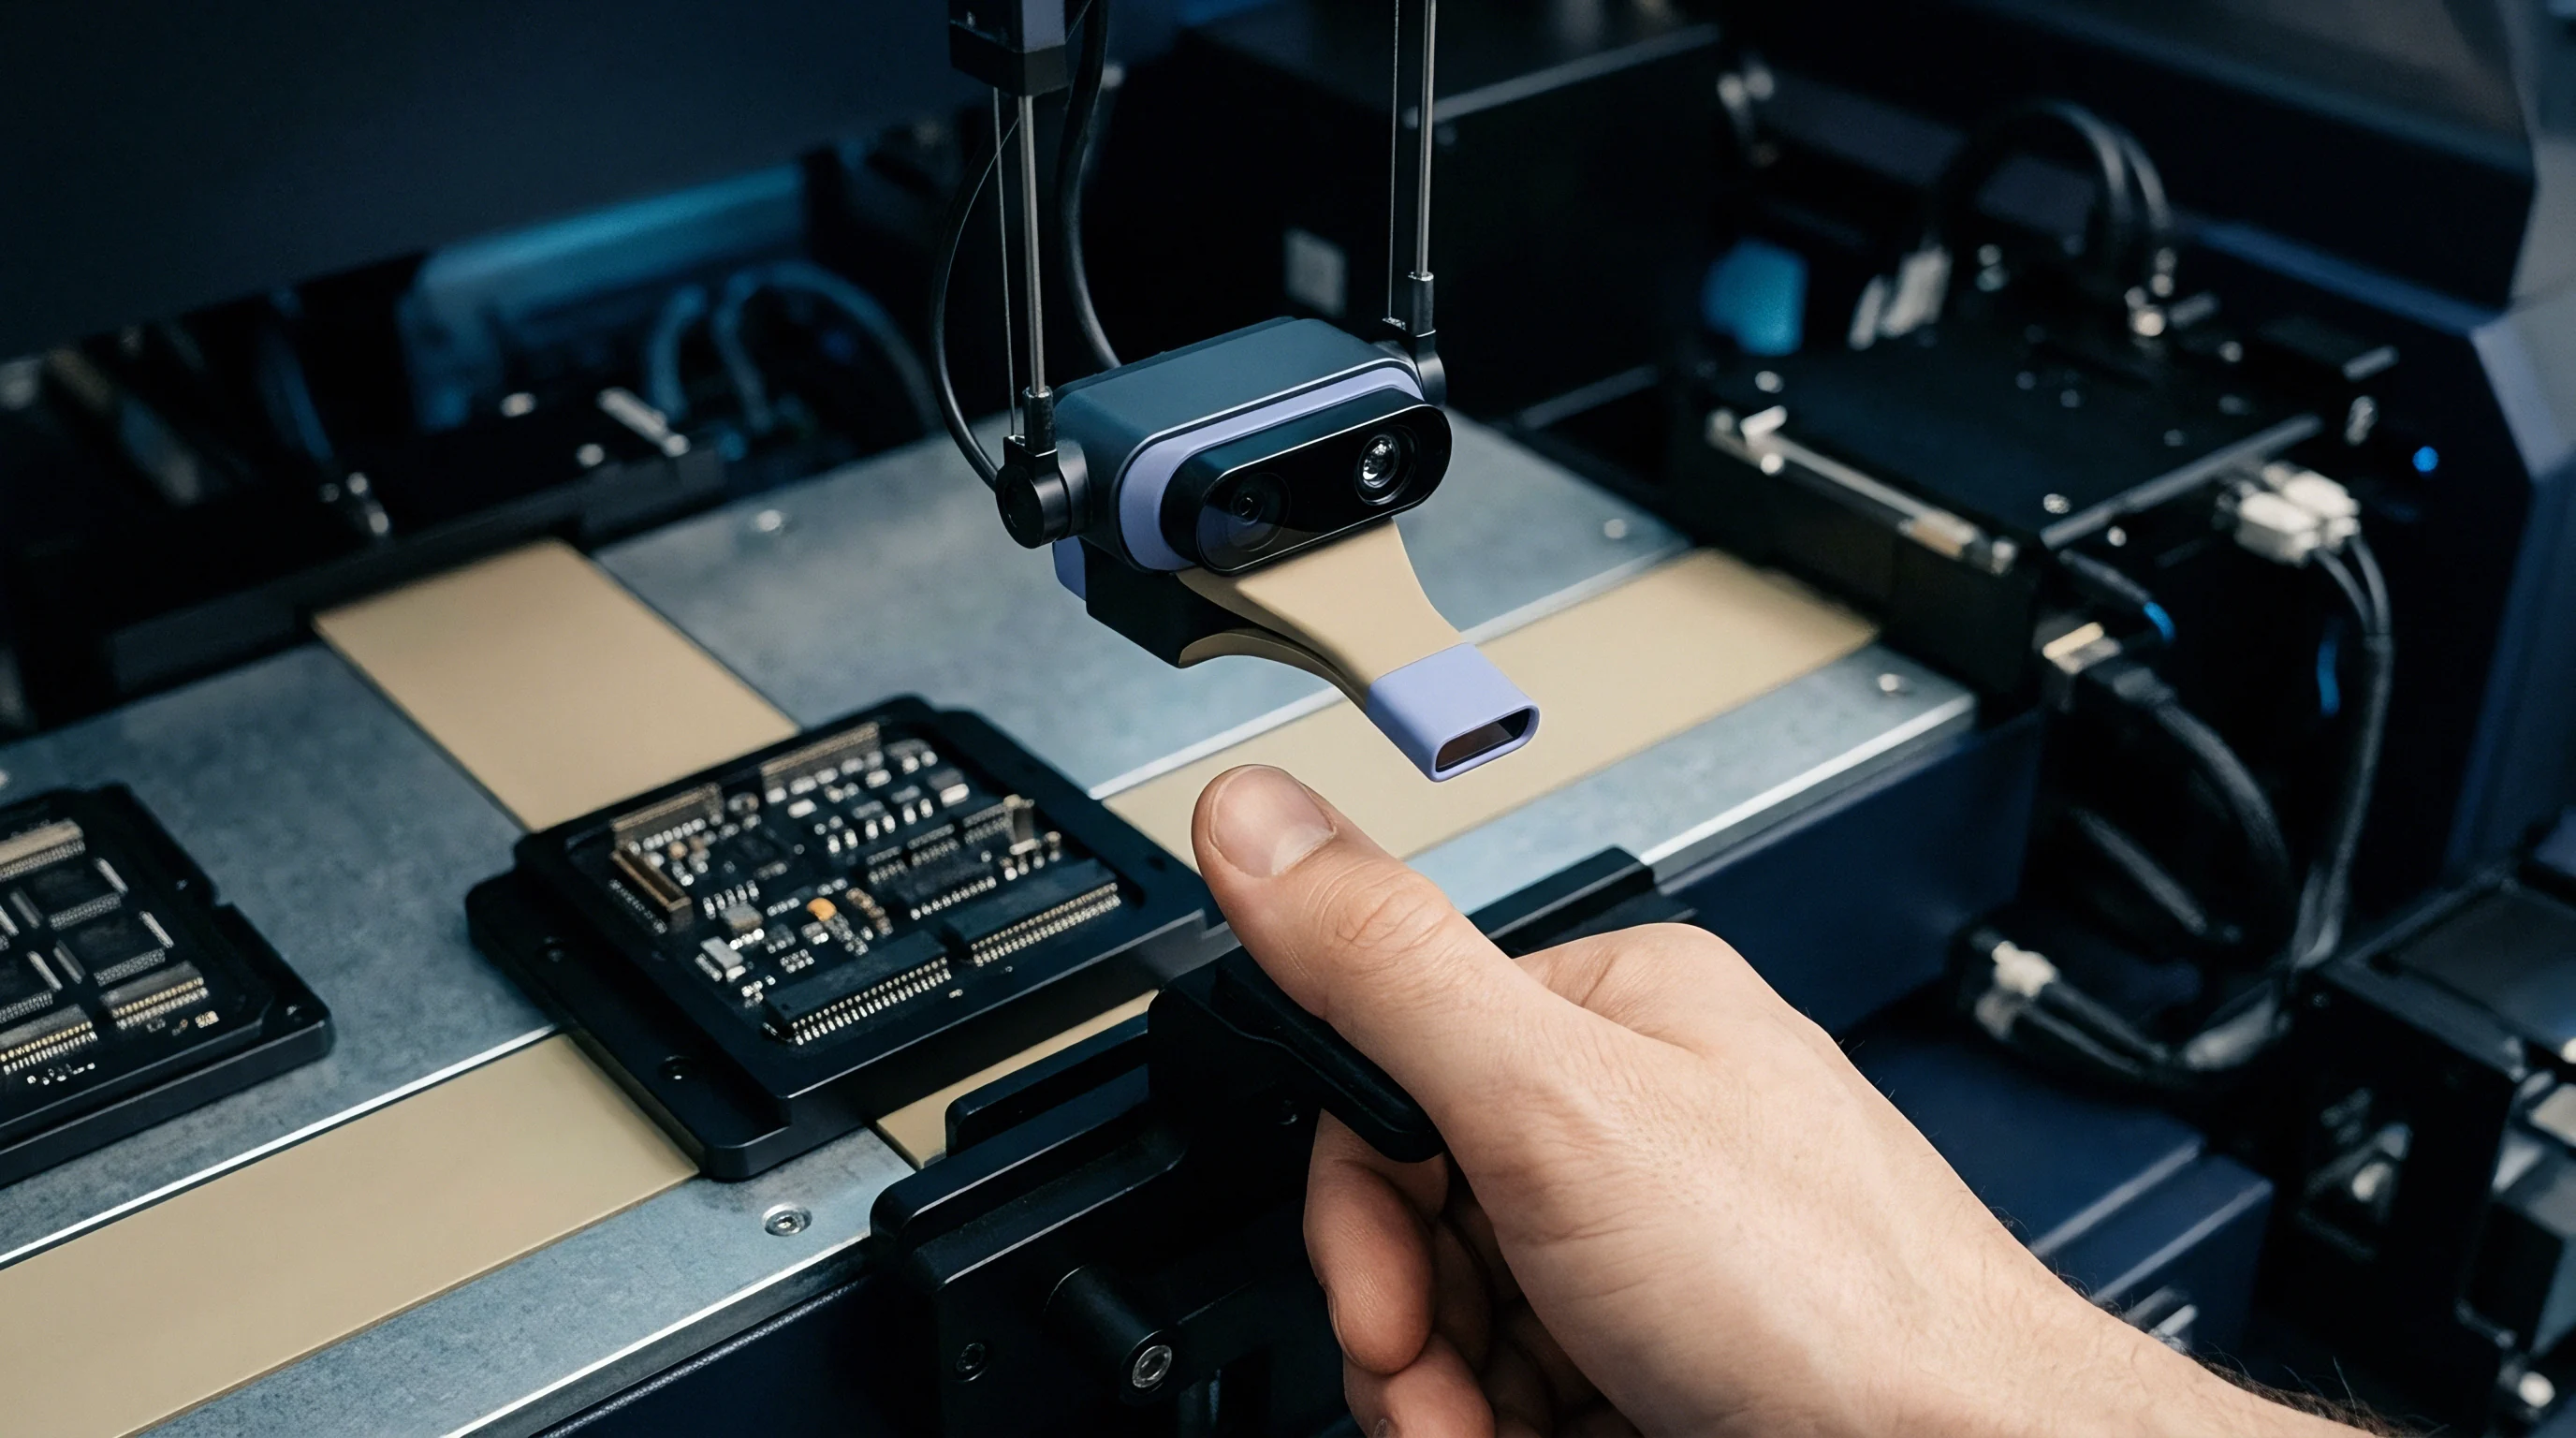
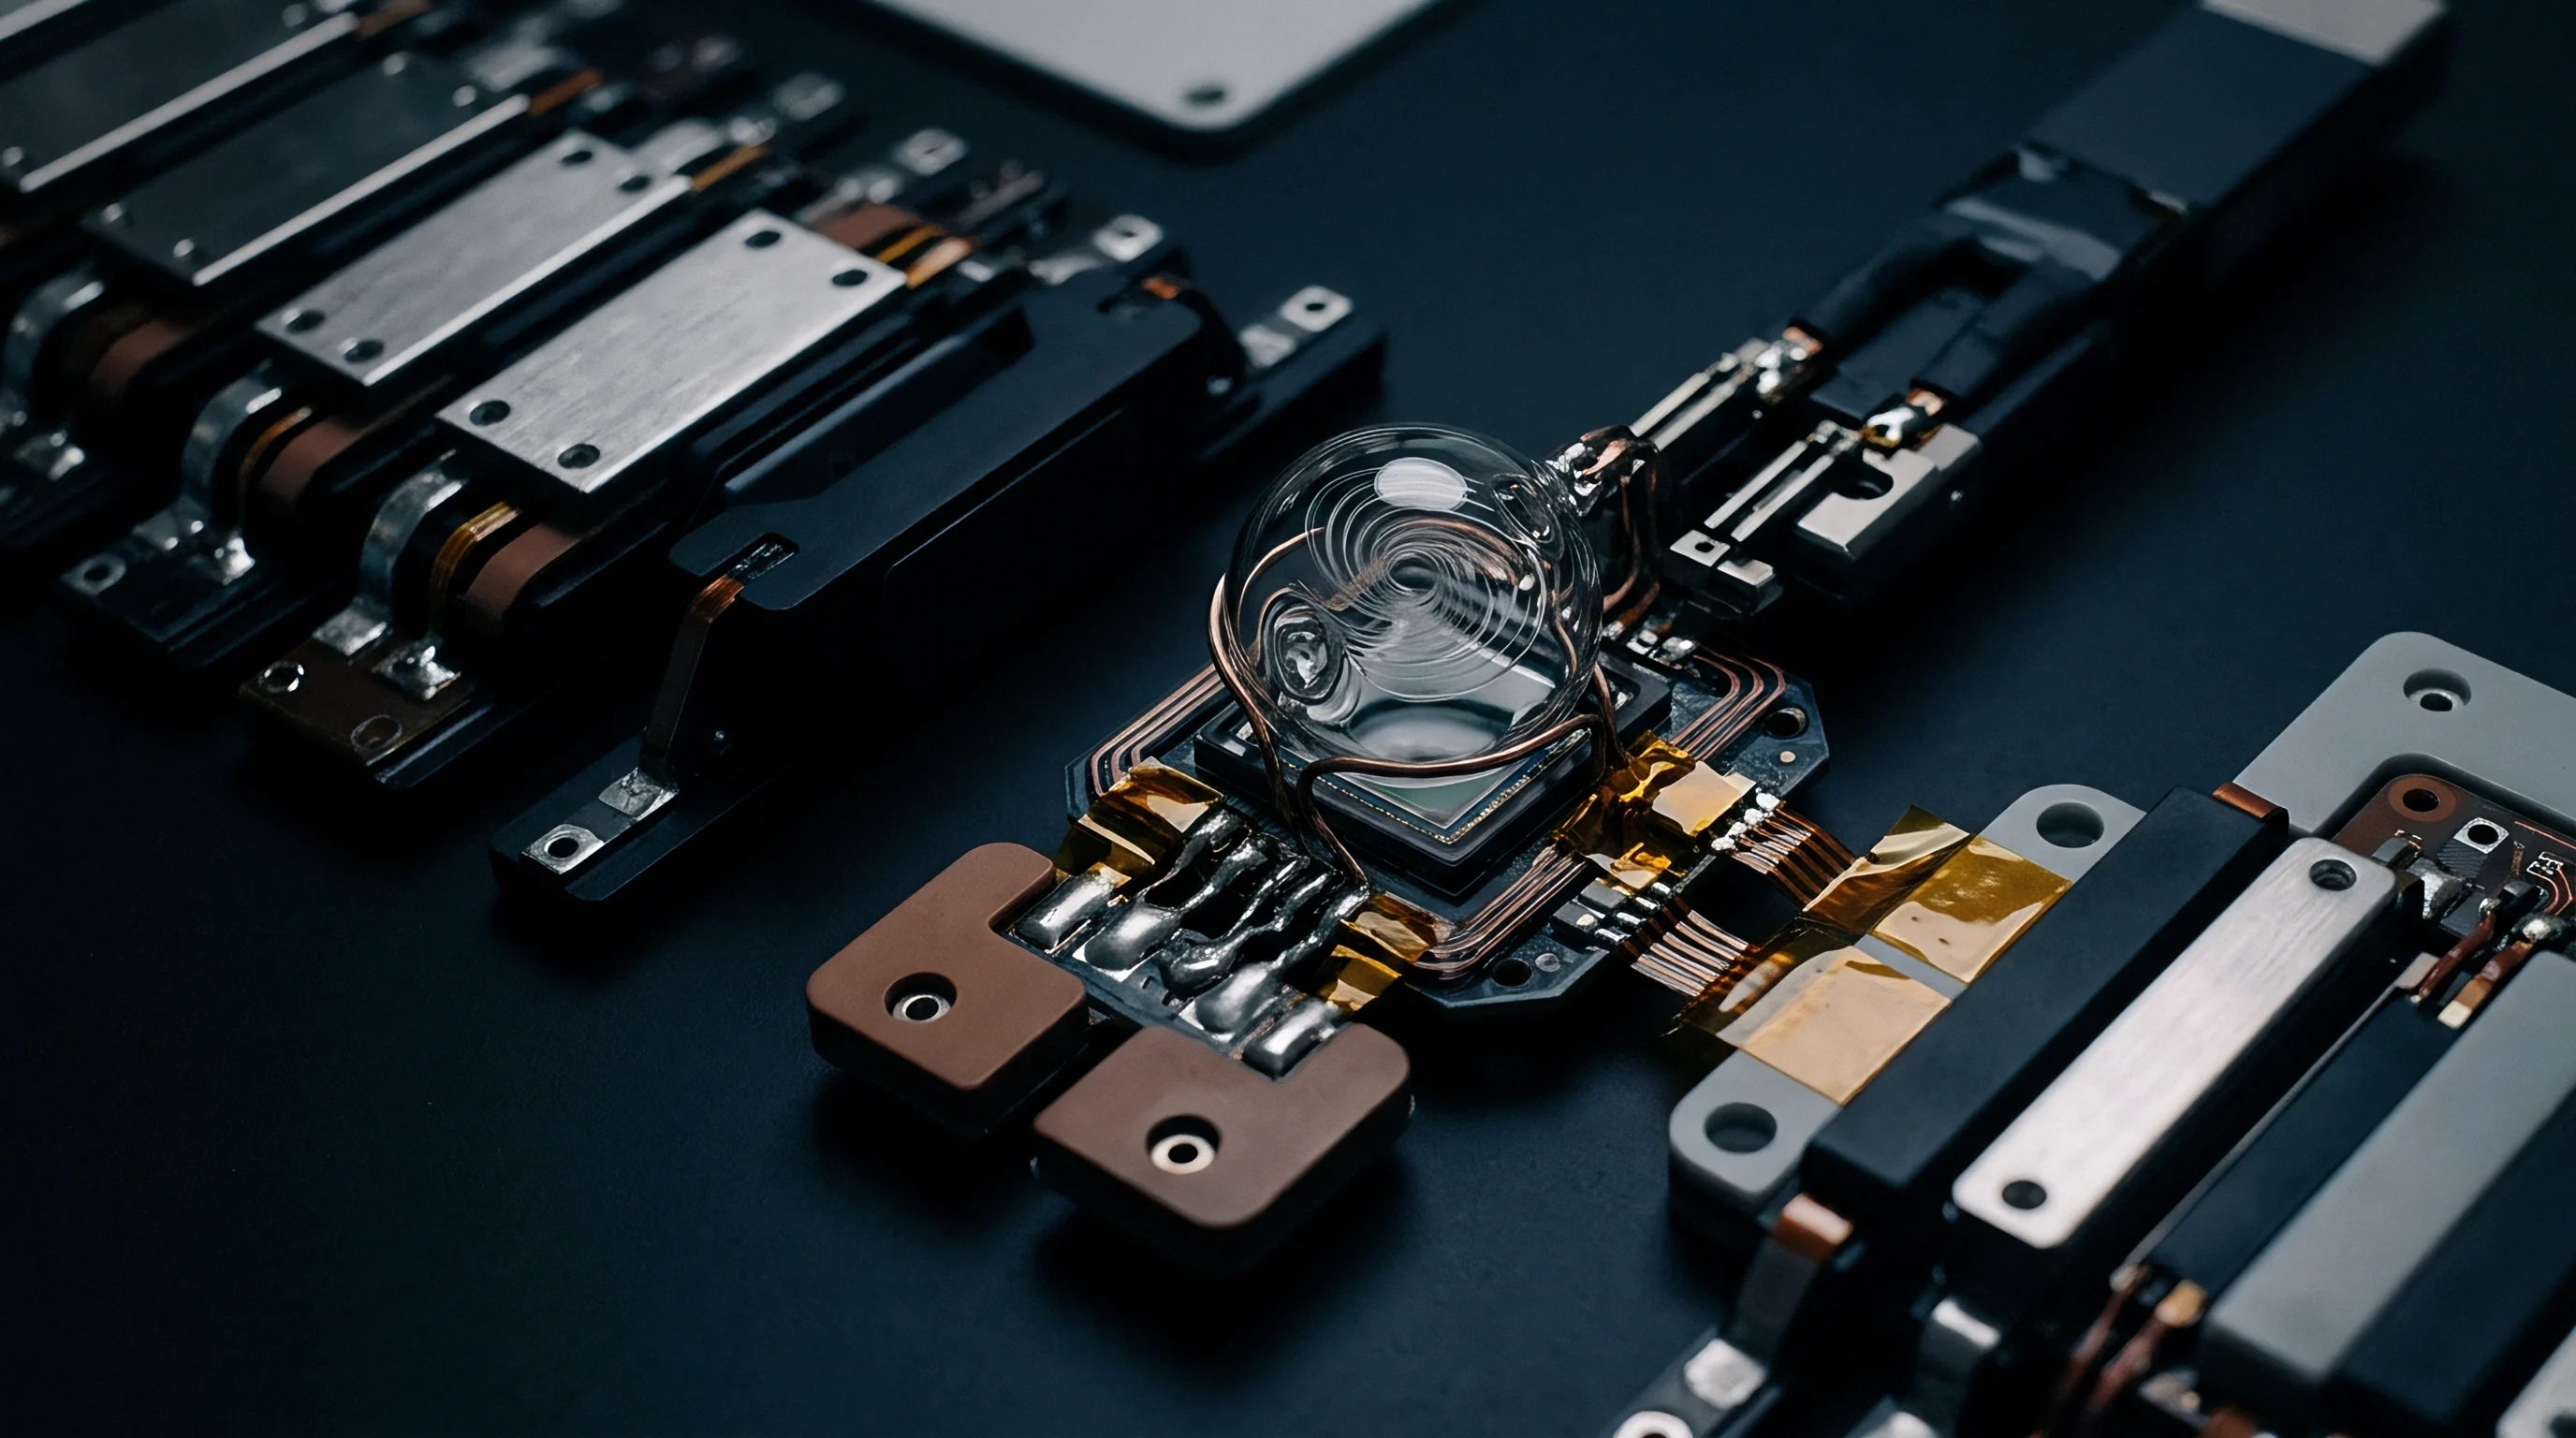
Baseline
Data acquisition hardware integration requires balancing signal-to-noise ratios, bridge excitation stability, and high-frequency analog filtering. Standard Wheatstone bridge completion circuits for line audits utilize quarter-bridge type II configurations featuring active gauge elements backed by passive precision internal resistors within the instrument chassis. Bridge completion modules incorporate lead-wire resistance compensation networks to eliminate signal degradation over extended cable lengths.
High-density line audits simultaneously monitor 16 to 64 individual strain channels distributed across a single circuit board assembly, placing rigorous performance expectations on analog-to-digital converter architecture and multiplexing rates.

Signal Conditioning and Excitation Dynamics
Selecting an excitation voltage is a compromise between raw signal amplitude and gauge self-heating. Power dissipation increases with the square of the voltage: driving a 120-ohm gauge at 5 volts dumps over 100 milliwatts per square millimeter into the grid, expanding the polyimide backing and causing steady positive zero-drift. Running excitation between 1.0 volt and 2.5 volts limits self-heating while providing a clean analog differential signal.
Bridge excitation sources must hold regulation within plus or minus 0.05 percent across ambient operating temperatures to keep power fluctuations from masquerading as strain.
Lead-wire resistance introduces signal attenuation and thermal sensitivity when long cable runs separate the audited board from the instrumentation amplifier rack. Utilizing a three-wire Quarter-Bridge connection places the third lead wire in series with the high-impedance input of the measurement amplifier. Equal resistance across the active lead wires cancels resistance changes induced by ambient temperature swings along the cable run.
Uncompensated two-wire leads introduce thermal offset drifts reaching up to 15 microstrain per degree Celsius of ambient temperature variation along the wire harness.

Data Acquisition Rate and Filter Architecture
Required sampling rates track the mechanical speed of the process under test. Quasi-static steps ~ manual connector insertion, heat-sink screw torqueing, slow-clamping ICT bed-of-nails fixtures ~ release mechanical energy at low frequencies, where a rate of 500 Hz to 2.0 kHz resolves the strain profile cleanly. Dynamic events like pneumatic depaneling, V-score breaking, routing, laser singulation, and drop testing launch sharp stress waves through the laminate.
Depaneling saw blades impart high-frequency shock transients that demand channel sampling rates between 10 kHz and 50 kHz to prevent peak clipping.
A strain channel sampled at 10 kHz captures dynamic peak strains during pneumatic depaneling that remain completely invisible to low-speed 500 Hz data loggers.
Analog low-pass filtering prevents high-frequency electromagnetic interference from SMT placement motors, reflow conveyor drives, and pneumatic solenoids from folding into the measurement bandwidth. Instrumentation amplifiers employ linear Butterworth low-pass filters with cut-off frequencies set at approximately one-fifth of the sampling frequency. Digital anti-alias filters embedded within analog-to-digital converters provide sharp attenuation roll-offs exceeding 80 dB per octave, eliminating high-frequency line noise without phase distortion in the passband.
- Excitation Voltage Limits ~ Settable range between 1.0 V and 2.5 V DC with low noise output below 100 microvolts peak-to-peak.
- Analog Input Impedance ~ Input impedance exceeding 10 gigohms to minimize loading errors across Wheatstone bridge nodes.
- Channel Sampling Bandwidth ~ Simultaneous sampling capability across all channels reaching up to 50 kHz per channel.
- Bridge Balance Adjustment ~ Automatic digital balance range capable of nulling initial gauge offset strains up to plus or minus 5,000 microstrain.
- Common Mode Rejection Ratio ~ Differential inputs providing CMRR greater than 110 dB at 60 Hz to reject environmental power line noise.
Bridge balancing zeroes out initial assembly pre-loads and sensor installation strains before logging process excursions. Handling during installation leaves residual tension or compression in the grid. Digital balancing routines record these initial offsets and apply DAC nulling or software subtractions prior to the run; baseline offsets exceeding 2,000 microstrain indicate mechanical damage to the foil or severe local board warping introduced during bonding.
Calibration routines execute shunt calibration steps across the active bridge arm. Connecting a high-value precision resistor, such as 100 kilohms, in parallel with a 120-ohm gauge simulates a precise, known strain shift. Comparing the measured voltage output step against the theoretical shunt value verifies system gain accuracy, lead-wire attenuation factors, and digital scaling coefficients prior to recording line data.
Manufacturer gauge factors shift with temperature. Applying a static gauge factor across wave soldering or reflow profiles creates measurement bias; acquisition software compensates by applying polynomial correction curves from the gauge manufacturer, maintaining fidelity from minus 20 to plus 150 degrees Celsius.
System resolution remains a function of analog-to-digital converter bit depth and amplifier gain settings. A 24-bit delta-sigma converter operating over an input range of plus or minus 10 millivolts achieves a theoretical resolution better than 0.1 microstrain per bit. Noise floors on production SMT lines typically restrict effective resolution to approximately 1.0 to 2.0 microstrain peak-to-peak, which provides sufficient margin when measuring manufacturing strains ranging between 100 and 2,000 microstrain.
As a practical rule, excitation voltage should be reduced until doubling it produces no measurable baseline drift.

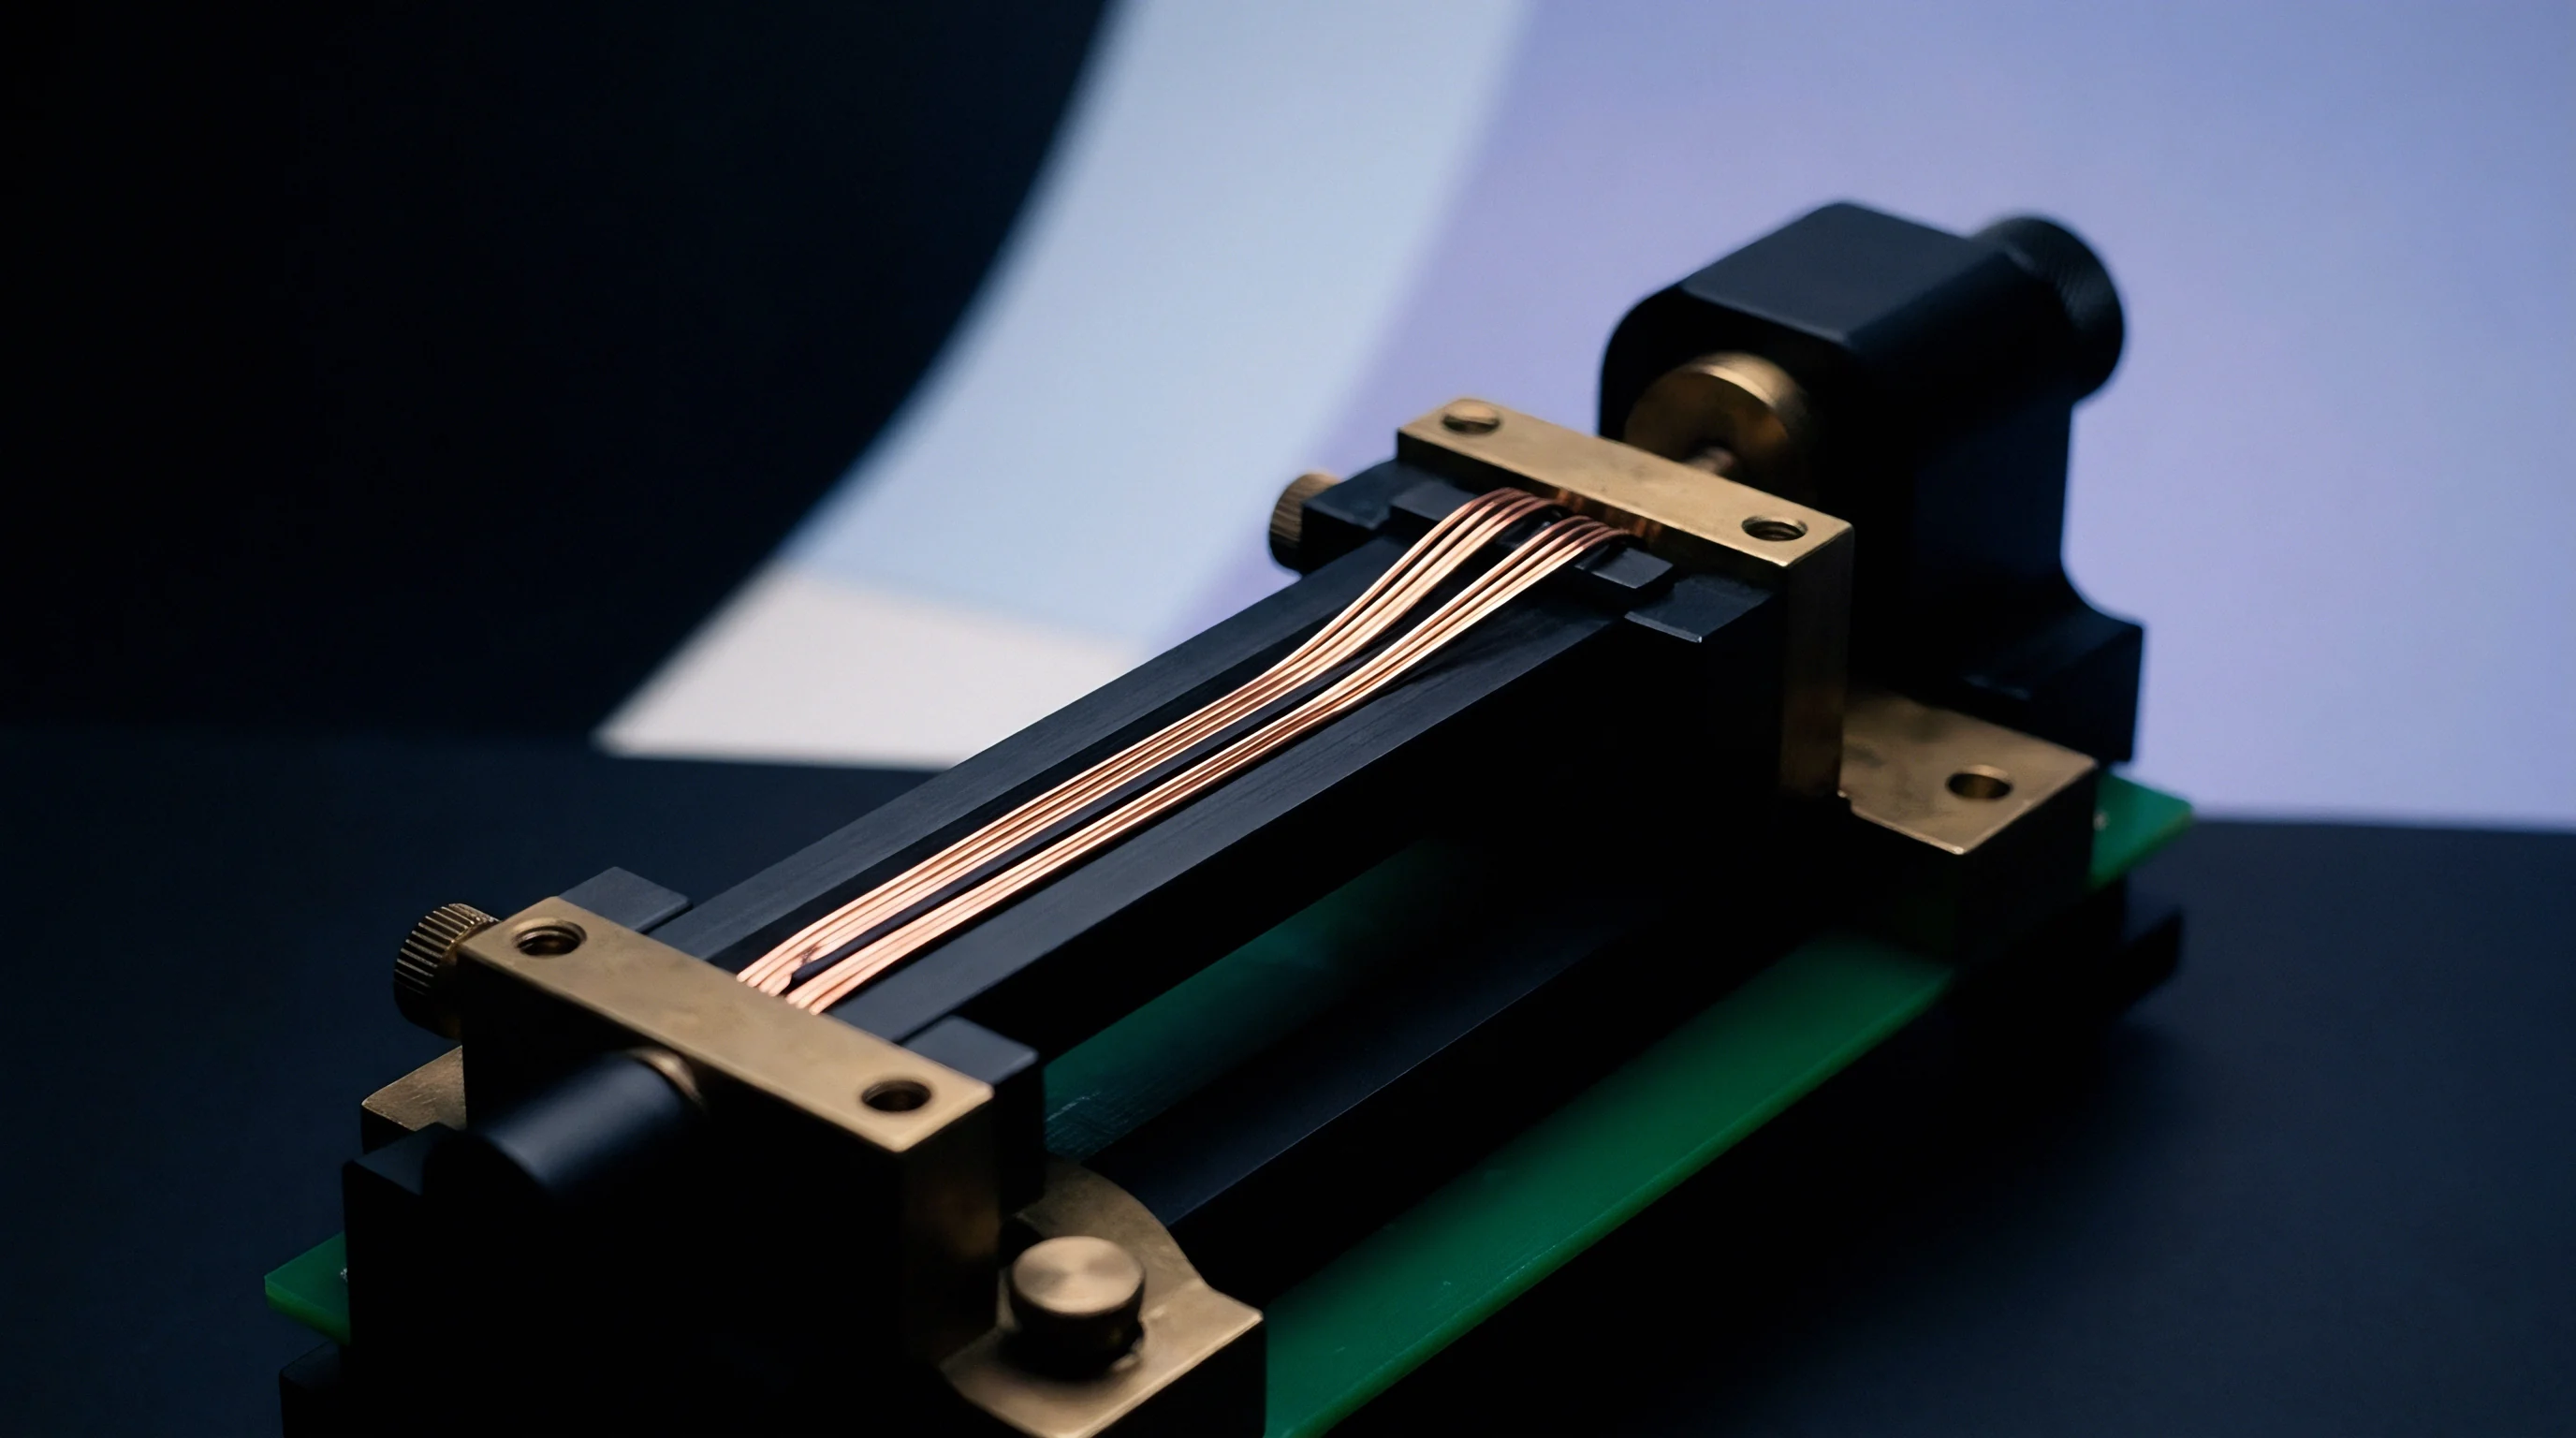
Transient
Surface mount manufacturing lines subject circuit board assemblies to multi-axial mechanical stress events during transport, placement, soldering, testing, and singulation. An IPC-JEDEC-9704 line audit maps these mechanical interaction points across the complete assembly process. Audit boards equipped with strain rosettes pass through every manual and automated workstation to quantify peak microstrain levels and strain rates.
Identifying high-stress steps allows process engineers to modify mechanical fixturing, adjust stroke limits, or slow down pneumatic actuator speeds before structural damage degrades production yield.

Mapping Excursion Points across SMT Operations
Automated surface mount processing begins with raw circuit board panel loading and screen printing. Mechanical edge clamps on solder paste printers hold the panel rigid during squeegee passes. Excessive clamping force or misaligned board support pins beneath the panel cause vertical flexing during solder paste deposition.
Unsupported panel centers bow downward under squeegee downward pressures exceeding 50 Newtons, inducing cyclic tensile strains on bottom-side components.
Pick-and-place machines represent a frequent source of impact damage. Nozzles strike package tops at speed to seat leads firmly into paste. Incorrect Z-axis stroke limits or worn stop dampers drive kinetic energy straight into the laminate, producing localized bending spikes directly beneath package corners.
High-acceleration multi-head gantries can also ring structural resonant frequencies across broad, thin panels.
Reflow oven transit subjects board panels to combined thermal and mechanical stress. Differential thermal expansion between edge-conveyor chains, center-board support belts, and circuit board laminates generates planar twisting and sagging. Clamping edge-rails too tightly prevents lateral thermal expansion, forcing the heated board to buckle vertically.
Bending strains recorded during reflow transit reflect thermomechanical warpage that damages solidifying solder joints at package corners.
In-Circuit Testing applies some of the heaviest mechanical loads seen on the floor. Bed-of-nails fixtures bring hundreds of spring-loaded pogo pins against bottom test pads, often totaling well over 1,000 Newtons of upward thrust. If hold-down fingers on the top plate do not sit directly opposite dense pin clusters, the unsupported board bows sharply during fixture closure, generating steep microstrain spikes at adjacent BGA corners during pull-down and release.
Board depaneling operations generate high-amplitude, high-frequency strain transients. Singulation techniques include V-score snapping, mechanical routing, punch dicing, and laser cutting. Mechanical routing bits generate severe high-frequency vibrational stress if the router bit is worn, feed rates are excessive, or panel vacuum hold-downs fail to secure individual boards.
V-score snapping relies on manual or motorized circular blades to shear the remaining webbing; misaligned blades or worn scoring tools impart severe bending moments across components located near the cut line.
| Manufacturing Operation | Dominant Loading Type | Typical Microstrain Range (με) | Typical Strain Rate (με/sec) | Primary Failure Mode |
|---|---|---|---|---|
| Solder Paste Printing Clamping | Planar Compression / Edge Flexure | 100 – 300 | 500 – 2,000 | Solder paste smear, early pad flexure |
| High-Speed Component Placement | Dynamic Z-Axis Impact Loading | 200 – 800 | 10,000 – 50,000 | Die microcracking, substrate pad cratering |
| Reflow Conveyor Center Support | Thermomechanical Sag / Warpage | 150 – 600 | 100 – 1,000 | Head-in-pillow, hot-tear solder fractures |
| ICT Bed-of-Nails Engagement | Static Unbalanced Multi-Point Bending | 400 – 1,500 | 2,000 – 15,000 | BGA solder joint cracking, pad cratering |
| Router Bit Edge Depaneling | High-Frequency Shear Vibration | 300 – 1,200 | 20,000 – 120,000 | MLCC ceramic cracking, trace lifting |
| Manual Connector Assembly | Asymmetric Manual Torsional Flexure | 500 – 2,200 | 5,000 – 40,000 | Interlayer dielectric separation, trace damage |
Line Audit Execution Sequence
Conducting an audit requires systematic preparation of test boards and instrumentation to capture valid operational strain profiles across all manufacturing stations.
- Auditors select functional or mechanical-sample circuit board assemblies representing the thinnest substrate variant and heaviest mass components in the product family.
- Engineers identify critical component locations including fine-pitch BGAs, large chip packages, surface-mount connectors, and multilayer ceramic capacitors positioned within 10 millimeters of board edges or tooling holes.
- Technicians surface-prepare target sites and bond triaxial strain rosettes within 1.0 millimeter of package corners, routing lead wires through non-functional board zones to secure anchor terminals.
- Operators perform signal conditioning setup, zeroing baseline offsets, calibrating bridge channels, and verifying signal noise floors below 5 microstrain on static benches.
- The instrumented board assembly enters the primary manufacturing line, recording continuous multi-channel strain data through solder paste printing, placement, reflow, wave soldering, ICT, manual assembly, depaneling, and final enclosure integration.
- Signal processing software extracts raw strain time-history channels, calculates time-correlated principal strain tensors and strain rates, and tags timestamps matching physical workstation transitions.
- Auditors overlay calculated strain profiles against allowable IPC-JEDEC-9704 strain limit envelopes to flag non-compliant processing steps and generate engineering audit reports.
Manual assembly introduces sharp, unpredictable stress variations driven entirely by operator technique. Snapping memory cards into sockets, driving multi-pin headers into through-holes, or torquing housing fasteners imparts asymmetric twisting forces to the PCB. Large surface-mount ceramic capacitors (1206 footprint and up) positioned near housing snap-latches crack easily during manual insertion if the board lacks solid mechanical support directly underneath the component site.
Handling and transport between manufacturing stations represent secondary risk factors. Dropping a board tote onto a conveyor or forcefully jamming an assembly into a rigid test nest imparts shock loads that propagate through the board matrix. Strain gauge profiling during routine transport identifies hazardous handling practices that bypass conventional tooling design reviews.
Unidentified high-strain steps allow sub-critical microcracks to slip through into finished inventory, surfacing later as intermittent field failures and thermal fatigue opens.


Limit
Mathematical conversion of raw strain outputs from triaxial rosettes converts three scalar grid measurements into principal strain vectors that directly correlate with mechanical material strength limits. A 0/45/90 degree triaxial rosette measures normal strains along three axes: grid A (εA at 0 degrees), grid B (εB at 45 degrees), and grid C (εC at 90 degrees). Principal strains calculate the maximum tensile strain (ε1) and maximum compressive strain (ε2) experienced by the board laminate at the sensor location, independent of gauge orientation relative to the component geometry.
Principal Strain and Strain Rate Computations
The standard equations defined in IPC-JEDEC-9704 transform raw rosette measurements into principal strain magnitudes:
ε1 = fracεA + εC2 + frac1sqrt2 sqrt(εA – εB)2 + (εB – εC)2
ε2 = fracεA + εC2 – frac1sqrt2 sqrt(εA – εB)2 + (εB – εC)2
Tensile principal strain (ε1) is the primary indicator for brittle failure mechanisms like pad cratering beneath BGAs, trace lifting, and ceramic die fractures. Compressive principal strain (ε2) tracks crush loads and buckling. Calculated values are scalar figures in microstrain (με), where one microstrain equals a fractional deformation of one micrometer per meter (10-6).
The principal strain angle (thη), defining the orientation of the maximum principal strain relative to the grid A axis, is derived using the relation:
thη = frac12 arctanleft(frac2εB – εA – εCεA – εCright)
Calculating maximum strain rate (dε/dt) requires taking the first time derivative of the principal strain magnitude across contiguous data samples:
fracdεdt = fracε1(t + Δ t) – ε1(t)Δ t
Higher strain rates lower the fracture energy of brittle assembly materials, including epoxy laminates, intermetallic solder boundaries, and ceramic capacitors. Intermetallic solder joints that flex safely under slow loading (100 με/sec) fracture cleanly under dynamic pulses exceeding 10,000 με/sec. Because of this rate sensitivity, IPC-JEDEC-9704 limit envelopes tighten allowable peak principal strains as measured strain rates increase.
Diagonal strain (εdiag) provides an additional metric specifically tailored for evaluating four-row corner BGA solder joint stress states during pure diagonal bending modes. Diagonal strain calculates using grid measurements aligned along the package diagonal vectors, providing sensitivity to complex twisting stresses that simple uniaxial evaluations miss.
Which Board Thickness Modifies Microstrain Envelope Thresholds?
Substrate thickness directly determines the permissible microstrain threshold. Thinner boards flex more easily under applied moments, yielding a smaller surface strain for a given radius of curvature than a thick board. A 1.0-millimeter board bent to a 100-millimeter radius experiences lower surface tensile strain than a 2.4-millimeter board bent to that same curve.
Because of this geometric scaling, IPC-JEDEC-9704 tightens allowable strain limits as substrate thickness increases.
Standard IPC-JEDEC-9704 compliance profiles mandate scaling allowable strain thresholds inversely against board thickness to preserve equivalent outer-fiber tensile stress levels across substrate variants.
Laminate chemistry also alters flexural modulus and allowable strain. Standard FR-4 exhibits an elastic modulus between 18 and 22 Gigapascals, while high-Tg and halogen-free laminates are noticeably stiffer, often exceeding 25 Gigapascals. These halogen-free resin systems have lower elongation-to-break, requiring stricter strain ceilings to prevent pad cratering under area-array footprints.
Solder metallurgy plays an equal role in joint vulnerability. Eutectic Sn63Pb37 solder creeps and yields under load, absorbing board flexure through plastic flow without instantaneous fracture. Lead-free SAC305 (Sn96.5Ag3.0Cu0.5) and SAC105 alloys are stiffer, transferring bending energy straight into the intermetallic layer and the resin beneath the copper pad.
Low-temperature bismuth alloys (Sn42Bi58) are exceptionally brittle at ambient temperatures, demanding tight strain controls during mechanical handling.
- Interlayer Pad Cratering ~ Cohesive dielectric fracture beneath the copper land pad induced by localized tensile strain concentrations at the pad perimeter.
- Solder Joint Microcracking ~ Interfacial fracture propagating through the fragile copper-tin intermetallic compound layer (Cu6Sn5 and Cu3Sn) at the component interface.
- Ceramic Dielectric Cracking ~ Flexural fracture traversing the ceramic layers of MLCC capacitors, creating low-impedance short-circuit pathways across internal electrodes.
- Copper Trace Shear Fracture ~ Tensile necking and breaking of surface microstrip lines adjacent to rigid solder fillets during substrate flexing.
- Package Substrate Delamination ~ Separation of outer resin layers within organic BGA substrates under severe local mechanical shear gradients.
IPC-JEDEC-9704 sets baseline microstrain limits based on package type, pitch, solder alloy, board thickness, and strain rate. For a standard 1.6-millimeter thick FR-4 board featuring fine-pitch BGA packages ( 10,000με/sec).
Under Section 5.2.1 of IPC-JEDEC-9704, operations exceeding the maximum allowable strain-rate envelope trigger an immediate engineering hold until tooling re-alignment or mechanical damping lowers peak stresses.

Correction
Acquired raw strain data requires systematic mathematical verification and noise suppression to prevent false-positive threshold flags or undetected stress events. Mechanical vibrations from pneumatic line machinery, electrical motor drives, and RF identification systems induce common-mode line noise on high-gain strain channels. Processing data involves separating physical mechanical strain signals from environmental noise artifacts, temperature drift trends, and gauge debonding phenomena.
Signal Artifact Identification and Noise Mitigation
Adhesive failure under the gauge is a frequent source of bad data during audits. When the bond line fails, the channel displays sudden step-shifts, high-frequency hash, or total signal drop. These debonding artifacts regularly produce instantaneous swings beyond 5,000 microstrain without corresponding readings on adjacent rosette channels or physical displacement on the board.
Validation scripts catch these events by flagging slope discontinuities where the rate of change outstrips the physical strain limits of the glass-epoxy matrix (> 500,000 με/sec), discarding corrupted runs.
Thermal offset correction removes baseline shifts caused by ambient heating during processes such as reflow transit, wave soldering, or hot-bar component soldering. Thermal expansion of the substrate, combined with temperature-dependent resistance changes within the strain grid alloy, produces an apparent strain signal independent of mechanical stress. Thermal drift manifests as a smooth, low-frequency baseline shift tracking the thermal profile of the process oven.
High-pass filtering or baseline thermal compensation algorithms subtract thermal offset curves using reference un-bonded gauges mounted on adjacent non-stressed substrate samples subjected to identical thermal profiles.
Raw strain signals must undergo automated discontinuity screening to filter out artificial high-amplitude spikes caused by gauge debonding or electromagnetic motor interference before computing principal tensors.
Anti-aliasing and digital low-pass filtering clean up residual high-frequency electrical noise without clipping genuine mechanical peaks. Linear-phase FIR filters maintain time correlation across all rosette channels. Filter cutoffs must stay above the mechanical frequency range of the tooling: setting a low-pass cutoff below 2,000 Hz during a router audit rounds off true strain spikes, masking out-of-spec excursions.
Audit reporting centers on time-correlated principal strain traces, strain-rate distribution plots, and machine-indexed excursion logs. Core summary metrics include mean peak microstrain, pass-to-pass standard deviation, and process capability (Cpk) against IPC-JEDEC-9704 thresholds. A Cpk above 1.33 confirms a workstation maintains sufficient safety margin across normal production variations.
Tracking metrics across multiple audit passes highlights creeping process drift from tool wear, worn fixture dampers, or shift-to-shift operator variations.
Real-time signal analysis algorithms running on line audit instrumentation face the challenge of isolating micro-cracking acoustic transients from background factory electrical noise during high-speed routing.


Remediation
When line audit data identifies manufacturing stations that exceed allowable IPC-JEDEC-9704 microstrain or strain rate thresholds, process engineers implement targeted mechanical tooling and operational modifications. Eliminating excessive strain relies on re-designing physical support structures, modifying equipment actuation profiles, establishing component keep-out zones, and optimizing board handling procedures. Implementing corrective actions reduces product failure rates, eliminates latent field defects, and preserves assembly yields across volume production runs.

Tooling Redesign and Support Optimization
Bed-of-nails test fixtures generate severe strain spikes when top push-down fingers apply unbalanced force against irregular component layouts. Correcting this starts with placing dedicated support pins directly beneath dense BGA sites and capacitor arrays. Spring-loaded bottom pins positioned next to heavy pogo-pin clusters counter upward probe forces, stabilizing the board during vacuum pull-down or mechanical actuation.
Re-aligning top push-down fingers to bear directly against bottom support points cancels net bending moments across the substrate.
Depaneling machinery requires precise mechanical tuning to damp destructive vibration transients. For mechanical router systems, replacing worn dual-flute router bits with diamond-cut multi-flute bits reduces cut resistance and edge vibration amplitudes by up to 40 percent. Adjusting router bit rotational speeds (RPM) and lowering feed rates along panel cut-outs minimizes flexural stress transferred into peripheral components.
Vacuum hold-down fixtures must clamp individual circuit board segments firmly on both sides of the cut line to prevent cantilevered board flutter during tab separation.
V-score singulation demands tight blade tracking and uniform web thickness. Blades need to run true within 0.05 millimeters; misaligned scoring wheels twist the panel as it feeds, generating intense localized shear. Setting blade depth to leave a consistent 0.30 to 0.40 millimeter web lowers the required breakout force while maintaining adequate panel rigidity through surface mount and reflow processing.
| Manufacturing Workstation | Identified Strain Mechanism | Engineering Remediation Action | Microstrain Reduction (%) | Implementation Landed Cost ($) |
|---|---|---|---|---|
| ICT Bed-of-Nails Fixture | Unbalanced Pogo Pin Load | Add contoured bottom support pins under BGAs | 55 – 70 | 800 – 2,500 |
| Edge Depaneling Router | High-Frequency Edge Vibration | Switch to multi-flute bit; optimize feed speed | 35 – 50 | 150 – 500 |
| Pick-and-Place Nozzle Impact | Over-travel Z-Axis Placement Force | Re-calibrate nozzle placement height and damping | 40 – 60 | 0 (Software setup) |
| Manual Connector Insertion | Operator Asymmetric Torsion | Install rigid underside backup anvil fixture | 60 – 80 | 500 – 1,200 |
| V-Score Breakout Station | Manual Flexural Shearing | Replace manual snapping with motorized singulation | 50 – 65 | 3,500 – 8,000 |

Layout Keep-Out Zones and Sourcing Economics
Preventing flexural damage in future product revisions requires establishing mechanical layout keep-out rules driven by IPC-JEDEC-9704 audit findings. Component placement guidelines enforce minimum clearance distances between fragile surface mount parts and mechanical stress sources on the circuit board layout.
- Depaneling Cut-Line Clearance ~ Position BGAs, QFNs, and MLCCs greater than 5.0 millimeters away from routed tabs, V-score lines, or punched panel edges.
- Tooling Hole Margin ~ Maintain a clear boundary of at least 4.0 millimeters around locator pin holes and support pin contact zones.
- Mounting Hole Perimeter ~ Enforce a keep-out radius of 6.0 millimeters around screw mounting holes to isolate components from structural screw-head torque flexure.
- Panel Edge Distance ~ Locate high-density area array packages at least 8.0 millimeters inside panel edge-conveyor clamping rails.
- Component Orientation Alignment ~ Orient fragile chip components (such as 0805 and 1206 MLCCs) parallel to the principal bending axis rather than perpendicular to reduce outer-fiber strain pick-up across ceramic terminations.
Setting up strain-gauge audits requires an upfront investment in hardware, consumables, technician time, and analysis. A functional line qualification rig runs between $15,000 and $45,000 depending on channel count and sampling bandwidth. Foil rosettes and adhesives add $150 to $300 per audited assembly.
That outlay balances against the cost of scrap and latent field failures. A single recall driven by pad cratering or cracked capacitors beneath area-array parts routinely exceeds hundreds of thousands of dollars in replacement costs and warranty administration. In-line strain measurement converts those unpredictable field liabilities into controlled process variables.
Periodic audit schedules maintain manufacturing line compliance across equipment maintenance cycles, tooling updates, and process modifications. Re-qualifying SMT lines every six months or following major machinery overhauls ensures that component stress levels remain within IPC-JEDEC-9704 thresholds throughout the full product lifecycle.