Designing Central Anchor Suspensions for Sub Micron Displacement Control
Central anchor MEMS suspensions eliminate thermal package stress by expanding radially from a single origin, preserving nanometer displacement accuracy.

Symmetry
Placing the mechanical attachment point at the center of a precision micro-element isolates the moving mass from differential stress fields inside the package housing. When ambient temperatures fluctuate or die-attach epoxies cure unevenly, thermal expansion and mechanical strain radiate outward from the substrate. In peripheral anchor configurations, four separate anchor pads located at the outer frame boundaries constrain the device.
Differential thermal expansion between the silicon substrate and a ceramic or metallic carrier forces stress directly into the suspension arms, producing buckling, zero-offset shift, and unpredictable changes in flexure spring constants. Placing a single anchor or closely spaced dual anchors at the geometric center alters the stress transmission pathway completely: isotropic thermal growth expands the element radially from the origin without inducing net bending moments in the flexure beams.
Thermo Mechanical Isolation Mechanics
Sub-micron displacement control demands that external force vectors entering through the substrate cancel before reaching the active flexure arms. A central anchor achieves stress rejection because expansion vectors propagate symmetric radial strain across the entire device layer. Assuming a uniform thermal coefficient mismatch between a 300-micrometer silicon substrate and an alumina package carrier across a 100-degree Celsius delta, peripheral anchor sites generate shear stresses exceeding 80 megapascals.
Central anchor suspensions reduce localized flexure strain below 1.5 megapascals under the identical thermal exposure. This isolation prevents mechanical thermal drift from translating into false displacement signals in high-precision capacitive or optical readouts.
Uneven curing of die-attach epoxy and thermal expansion mismatch deform structural anchors, driving package stress directly into the zero offset unless the silicon can expand radially.
| Suspension Topology | Anchor Footprint Count | Peak Flexure Stress (MPa) | Zero Shift (nm/°C) | Cross-Axis Rejection (dB) |
|---|---|---|---|---|
| Peripheral Four-Corner | 4 Pads Outer Frame | 84.2 | 12.40 | -32.5 |
| Peripheral Two-Side Dual | 2 Bars Outer Frame | 41.6 | 4.10 | -41.0 |
| Central Single Anchor | 1 Pedestal Center | 1.2 | 0.03 | -68.2 |
| Central Folded Symmetric | 2 Pedestals Core Axis | 2.8 | 0.08 | -62.4 |

Parasitic out of Plane Stiffness Suppression
Decoupling the primary displacement axis from torsional or vertical disturbance modes depends on the spatial distribution of the anchoring flexures. High-aspect-ratio silicon micro-machining enables out-of-plane stiffness values fifty to one hundred times greater than in-plane displacement stiffness. A central anchor configuration introduces specific modal vulnerabilities.
While in-plane thermal stress drops, out-of-plane rocking modes can decrease in frequency if the central anchor width becomes too narrow relative to the proof mass envelope. Balancing out-of-plane mode separation involves tuning the structural thickness-to-width ratio of the flexure arms while maintaining a wide pedestal core.
Isotropic expansion around a single central coordinate preserves flexure arm length equality across uniform thermal fields.
The operational bandwidth of a sub-micron displacement controller must sit below the first parasitic resonant mode of the suspension. Design rules require the lowest non-driven mode, typically out-of-plane tilting or vertical translation, to remain at least 3.5 times higher in frequency than the primary sensing resonance. Central anchor designs utilize folded double-meander flexures that loop back toward the central pedestal.
This maintains long structural path lengths for low in-plane stiffness while concentrating structural stiffness near the anchor core to resist out-of-plane torque.
How far the central anchor radius can expand before thermal gradients within the anchor material itself generate asymmetric strain fields remains a subject of ongoing finite element modeling.
Beam
Suspension geometries designed for sub-micron positioning rely on thin flexural structural elements operating entirely within their elastic deformation limits. Single-crystal silicon offers exceptional mechanical fatigue resistance, exhibiting zero elastic hysteresis below its brittle fracture threshold. Achieving nanometer-scale displacement accuracy requires exact structural beam dimensions.
Beam length, width, and thickness define the suspension stiffness tensor. A central anchor suspension routes flexure arms internally toward the core, constraining overall die footprint while maximizing effective beam length to maintain low spring constants.
Nonlinear Mechanical Response and Duffing Behavior
Deflections exceeding one percent of flexure thickness introduce geometric stiffening effects that shift the resonant frequency of the suspension. Under sub-micron operation, a beam undergoing displacement exhibits Duffing spring nonlinearity. The restoring force follows a cubic relationship with displacement alongside the linear Hookean spring term.
When deflections approach several hundred nanometers in a 10-micrometer wide beam, the cubic stiffness term increases overall restoring force, distorting linear calibration curves and generating harmonic drive distortion.
Mechanical Duffing nonlinearity distorts resonance, thermal gradients compromise beam symmetry, and anchor damping sets an upper bound on the quality factor.
Brownian displacement noise density reaches 0.15 picometers per root Hertz at 100 Hertz for a 50-microgram proof mass with a quality factor of 5000 in atmospheric vacuum below 1 Pascal.
Thermoelastic Dissipation and Quality Factor Ceilings
Energy loss through cyclic heat flow across flexure thickness profiles establishes the physical noise floor of monocrystalline silicon suspensions. When a flexure bends, the inner radius experiences compression and heats up, while the outer radius undergoes tension and cools down. Heat flows across the beam thickness along this thermal gradient, irreversibly converting mechanical kinetic energy into thermal dissipation.
Zener thermoelastic dissipation theory dictates the maximum achievable mechanical quality factor for a given beam geometry and operating frequency.
Central anchor suspensions must manage thermoelastic dissipation peaks by selecting beam thickness dimensions that push the relaxation frequency far outside the operational signal bandwidth. Mechanical Brownian displacement noise correlates inversely with the square root of the mechanical quality factor. Designing flexures with high quality factors in low-vacuum enclosures reduces Brownian jitter below 0.1 picometers per root Hertz.
Flexure beam design choices give rise to specific parasitic modes and mechanical failure mechanisms under high-precision displacement operation:
- Duffing Spring Hardening causes non-linear stiffness increases at deflections above 200 nanometers, distorting linear displacement feedback loops.
- Out-Of-Plane Tilting Drift occurs when asymmetric etching profiles lower the vertical moment of inertia relative to the primary displacement axis.
- Thermoelastic Dissipation Peaks reduce mechanical quality factors when the vibration frequency matches the internal thermal relaxation time of the beam width.
- Cross-Axis Stress Coupling arises when transverse loads alter the longitudinal tension of primary flexure beams, shifting baseline resonance.
Doubling flexure thickness elevates out-of-plane stiffness far faster than it changes in-plane displacement sensitivity.
Etch
Fabrication variations during anisotropic micro-machining dictate the physical dimensions and structural performance of single-crystal silicon suspensions. Deep Reactive Ion Etching processes utilize alternating passivation and etch cycles to form deep vertical trenches in silicon-on-insulator wafers. Micro-trenching, sidewall roughness, and scallop formation modify local beam cross-sections.
A variance of 0.2 micrometers in beam width across a 30-micrometer deep device layer shifts flexure stiffness by over six percent due to the cubic dependence of in-plane stiffness on beam width.

When Do Residual SOI Stresses Overpower Central Isolation?
Unbalanced intrinsic strain profiles within silicon-on-insulator device layers generate localized curvature upon box removal. Monocrystalline silicon device layers carry residual thermal stress from oxide growth and bonding processes at temperatures above 1000 degrees Celsius. When the buried oxide layer undergoes hydrofluoric acid etching to release the moving mass, residual stress gradients relax.
If the central anchor footprint contains non-uniform oxide undercut profiles, the differential relaxation causes the proof mass to tilt relative to the substrate plane, introducing non-parallel electrode gaps that degrade displacement sensing linearities.
DRIE sidewall profiles dictate mode shapes, while anisotropic etching shifts stiffness and sacrificial oxide release creates undercuts around structural anchors.
| Process Parameter | Nominal Value | Process Tolerance | Impact on Displacement Control |
|---|---|---|---|
| Device Layer Thickness | 30.0 µm | ± 0.8 µm | Shifts out-of-plane resonant frequency by ± 2.7% |
| DRIE Sidewall Angle | 90.0° | 89.3° to 90.2° | Induces cross-axis coupling ratios up to 0.45% |
| Anchor Oxide Undercut | 5.0 µm | ± 1.2 µm | Alters central pedestal boundary condition stiffness |
| Beam Width Uniformity | 6.0 µm | ± 0.15 µm | Varies in-plane suspension stiffness by ± 7.3% |

Sacrificial Release Undercut and Geometry Control
Chemical removal of buried oxide beneath the central pedestal alters the boundary conditions of the internal flexure joints. Over-etching during the release phase removes oxide beyond the designated central anchor footprint, reducing the mechanical landing pad area and lowering out-of-plane tilting resistance. Under-etching leaves un-etched oxide beneath inner flexure arms, causing mechanical stiction or severe parasitic damping during motion.
Precise timing of vapor-phase hydrogen fluoride release cycles limits anchor undercut variations within a 500-nanometer tolerance band.
Executing baseline displacement inspections demands strict adherence to sequential physical measurement steps on the incoming wafer lot:
- Perform automated white-light interferometry across the unreleased device layer to map surface topography and initial wafer bow.
- Measure device layer silicon thickness at nine standardized wafer locations using spectroscopic reflectometry.
- Execute timed vapor-phase hydrofluoric acid release etching inside a temperature-controlled chamber at 35 degrees Celsius.
- Inspect anchor undercut geometry using scanning electron microscopy on dedicated wafer scribe-line test structures.
- Measure out-of-plane static deflection of released proof masses using laser Doppler vibrometry to verify residual stress relaxation balance.
Uncontrolled anchor notch undercut causes tilt mode frequency degradation that corrupts differential capacitive readout and renders active electronic compensation impossible.

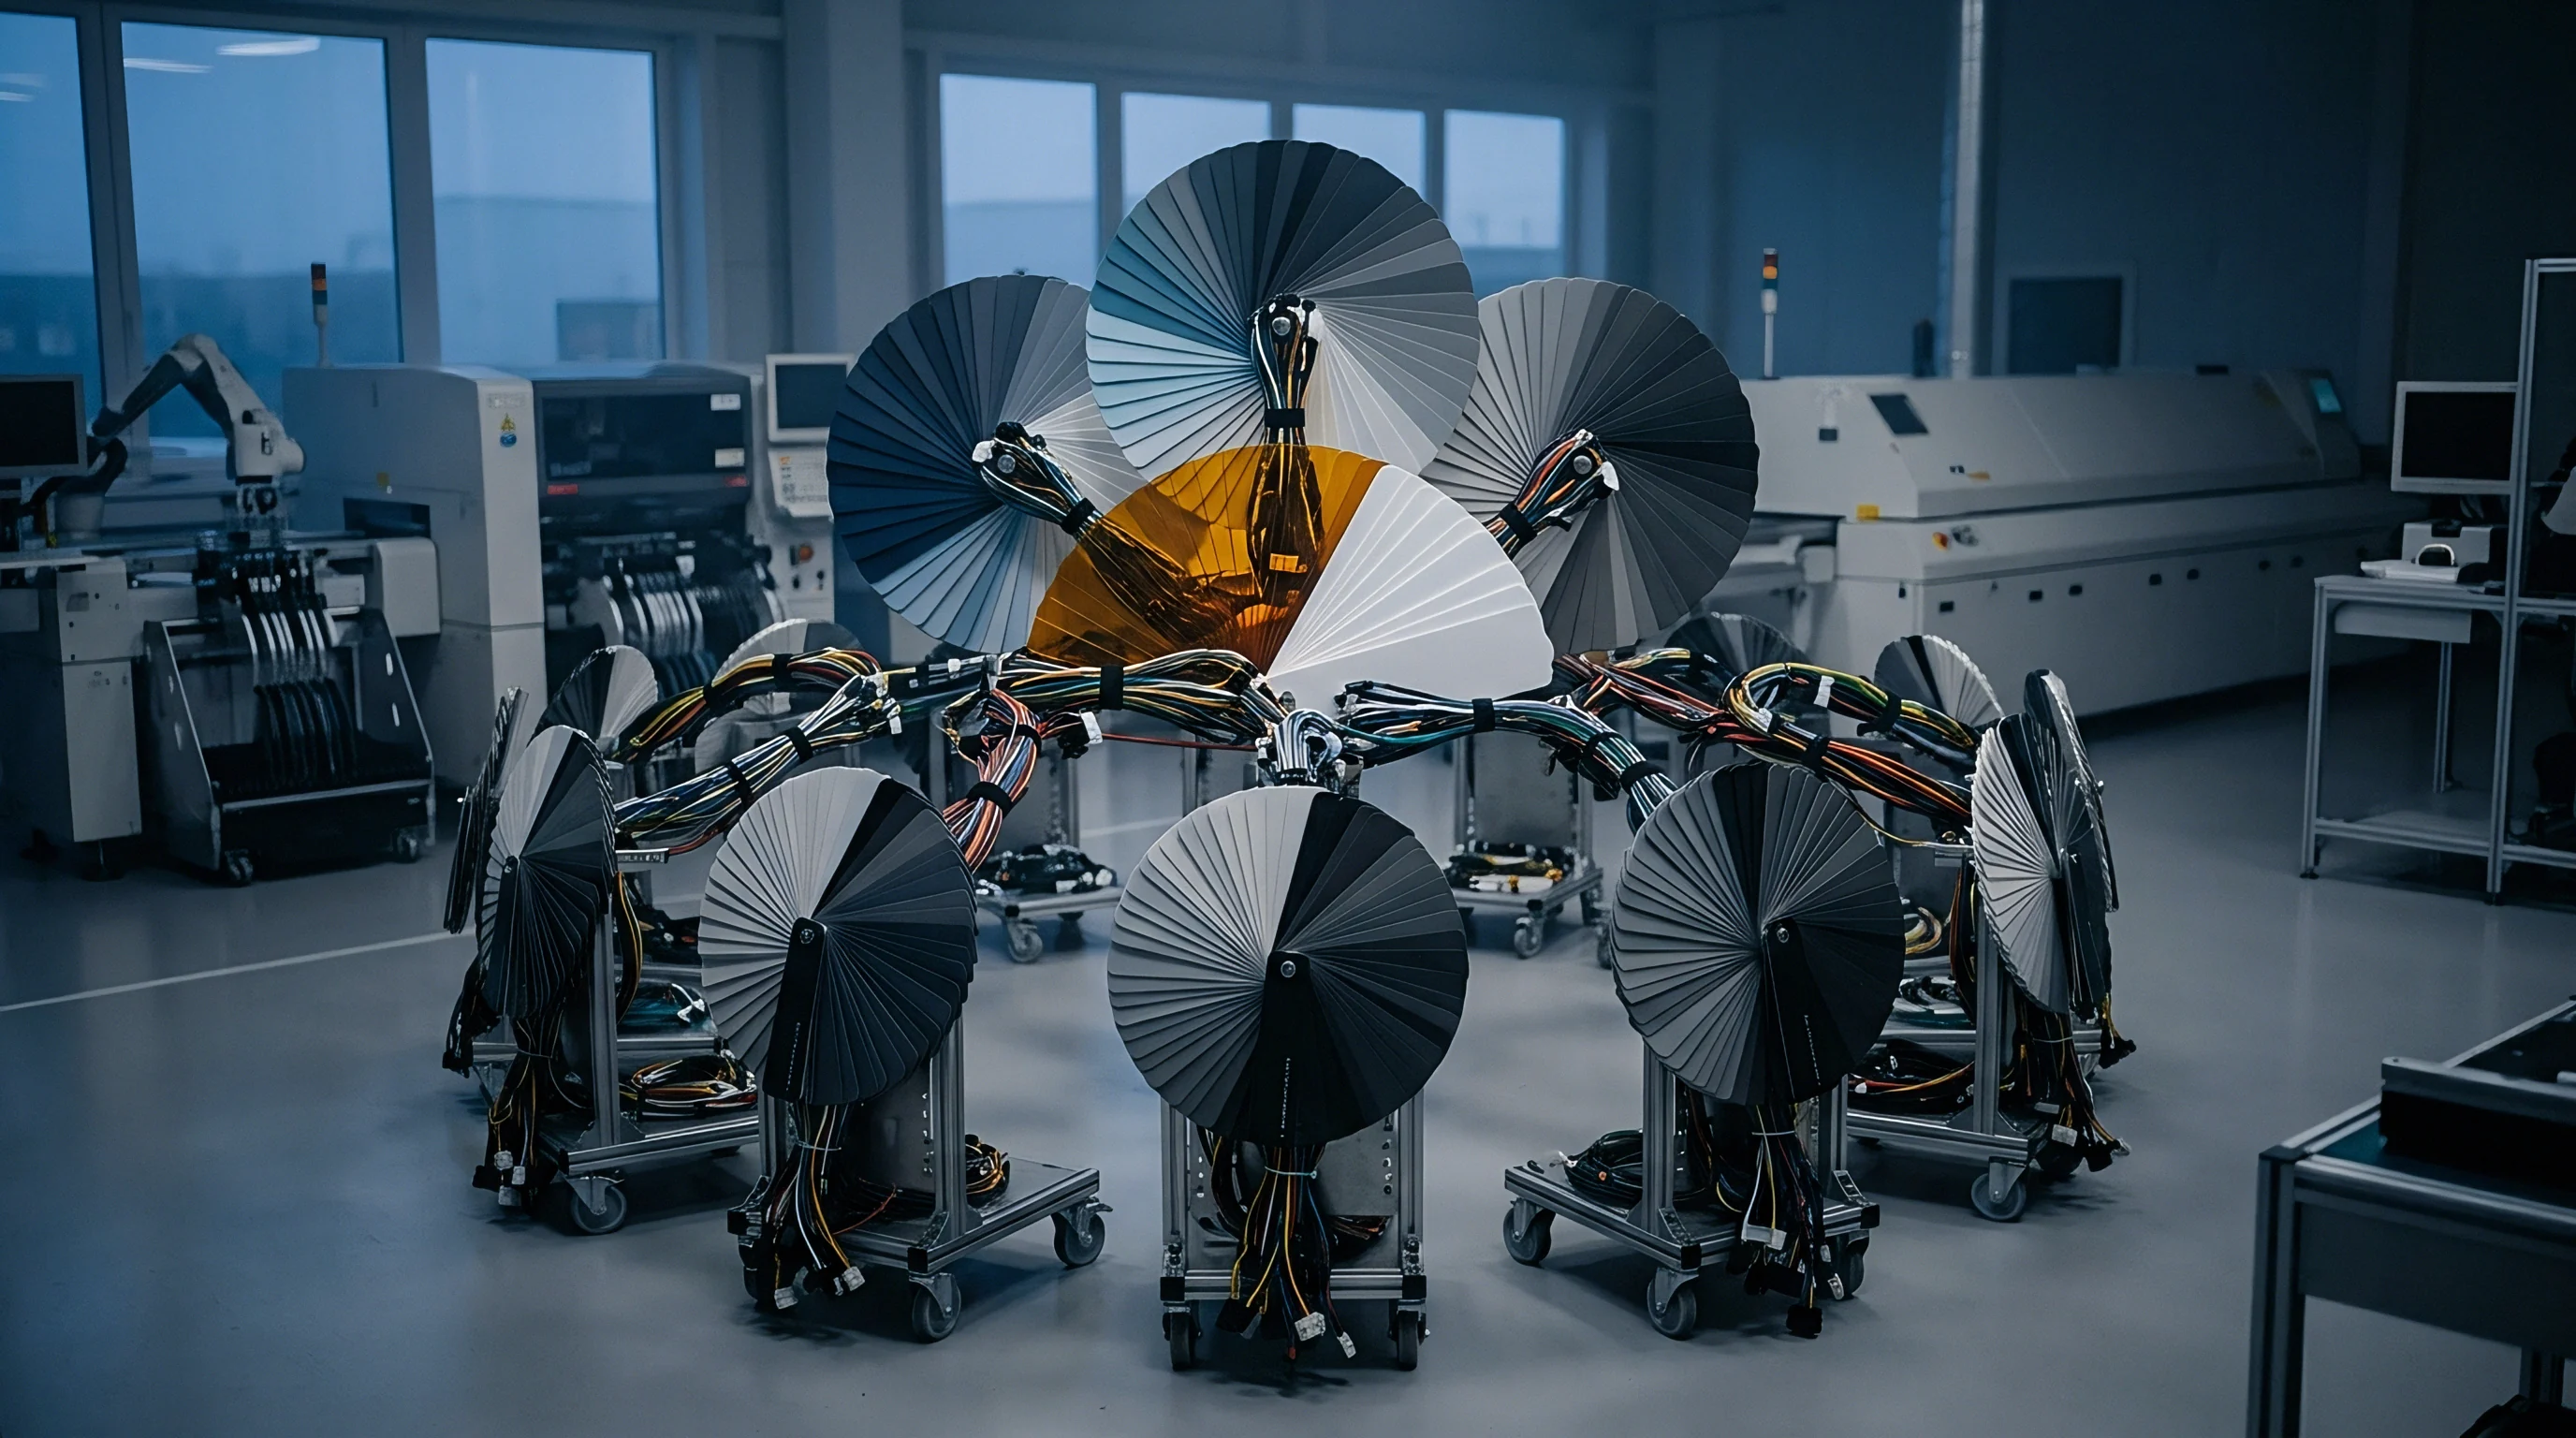
Pickup
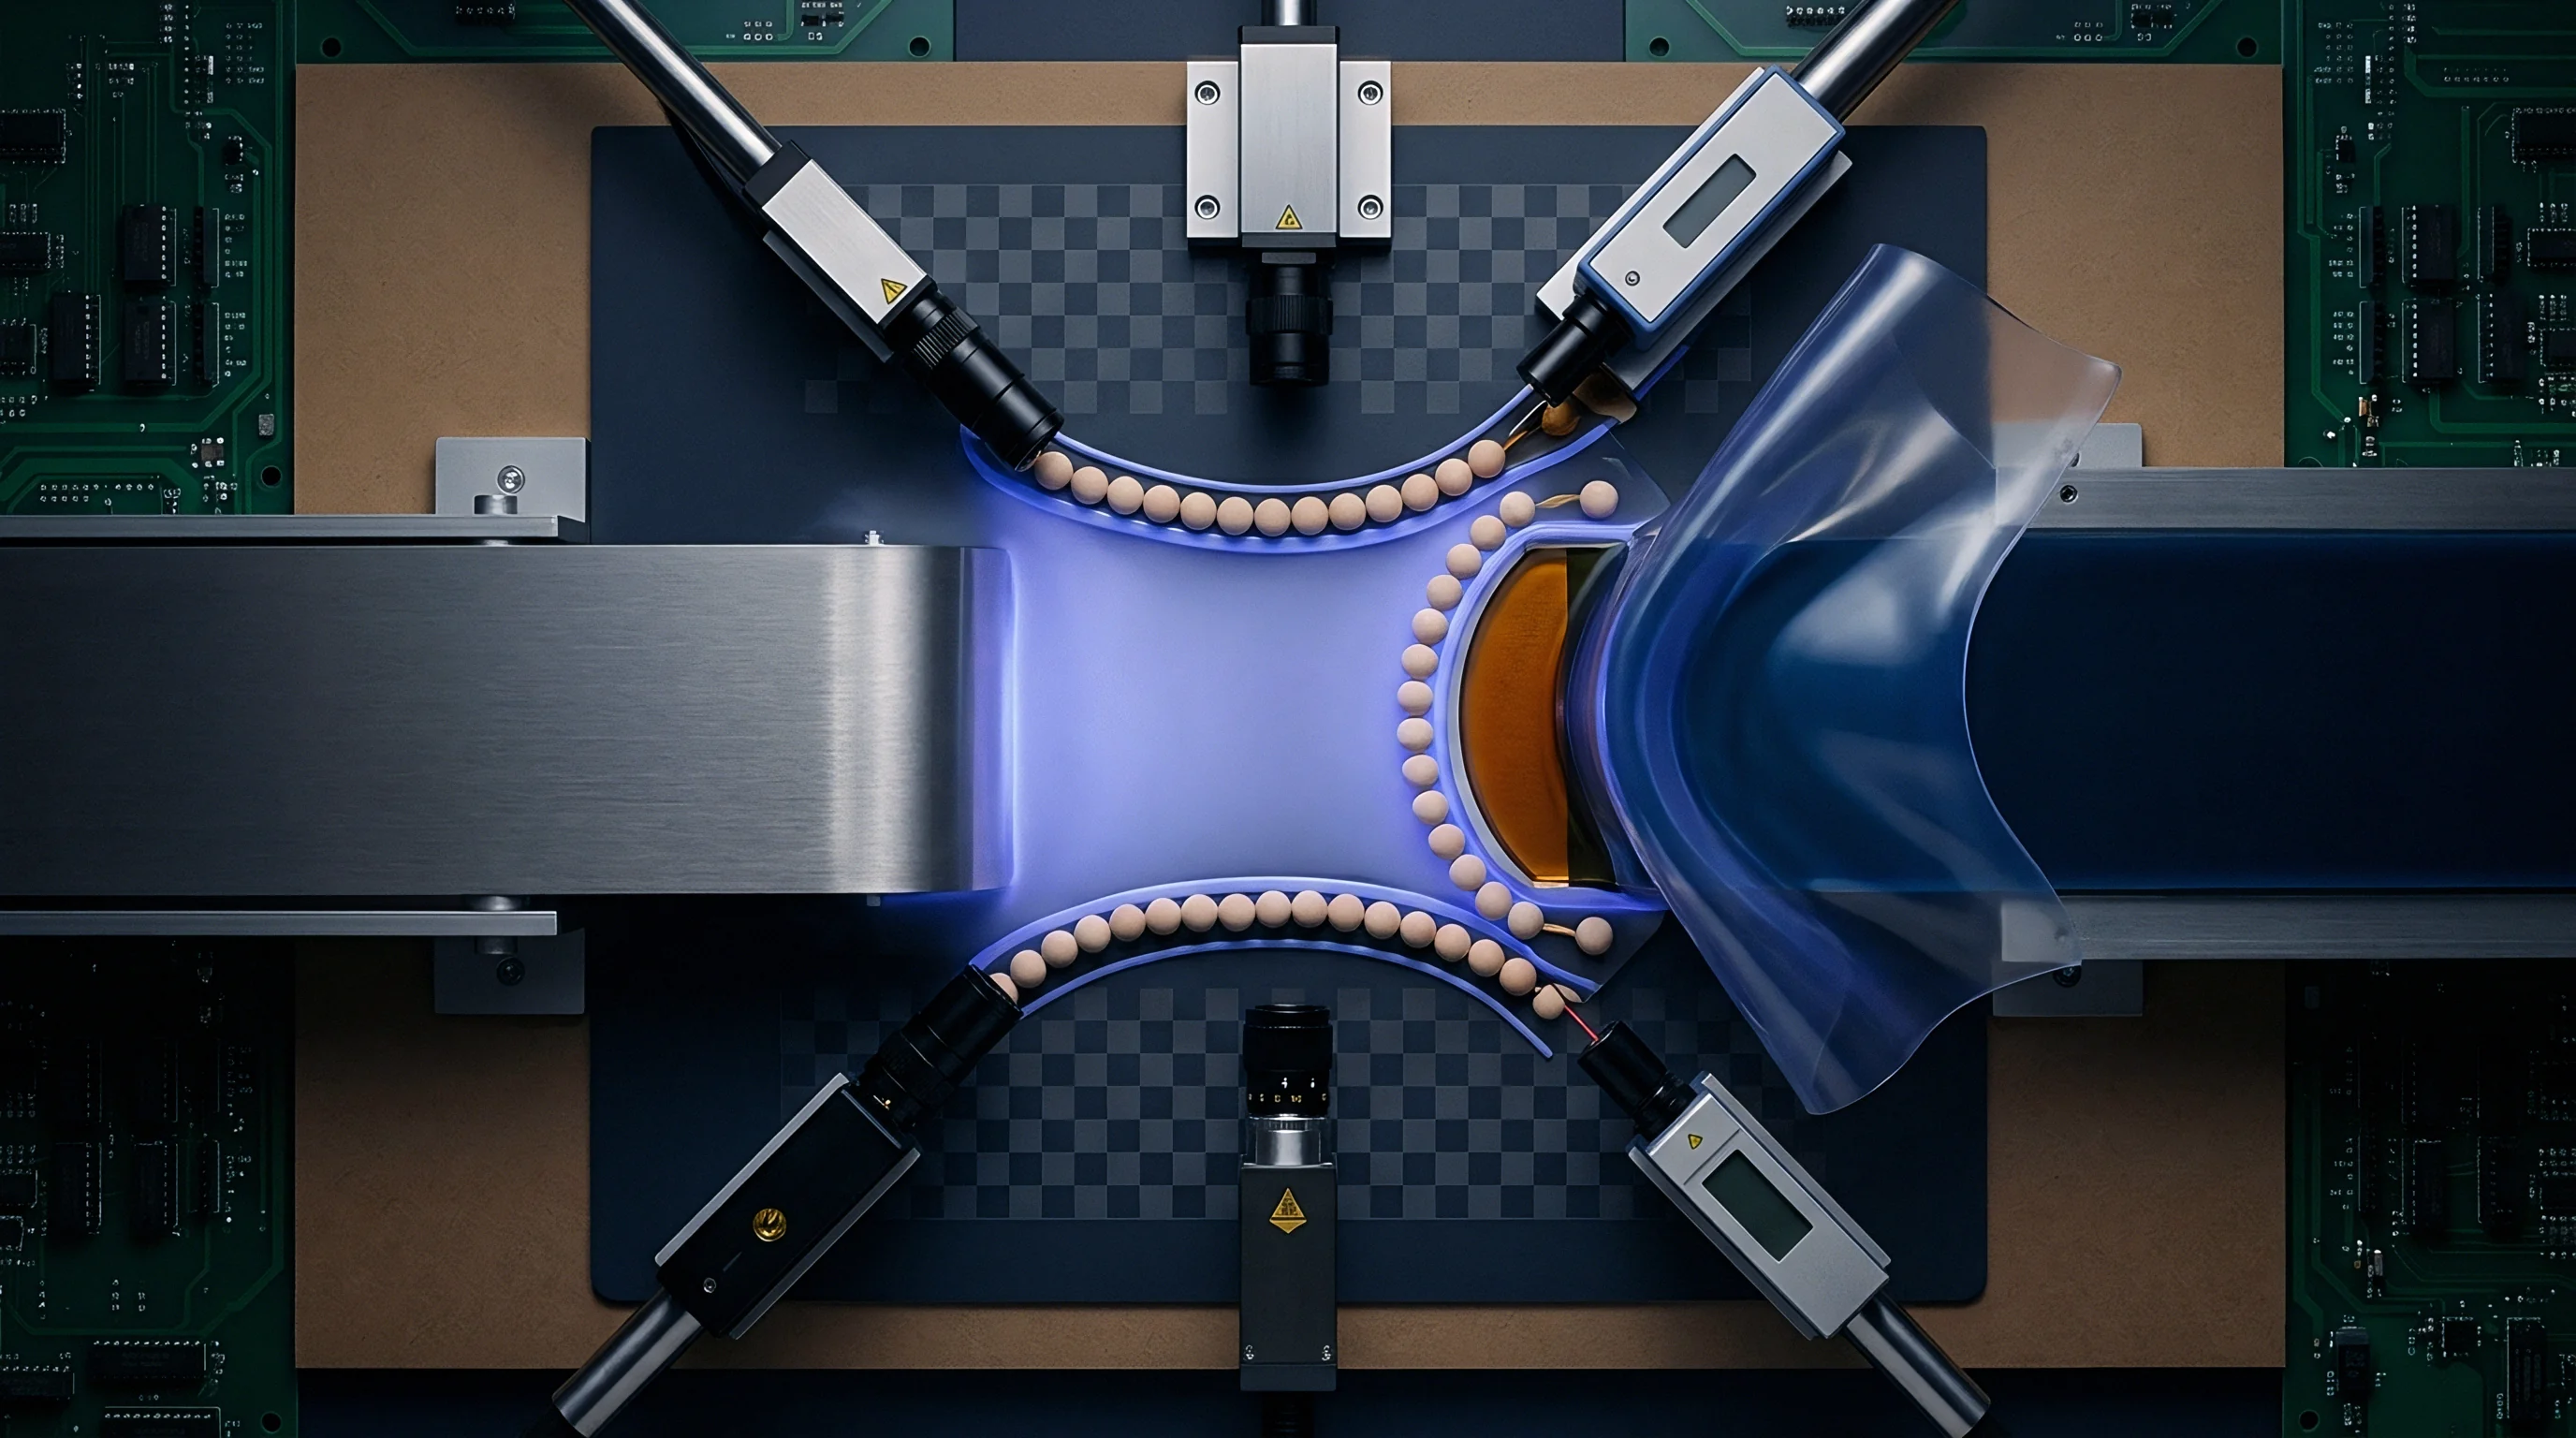
Converting sub-nanometer flexure travel into readable electrical signals requires transducer mechanisms with noise floors well below the mechanical Brownian background. Capacitive sensing configurations dominate central anchor MEMS suspensions due to their simple integration, low power dissipation, and high displacement sensitivity. Differential parallel-plate electrodes placed along the perimeter of a central anchor mass detect sub-nanometer position changes as variations in capacitance.
The resolution limit of this readout depends on electrode surface area, sense gap distance, and preamplifier input noise floors.
Differential Capacitive Transduction and Fringe Compensation
Parallel plate sensing configurations achieve sub-picometer displacement resolution when operated with balanced differential drive signals. Differential pickup cancels common-mode environmental disturbances, such as global dielectric constant changes from ambient humidity fluctuations and uniform substrate temperature shifts. As sense gap dimensions shrink below two micrometers to boost capacitance changes per unit deflection, fringing electric fields at electrode boundaries contribute significantly to total measured capacitance.
Electrostatic field solvers demonstrate that fringe fields represent up to eighteen percent of total nominal capacitance at two-micrometer gap spacings, introducing non-linear response curves during sub-micron displacement excursions.
Electrostatic softening reduces modal frequency, fringe capacitance limits the linear operating range, and preamplifier noise defines the ultimate resolution floor.
| Transduction Principle | Displacement Resolution | Dynamic Range | Power Consumption | Cross-Sensitivity Driver |
|---|---|---|---|---|
| Differential Capacitive | 0.08 pm/√Hz | 110 dB | < 2.5 mW | Dielectric gap change, moisture |
| Comb-Finger Variable Area | 1.20 pm/√Hz | 135 dB | < 1.0 mW | Fringe field distortion, tilt |
| Piezoresistive Wheatstone | 15.00 pm/√Hz | 95 dB | > 12.0 mW | High temperature coefficient |
| Optical Interferometric | 0.01 pm/√Hz | 85 dB | > 45.0 mW | Laser wavelength thermal drift |
Electrostatic Spring Softening Modulation
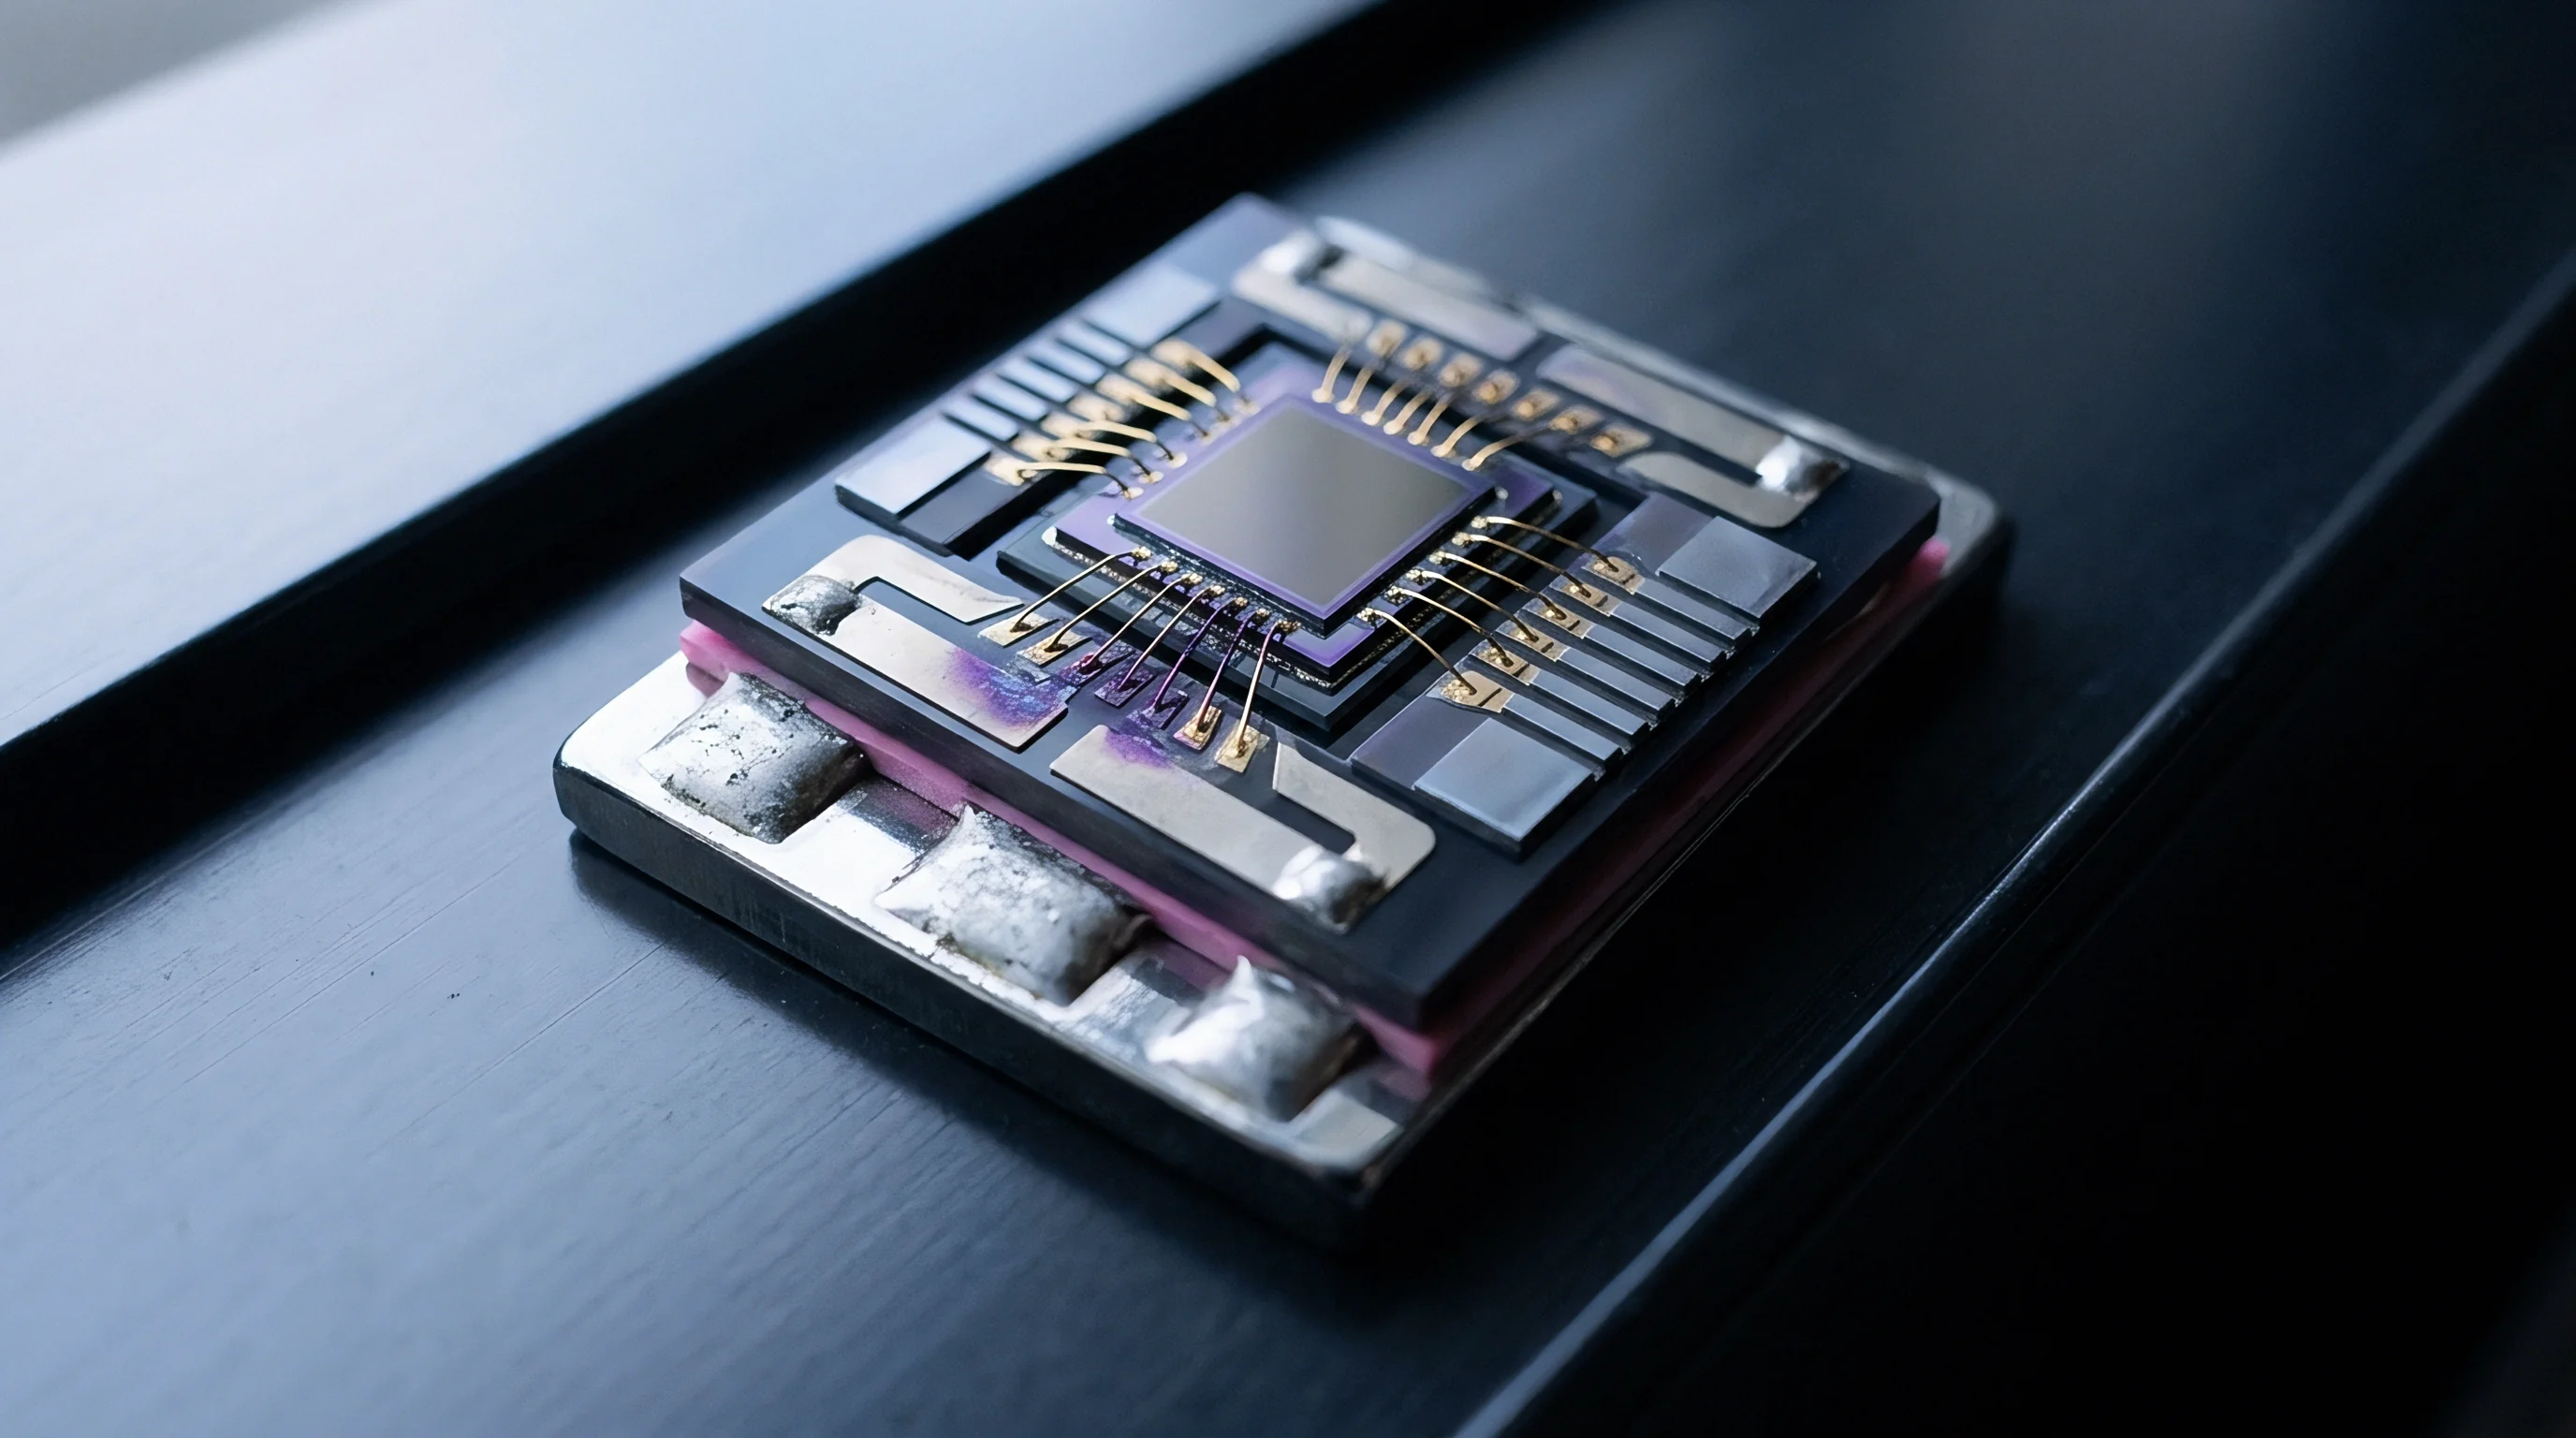
Applying a direct current bias across narrow capacitive gaps introduces a negative mechanical stiffness component that reduces the overall suspension resonant frequency. This phenomenon, termed electrostatic spring softening, arises because electrostatic attractive force increases nonlinearly as the sense gap narrows during displacement. The net effective spring constant equals the open-loop structural mechanical stiffness minus the electrostatic gradient term.
If the applied DC bias voltage exceeds the pull-in stability limit, the negative electrostatic stiffness overcomes the mechanical structural restoring force, causing the suspension to collapse against the static electrode pads.
A three-sigma device layer thickness variation exceeding plus or minus 0.5 micrometers mandates a complete recalibration of the electrostatic softening control loop.
Precise closed-loop control of sub-micron displacements demands continuous compensation for electrostatic spring softening shifts. Variable charge-drive architectures, operating with constant charge rather than constant voltage excitation, eliminate electrostatic spring softening effects by holding total electrode charge fixed during displacement. Preamplifiers connected to charge-drive central anchor suspensions maintain constant closed-loop stiffness profiles, preventing resonant frequency shifts across the entire mechanical operational range.
Unexpected gain shifts can stem from ambient humidity absorption in packaging epoxy or mask misalignment during electrode patterning.

Yield
Commercial viability for sub-micron displacement devices hinges on wafer-level parametric sorting that identifies mechanical cross-coupling prior to packaging. Packaging costs for hermetically sealed MEMS components frequently exceed the fabricated silicon wafer cost. Identifying defective central anchor flexures or non-conforming suspension geometries at the wafer probe station prevents unviable die from entering expensive ceramic packaging lines.
Automated wafer probers perform electrostatic excitation and optical readout across thousands of die per wafer, mapping resonant frequencies, quality factors, and cross-axis response within hours.
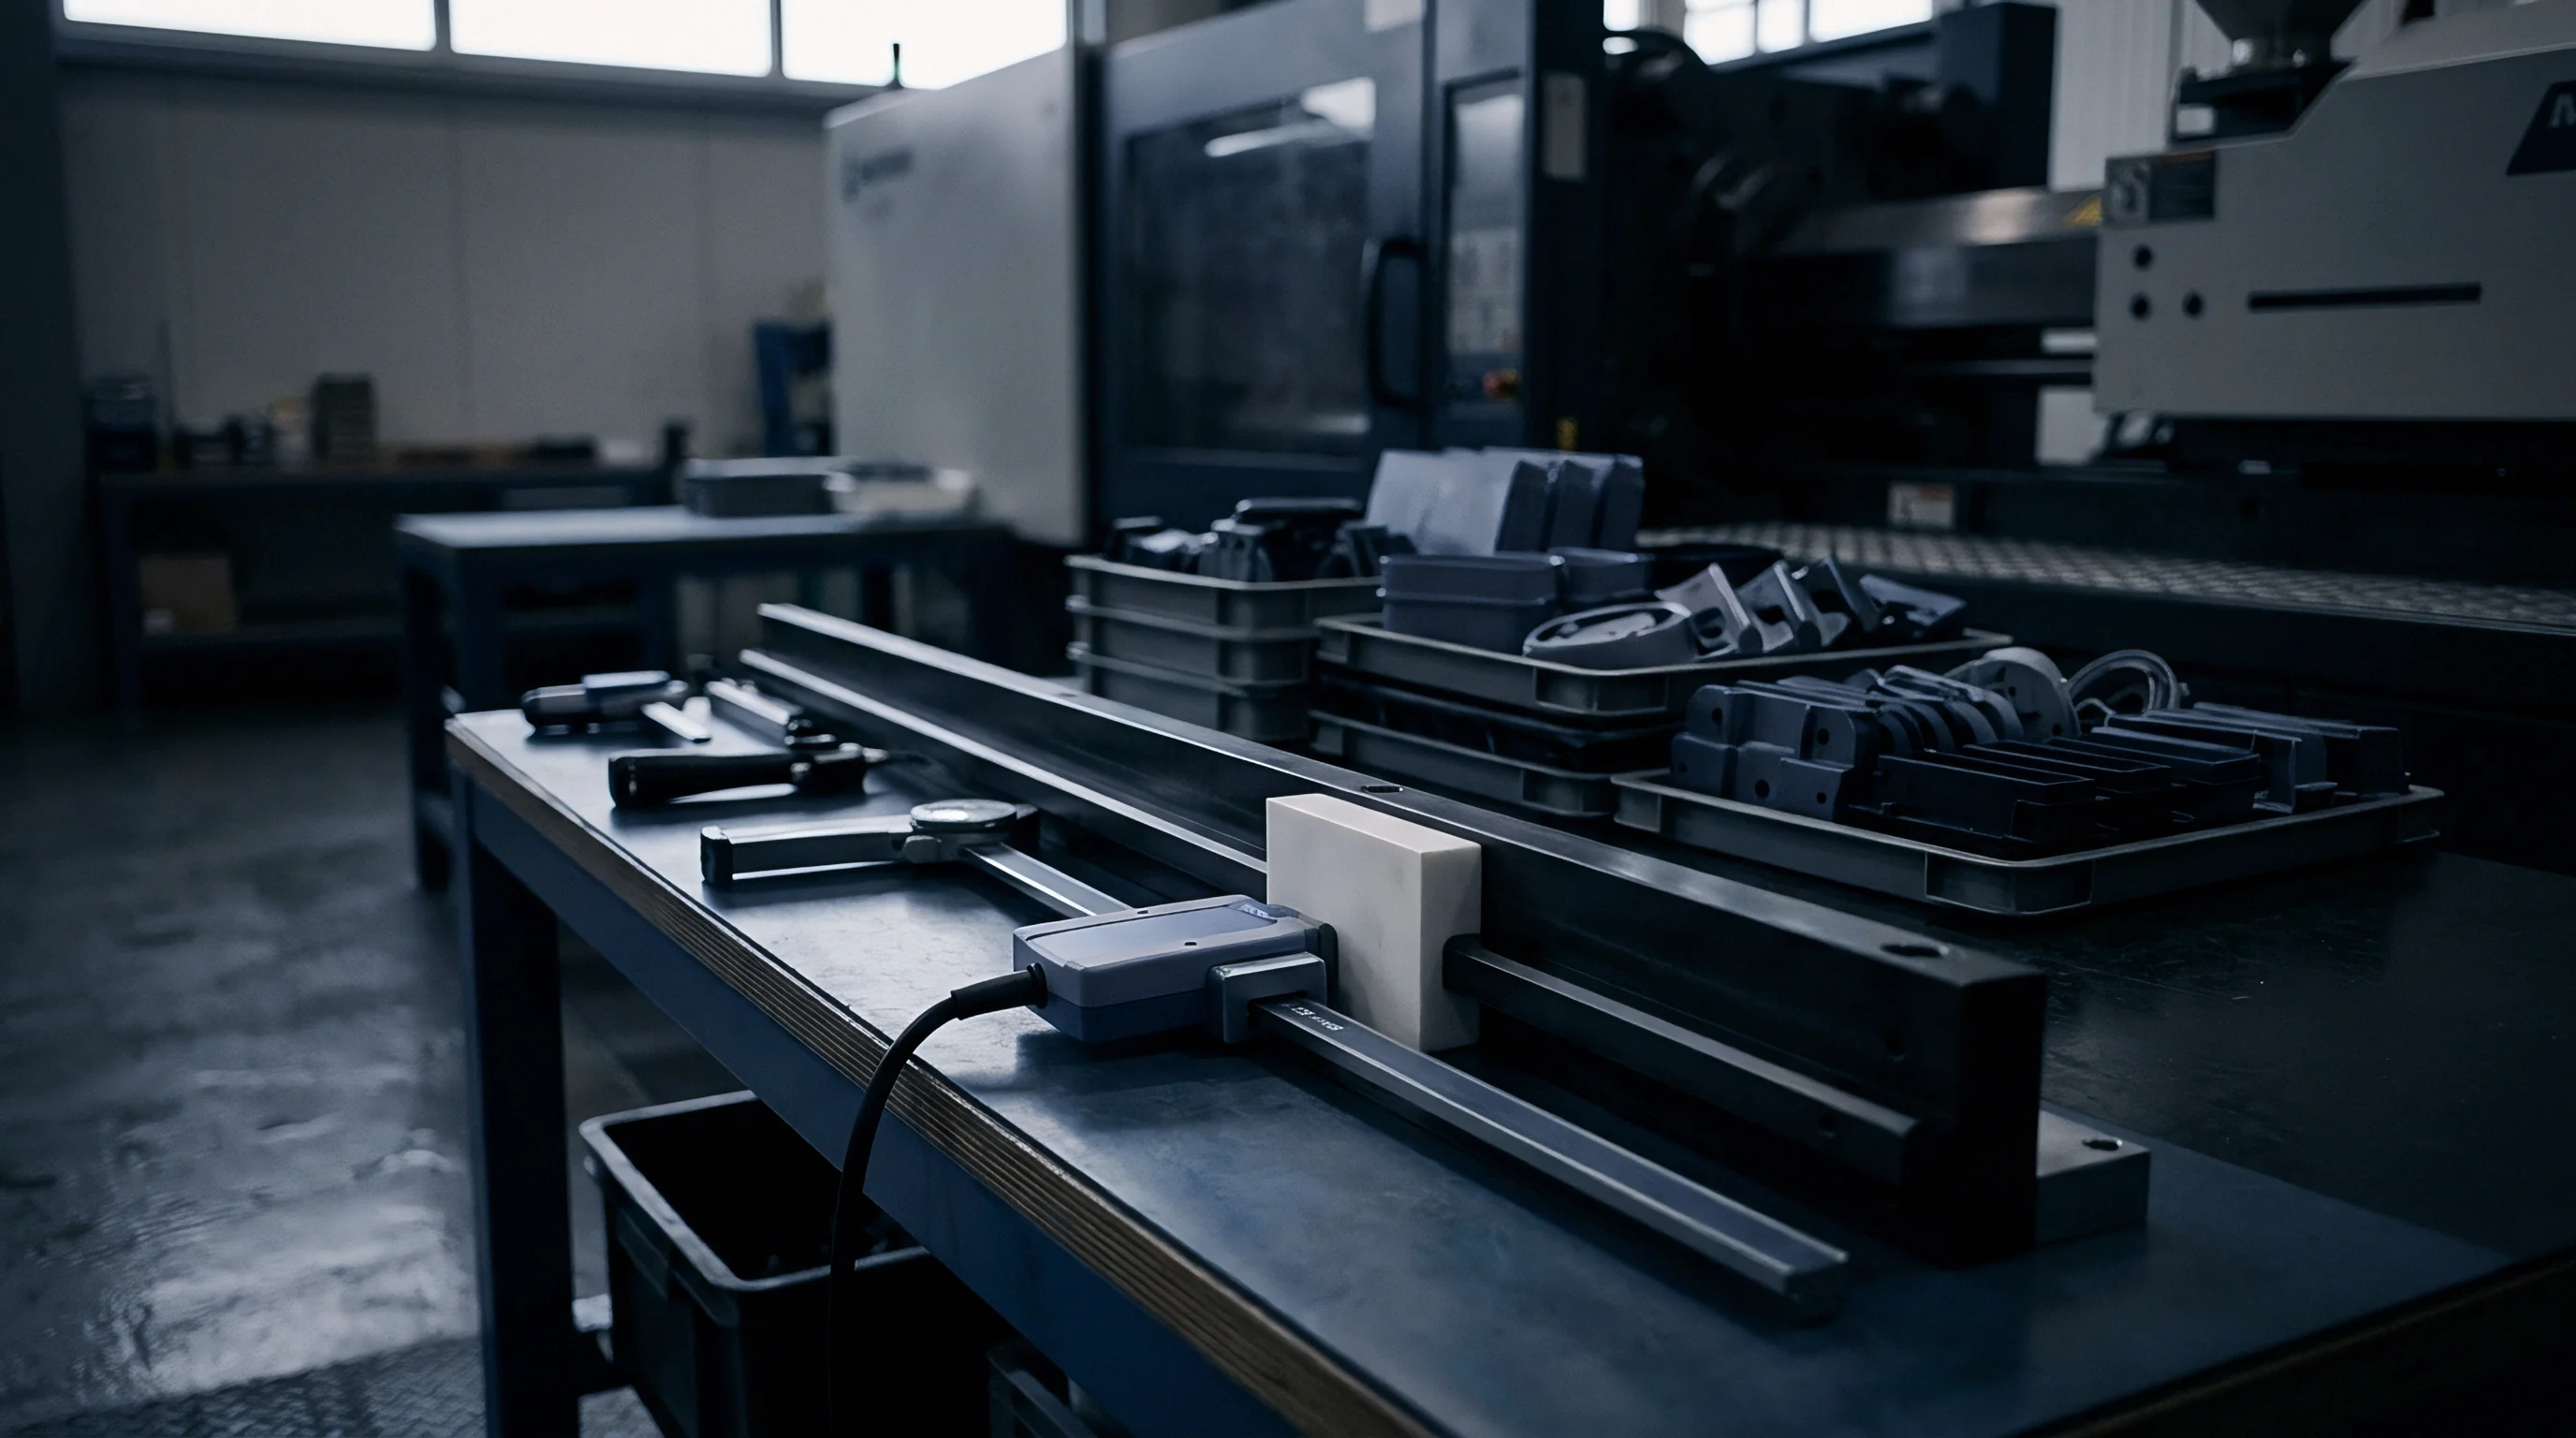
Wafer Level Resonant Testing Protocols
Automated probers evaluate flexure resonance spectra across thousands of die on an unprocessed silicon substrate within minutes. Electrostatic drive pulses applied to integrated test electrodes set the central mass into motion while laser Doppler vibrometry or high-speed capacitive pickoff circuits measure the response spectrum. A non-conforming resonant peak flags physical defect states: a downward frequency shift signals etched beam thinning or excessive oxide release undercut, while an upward frequency shift indicates residual silicon bridges or incomplete release.
Out-of-plane resonant peak amplitudes indicate cross-axis coupling severity directly.
High production volumes make wafer-level sorting essential, while maintaining a high cross-axis stiffness ratio preserves mechanical isolation.
Parasitic out-of-plane cross-coupling increases rapidly when central anchor undercut breaches the inner radius of the primary flexure beam.
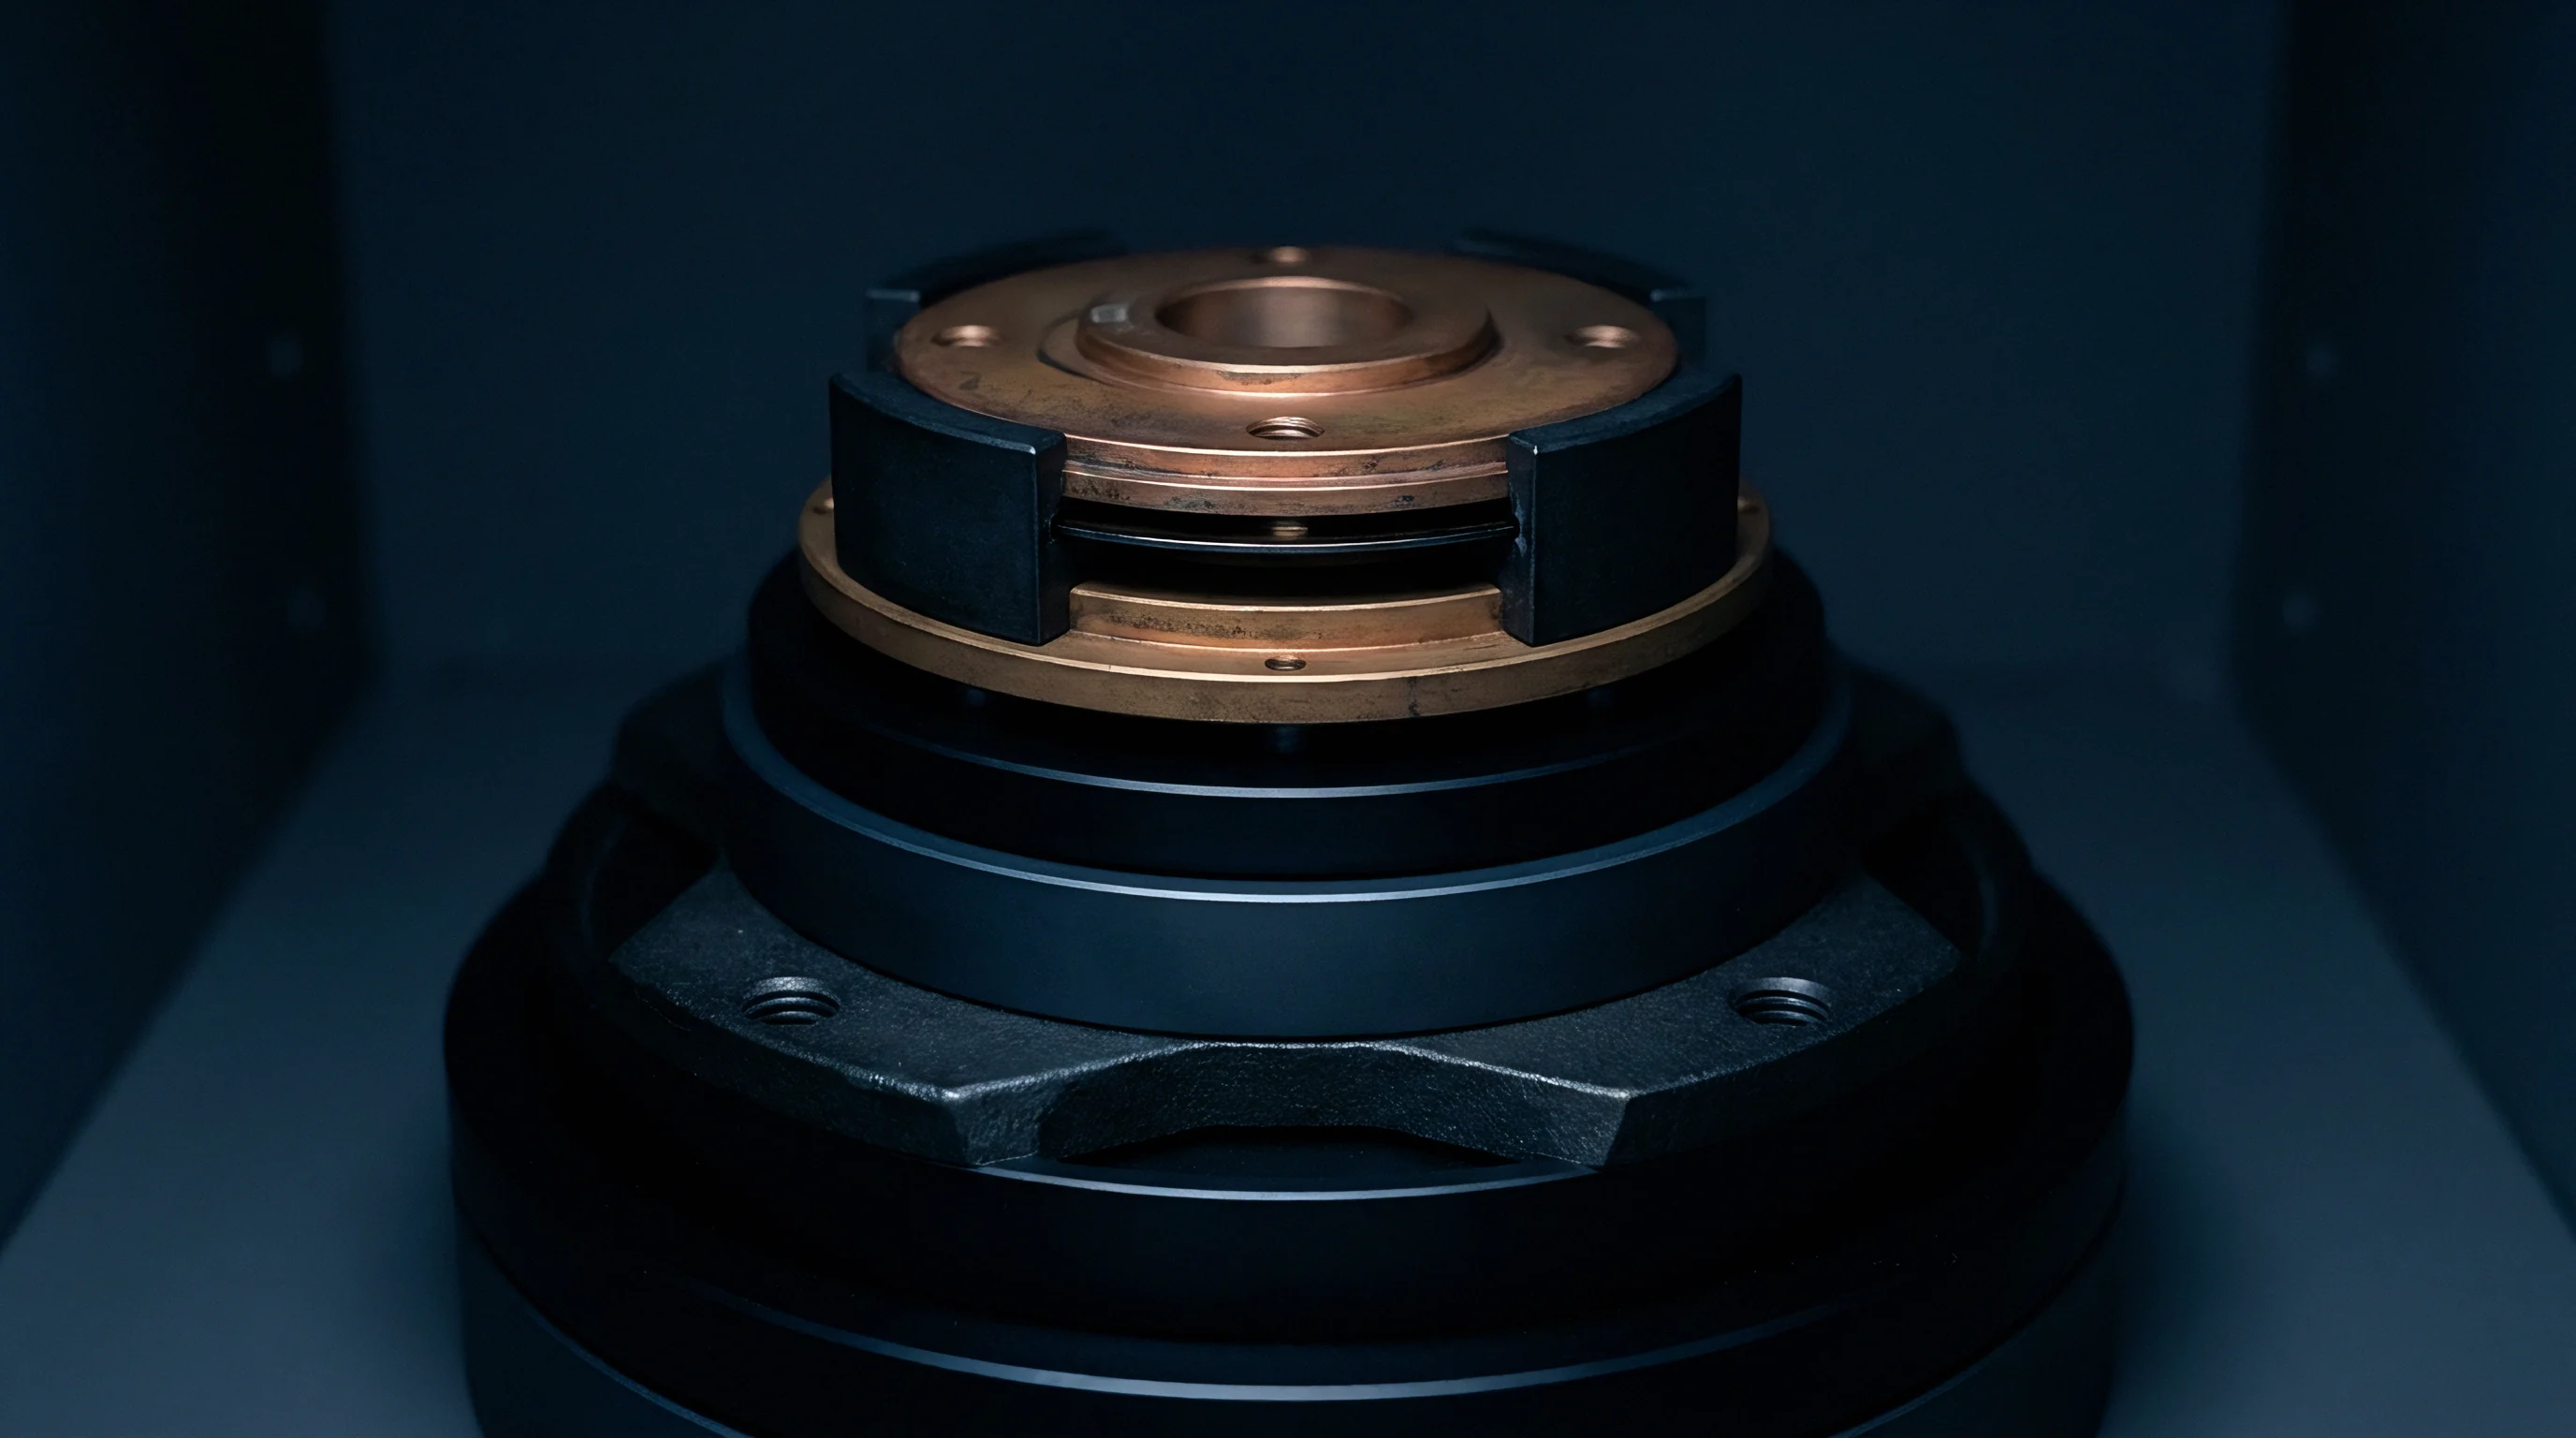
Contractual Tolerance Specifications for Foundries
Procurement agreements for precision micro-machined substrates specify exact allowable variations for device layer thickness and sidewall angle drift. When buying high-aspect-ratio SOI wafers for sub-micron displacement applications, commercial contracts enforce strict statistical process control limits on critical dimensions. Foundries must provide certified critical dimension measurements taken via scanning electron microscopy for every processed wafer lot.
A rigorous foundry specification dossier for central anchor suspensions contains explicit boundary conditions and acceptance thresholds:
- Device Layer Uniformity must remain within plus or minus 0.5 micrometers across a 200-millimeter wafer diameter to guarantee baseline target stiffness.
- DRIE Sidewall Verticality limits maximum allowable sidewall slope deviation to 0.3 degrees from vertical across the total etch depth.
- Buried Oxide Undercut Limits enforce a strict maximum radial undercut distance of 3.0 micrometers beyond the central anchor mask edge.
- Particle Defect Density caps active flexure gap contamination to zero particles larger than 0.3 micrometers per die surface area.
Inserting an automated optical sidewall inspection clause into the silicon-on-insulator foundry agreement shifts the financial liability for modal cross-axis drift back to the wafer fabricator.