Characterizing Dielectric Strain Coupling in Multilayer Ceramic Components
Multilayer ceramic components generate microphonic noise through piezoelectric coupling, manageable via Class I dielectrics or soft terminations.
Lattice
Multilayer ceramic components with high-permittivity Class II dielectrics rely mostly on polycrystalline barium titanate, which spontaneously polarizes below its Curie temperature of 125 degrees Celsius due to its tetragonal crystal structure. Applying mechanical strain to the ceramic displaces titanium ions inside their octahedral oxygen cages, generating an electric field proportional to the mechanical stress tensor. This linear piezoelectric effect acts alongside electrostriction, a second-order response in which mechanical strain scales quadratically with field strength.
Because high-volumetric-efficiency capacitors often keep active dielectric layers under two micrometers thick, internal fields easily surpass ten kilovolts per millimeter. In that regime, the combined piezoelectric coefficient d31 and electrostrictive coefficient M11 dictate how mechanical deformation converts into parasitic voltage across circuit nodes.
Domain Wall Motion under Dynamic Mechanical Load
Polycrystalline ferroelectric ceramics contain microscopic domains of parallel electric dipole moments. External forces on the component package disrupt the thermodynamic balance of these domains. Shear and compressive strains force 90-degree domain walls to shift, turning local polarization vectors toward stress-relieved crystallographic axes.
As these domain walls move, they release bound charge at the internal nickel electrode boundaries, producing a displacement current. Under continuous acoustic vibration, this ongoing domain wall movement generates microphonic noise in sensitive signal paths.
A barium titanate dielectric layer subjected to 1.5 kilovolts per millimeter DC bias exhibits a 68 percent reduction in dynamic piezoelectric strain coefficient d33 at 25 degrees Celsius.
Residual stresses from high-temperature co-firing create permanent, anisotropic strain across the component. As the material cools past the ferroelectric phase transition, differing thermal expansion between internal nickel electrodes and the titanate ceramic generates local clamping forces. These forces pin domain walls near electrode edges while leaving interior regions free to shift.
This spatial variation in domain mobility produces non-uniform strain coupling throughout the dielectric. Formulations like X7R and Y5V use core-shell grain structures to flatten temperature dependence, but the mobile domain cores remain susceptible to strain-induced voltage generation.

DC Bias Saturation and Electrostrictive Realignment
Applying a static DC bias across dielectric layers changes both small-signal capacitance and incremental strain behavior. Strong electric fields align most ferroelectric dipoles parallel to the electrode normal, locking 180-degree domain walls in place. While this bias suppresses linear piezoelectric response by restricting domain wall movement, electrostrictive deformation persists.
Electrostriction squeezes the dielectric layer along its thickness while expanding it laterally, producing structural displacement proportional to the square of the applied voltage.
Small AC signals riding on a substantial DC bias produce amplified strain modulation through electrostrictive mixing. In this mode, effective strain scales with the product of static DC field strength and AC signal amplitude. Circuits operating under high DC bias experience stronger acoustic emission and microphonic coupling because the operating point boosts electrostrictive gain.
When mechanical forces deform a biased component, shifting these pre-aligned dipoles induces larger charge oscillations than would occur without bias.
Low-frequency microphonic interference is often regarded as an inherent trait of high-capacitance ceramic formulations.
Board
Printed circuit boards act as structural amplifiers, passing ambient shock, vibration, and thermal expansion into mounted passive parts. Flexing of the glass-epoxy substrate creates in-plane strain that transmits through solder joints and end terminations into the ceramic element. Because the rigid ceramic body resists bending, stress concentrates around the bottom corners near the end metallization margins.
Strain within the dielectric then generates a charge proportional to the piezoelectric strain tensor d31, converting board flexure directly into noise on signal traces.
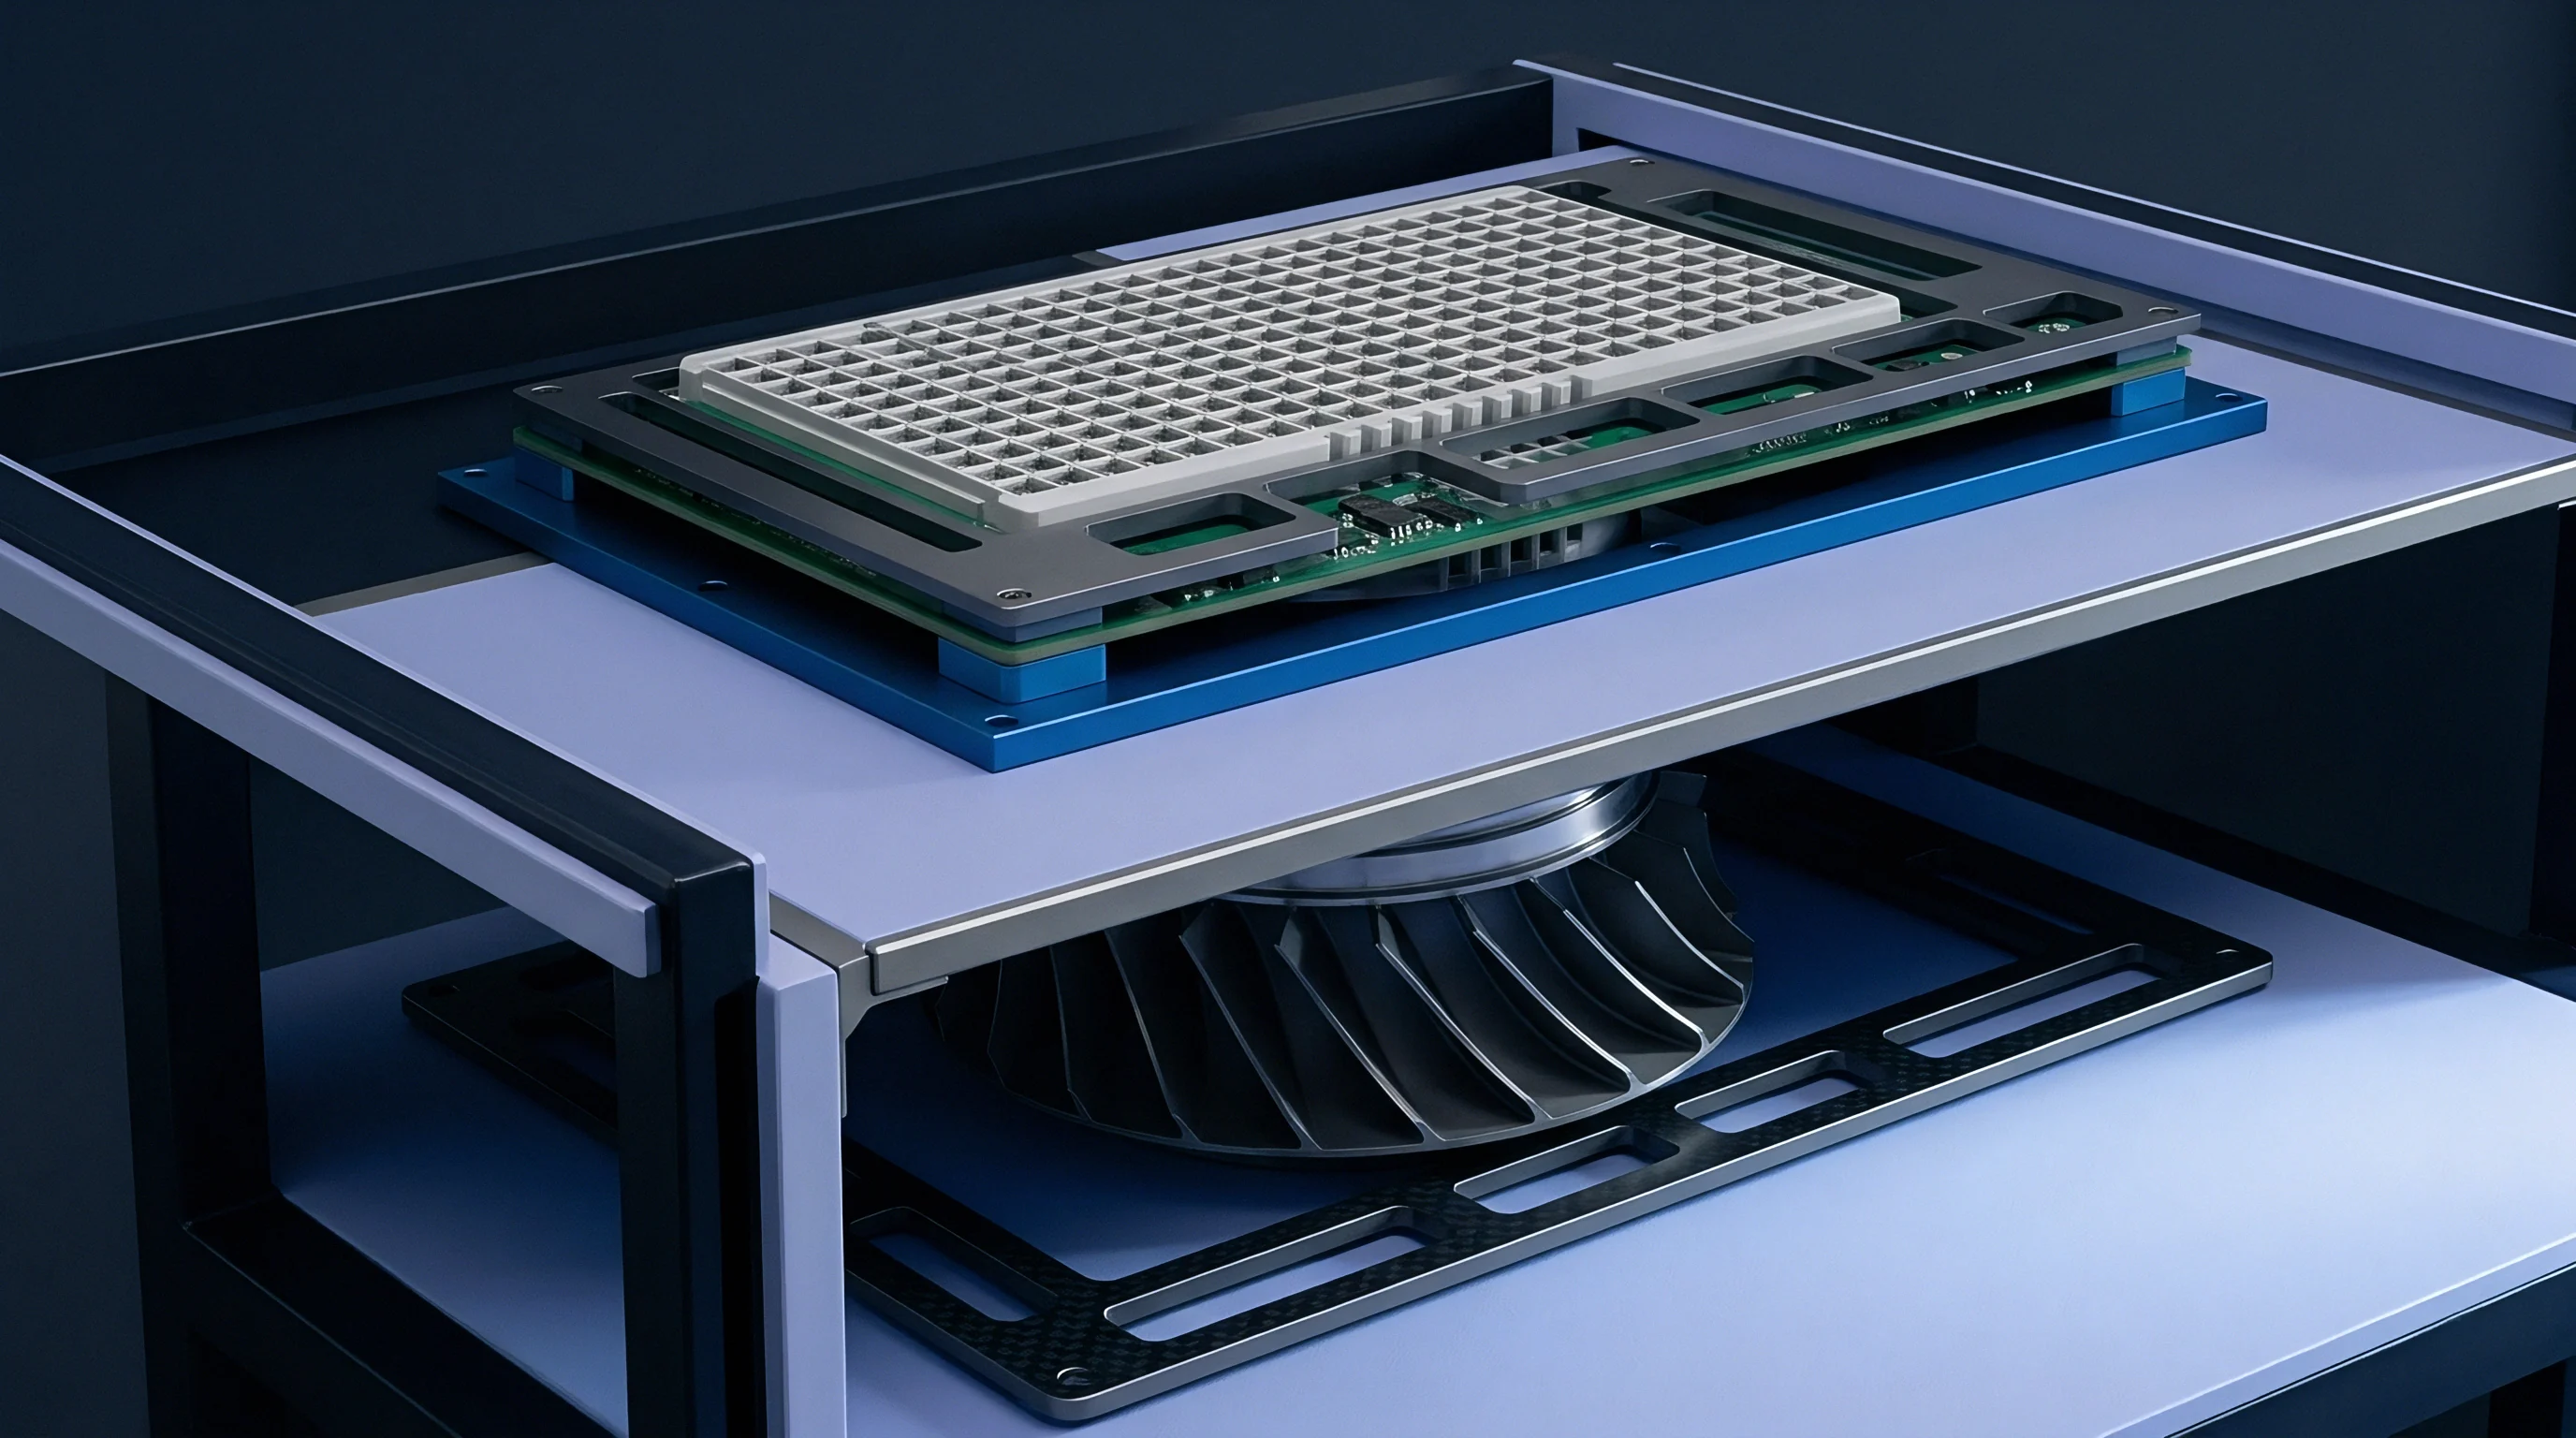
Substrate Flexure and Sub-Terminated Strain Vectors
Flexural stress depends heavily on package dimensions, termination structure, and board orientation relative to bending axes. Bending moments on a 1.6-millimeter FR-4 board induce surface strain that scales with curvature radius; two millimeters of board flexure across a standard span produces roughly 1200 microstrain along the top copper layer. Placing a component where curvature peaks ~ such as next to standoffs or heavy heat sinks ~ translates that strain straight into microphonic voltage spikes.
Component orientation relative to the main strain vector dictates coupling strength. Aligning a capacitor parallel to board flexure lines imposes maximum longitudinal strain along its long axis, generating peak piezoelectric charge across internal electrodes. Rotating the layout by 90 degrees changes the stress state from axial tension to transverse compression, reducing strain transfer to the dielectric by up to 60 percent.
Angling sensitive components 45 degrees relative to breakaway lines also protects them from mechanical shock during board depaneling.
Substrate flexure converts directly into electrical charge within the dielectric material.
| Case Size (EIA) | Termination Type | Substrate Strain (microstrain) | Dielectric Class | Peak Output Voltage (mV/strain) |
|---|---|---|---|---|
| 1206 | Standard Sn/Ni | 1000 | X7R | 4.85 |
| 1206 | Soft Polymer | 1000 | X7R | 1.20 |
| 0805 | Standard Sn/Ni | 1000 | X7R | 2.95 |
| 0805 | Soft Polymer | 1000 | X7R | 0.75 |
| 0603 | Standard Sn/Ni | 1000 | X7R | 1.10 |
| 0402 | Standard Sn/Ni | 1000 | X7R | 0.35 |
| 0805 | Standard Sn/Ni | 1000 | C0G | 0.01 |
Orientation Kinematics across Structural Plane Axes
Solder joint geometry defines the mechanical path between circuit traces and the ceramic body. Oversized solder fillets from wide land patterns expand contact area, forming a stiff bridge that channels board shear stress directly into the ceramic. Trimming land pattern dimensions narrows this path and reduces strain transmission without compromising joint fatigue life.
Soft termination designs add a conductive polymer layer between the nickel barrier and tin plating, forming a compliant pad that deforms elastically to damp incoming strain.
Uncontrolled substrate bending introduces dynamic signal distortion across active circuit traces.
Uncontrolled strain coupling across high-density boards degrades signal processing performance in several distinct ways:
- Microphonic phase jitter degrades phase-locked loop frequency synthesizer stability by modulating voltage-controlled oscillator tuning nodes.
- Low-frequency baseline drift offsets analog-to-digital converter inputs in high-resolution sensor interfaces, destroying precision DC measurement accuracy.
- Spurious acoustic response triggers false interrupt thresholds in low-power wake-up comparator circuits exposed to mechanical impact.
- Transducer cross-sensitivity distorts precision current-sense amplifier readings by adding strain-induced noise onto low-level shunt voltage drop signals.
Failing to account for strain coupling during board layout leads to compromised signal integrity, elevated field failures, and costly board revisions.

Noise
Acoustic waves and physical vibration inside an enclosure trigger mechanical resonances across circuit assemblies, converting movement into electrical noise. High-impedance analog nodes are especially vulnerable: small charges generated by piezoelectric coupling translate into millivolt-level fluctuations. Preamplifiers, charge amplifiers, and high-resolution delta-sigma modulators amplify these microphonic signals right along with the sensor signal.
The resulting noise spectrum matches the structural resonances of the assembly, usually concentrated between 100 Hertz and 20 Kilohertz.

Why Do Soft Termination Formats Alter Piezoelectric Attenuation?
Soft-termination components include a silver-epoxy resin layer within the end metallization stack to soften the mechanical stress path. Because this resin has a lower elastic modulus than the ceramic body or copper traces, it absorbs strain energy through local shear deformation. This compliant boundary acts as an acoustic damper, reducing strain vectors before they reach the ferroelectric barium titanate.
Attenuation improves with frequency, offering strong suppression at higher acoustic frequencies where board flexure modes produce sharp strain peaks.
Under mechanical vibration, unshielded ceramic bodies function much like miniature microphones.
Compliance with AEC-Q200 Board Flex Test Method AEC-Q200-005 mandates a minimum 2 millimeter substrate displacement without ceramic body delamination or capacitance shift exceeding five percent.
Microphonic voltage scales with node impedance as charge current flows through the circuit. Connected to a Class II dielectric component, a high-impedance node forms a low-pass filter governed by node resistance and dielectric capacitance. High impedance prevents displacement charge from bleeding quickly to ground, allowing voltage to accumulate across the terminals.
Reducing node impedance speeds charge dissipation and lowers microphonic amplitude, though usually at the cost of higher power draw or signal attenuation.
| Dielectric Type | Capacitance Value | Node Impedance (kΩ) | Vibration Acceleration (g) | Microphonic RMS Noise (μV) |
|---|---|---|---|---|
| X7R | 100 nF | 1000 | 5.0 at 1 kHz | 385.0 |
| X7R | 100 nF | 10 | 5.0 at 1 kHz | 14.2 |
| X5R | 1 μF | 1000 | 5.0 at 1 kHz | 620.0 |
| X5R | 1 μF | 10 | 5.0 at 1 kHz | 22.5 |
| C0G | 10 nF | 1000 | 5.0 at 1 kHz | 0.05 |
Microphonic Voltage Spikes in High-Impedance Nodes
Charge amplifiers in sensor interfaces experience severe drift when decoupling capacitors flex. Substrate movement drives strain charge directly into the high-gain virtual ground node of the op-amp, generating an output voltage spike equal to the strain charge divided by feedback capacitance. In precision front-ends, sudden mechanical shock creates low-frequency transients that can take hundreds of milliseconds to settle, blinding the measurement system during that window.
Larger capacitance values generate larger peak noise voltages under equivalent mechanical disturbance.
Evaluating how components respond to mechanical strain involves a structured bench setup:
- Mount the target test component onto a standardized four-point bending fixture mounted inside an electrodynamic shaker system.
- Connect the component terminals to a low-noise charge amplifier using shielded coaxial cabling to eliminate triboelectric cable noise.
- Apply a calibrated single-frequency sinusoidal acceleration profile across a frequency range from 20 Hertz to 5 Kilohertz while monitoring mechanical microstrain via an optical strain gauge.
- Record the generated output charge amplitude and compute the effective piezoelectric voltage coefficient under zero DC bias conditions.
- Apply a variable DC bias voltage across the component using a high-voltage bias tee and re-measure charge output to capture electrostrictive gain variations.
- Map output noise amplitude against mechanical strain frequency to establish the acoustic transfer function of the component under test.
As a practical rule of thumb, halving a component’s body length reduces microphonic strain energy coupling by roughly three quarters.

Interferometry
Measuring dielectric strain coupling requires optical tools capable of resolving sub-nanometer surface movement. Laser Doppler Vibrometry detects local surface velocity via the frequency shift of backscattered laser light. Double-beam interferometry isolates dielectric strain from board movement by tracking top-surface displacement and bottom-substrate motion simultaneously.
Combining these optical measurements with dynamic electrical excitation under varying temperature and DC bias yields accurate linear and higher-order strain coupling coefficients.

Laser Doppler Vibrometry for In-Situ Strain Mapping
Laser vibrometry resolves sub-nanometer displacement directly on active component surfaces.
In-situ Doppler mapping of operating components reveals uneven surface displacement caused by internal structural constraints. Out-of-plane expansion peaks at the center of the top face, while unterminated sides exhibit complex lateral strain modes. Internal nickel electrodes turn the ceramic into an anisotropic composite where dielectric layers expand along the thickness axis and induce shear stress against inactive margin zones.
Optical interferometry captures these local gradients, validating finite-element models against physical displacement data.
Coupling dynamic mechanical analyzers with digital LCR bridges allows simultaneous tracking of dielectric loss (tan delta) and strain-induced polarization. Applying cyclic tension while sweeping frequency separates domain wall relaxation from lattice strain. Measuring the phase angle between applied force and resulting charge current distinguishes elastic deformation from hysteretic domain switching.
Hysteretic losses dissipate mechanical energy as heat within the ceramic matrix, raising overall dissipation under strong acoustic excitation.
Increasing substrate ceramic body distance through raised frame geometry suppresses mechanical strain transfer more effectively than altering solder alloy composition.
Capacitive Bridge Phase Detection under Cyclic Flexure
Measuring flexure-induced capacitance changes requires high-resolution AC bridges that can resolve sub-femtofarad shifts during dynamic loading. A four-terminal Kelvin setup minimizes lead impedance and contact resistance changes as the board flexes. Driving the test board with a voice-coil actuator produces controlled sinusoidal strain, while phase-sensitive detection extracts the capacitance shift proportional to strain ~ isolating the sensitivity coefficient dC/d-epsilon from temperature drift.
Characterizing the strain coupling mechanism of an unknown ceramic component follows a clear decision tree:
- Dielectric classification assessment determines whether the component utilizes non-ferroelectric Class I material or domain-active Class II ceramic.
- DC bias voltage dependence testing establishes whether microphonic coupling is dominated by linear piezoelectricity or quadratic electrostriction.
- Substrate flexure isolation screening quantifies the proportion of noise generated by outer termination shear stress compared to internal acoustic excitation.
- Acoustic cavity resonance mapping identifies whether mechanical casing enclosure modes coincide with dielectric resonance peak frequencies.
Consider a characterization scenario where an 0805 X7R 100-nanofarad component undergoes four-point substrate flexure testing under a sinusoidal strain of 500 microstrain at 100 Hertz. The effective piezoelectric strain coefficient d31 for the core barium titanate dielectric measures -220 picocoulombs per Newton, and Young’s modulus is 110 Gigapascals. Mechanical stress in the ceramic layer equals the product of Young’s modulus and strain, yielding 24.2 Megapascals.
Multiplying stress by d31 gives a polarization charge density of 5.32 microcoulombs per square meter. For an active electrode area of 12 square millimeters, peak generated charge reaches 63.8 picocoulombs. On a high-impedance amplifier node with an equivalent resistance of 10 Megohms, this charge current produces an AC noise voltage of 4.01 millivolts ~ three orders of magnitude above the noise floor of a 16-bit analog-to-digital converter.
What specific domain wall relaxation mechanism drives the non-linear phase lag observed between applied mechanical strain and microphonic charge output under high thermal gradients?


Audit
Selecting components for strain-sensitive analog front-ends requires evaluating dielectric chemistry, termination design, and vendor quality controls. Standard datasheets rarely publish microphonic coupling or piezoelectric coefficients, leaving engineering teams to set internal testing standards. Sourcing strategies must weigh the volumetric efficiency of Class II dielectrics against the total mechanical isolation of Class I options.
Second-sourcing requires verifying that grain architecture, dielectric chemistry, and termination construction meet exact strain limits.
Class One Dielectric Isolation and Zero-Piezoelectric Yields
Class I C0G dielectrics contain no ferroelectric domains and generate zero piezoelectric charge coupling under cyclic mechanical load.
Formulations based on neodymium-barium titanate or calcium zirconate remain paraelectric across their entire operating temperature range. With no ferroelectric domains, piezoelectric coupling and electrostrictive conversion vanish, making C0G components immune to board flexure and microphonic noise. They do yield lower volumetric efficiency, requiring larger footprints or lower capacitance.
Even so, placing C0G parts in critical filter stages, VCO tuning nodes, and sensor front-ends removes strain coupling at the material level without added board damping or special terminations.
| Dielectric Formulation | Microphonic Susceptibility | Relative Volumetric Efficiency | DC Bias Voltage Sensitivity | Relative Landed Unit Cost Ratio |
|---|---|---|---|---|
| Class I C0G / NP0 | Zero | 1.0x (Baseline) | Zero shift | 1.00 |
| Class II X7R Standard | High | 12.5x | Moderate shift | 0.35 |
| Class II X7R Soft Term | Low | 12.0x | Moderate shift | 0.55 |
| Class II X5R Standard | Very High | 18.0x | Severe shift | 0.25 |
| Class II X8R High Temp | Moderate | 10.0x | Low shift | 0.65 |
Procurement Dossier Specifications for Strain-Sensitive Applications
Piezoelectric coefficients drop significantly as DC bias increases.
Procurement dossiers for high-reliability systems set explicit strain limits alongside capacitance and voltage ratings. Documentation specifies maximum microphonic charge generation under vibration profiles defined by IEC 60068-2-6. Requiring certified flex test data per AEC-Q200-005 prevents unannounced changes to binder chemistry or sintering profiles that could increase domain mobility and strain sensitivity.
In critical signal nodes, C0G formulations avoid piezoelectric strain coupling entirely.
Soft termination layers absorb mechanical displacement before strain reaches the dielectric core.
Ensuring supply chain security requires testing second-source components under mechanical load. Small differences in grain size, dopant ratios, or calcination temperatures across manufacturing plants alter piezoelectric coupling, even among parts sharing the same EIA designation. Line audits verify that layer thickness uniformity and termination adhesion remain consistent from batch to batch.
A standard procurement specification clause mandates that any alteration to the ceramic dielectric formulation, sintering atmosphere, or inner electrode metallization layout requires formal qualification re-testing under standard AEC-Q200-005 prior to lot acceptance.