Anodic Glass Bonding Residual Stress Mitigation Mechanics
Mitigate anodic bonding residual stress by matching CTE crossover points and cooling at under 1°C/min to prevent sensor zero-point drift.

Anode
Applying a direct current voltage across a silicon-glass pair at elevated temperatures initiates an irreversible solid-state reaction at the interface. Process temperatures ranging from 300°C to 450°C mobilize positive sodium ions within the borosilicate glass matrix. A high DC potential, typically set between 400 V and 1200 V, drives these cations away from the joint line toward the negative electrode attached to the glass backing.
This ion migration creates a thin, highly uncompensated space-charge region directly beneath the silicon surface.
Electrostatic Field Generation and Charge Transport
Thermally activated sodium cations within the borosilicate matrix migrate rapidly toward the negative electrode under high potential differences. The remaining fixed oxygen anions form an uncompensated space-charge region less than one micrometer in thickness. The electric field strength inside this narrow depletion layer exceeds 106 V/cm.
Electrostatic pressure pulls the rigid silicon and softened glass surfaces into atomic contact, initiating covalent silicon-oxygen-silicon chemical bonds across the boundary.
Electric field strength and current decay follow well-defined transport relations. The width of the sodium depletion layer expands according to the following space-charge relationship:
w = sqrtfrac2 εr ε0 Vq Na
In this expression, w is depletion layer thickness, εr represents relative permittivity of the glass, ε0 is vacuum permittivity, V denotes applied voltage, q is elementary charge, and Na indicates sodium ion concentration. The electrostatic attraction force per unit area scales quadratically with field strength:
P = fracεr ε02 left( fracVw right)2
This immense electrostatic pressure forces localized surface asperities to deform plastically. The mechanical squeeze brings oxygen anions into intimate chemical reaction with surface silicon atoms, forming a silica bridge layer. High electrostatic forces pull the substrates together.
They also generate localized shear strain fields at the interface before thermal cooling begins.

Depletion Zone Microstructure Dynamics
Fixed oxygen anions remaining in the boundary layer create a space-charge region less than one micrometer in width. The high field density within this zone induces structural compaction of the glass silica network. Oxygen bridge bonds contract under the intense electrostatic gradient.
Local density increases within the depletion layer produce a permanent volume shrinkage of 0.5% to 1.8% in the glass region adjacent to the silicon surface.
Volume contraction during field application creates localized tensile stress parallel to the interface. This chemical stress component locks into the glass structure prior to furnace shutdown. Mechanical strain generated by ion depletion adds directly to subsequent thermal expansion mismatch strains during cooling cycles.
Cooling rate adjustments through the transformation range alter net substrate curvature more effectively than reducing peak bonding voltage.
Mechanical stress development in the depletion layer depends on total charge transport across the interface. The integrated current density determines total sodium depletion, which maps directly to densification depth:
- Sodium Depletion Compaction volume shrinkage in the glass network generates lateral tensile stresses up to 120 MPa within 500 nm of the joint line.
- Interfacial Oxide Densification field-driven migration of oxygen anions forms a stoichiometric silicon dioxide layer that alters lattice matching parameters.
- Space Charge Electrostatic Trapping residual electric fields remain trapped in dielectric defects after voltage removal, maintaining static mechanical attraction forces.
Foundries frequently attribute zero-point drift to substrate material batch variability rather than addressing electrostatic field strength during the bonding phase.


Expansion
Dimensional variations driven by temperature changes introduce thermo-elastic strain when two distinct materials cool from bonding temperatures. Mismatched expansion rates generate bending moments across the entire wafer assembly. Controlling differential contraction requires matching the temperature-dependent expansion curves of both substrates across the operating range.

Thermal Coefficient Divergence across Process Windows
Single-crystal silicon exhibits a non-linear rate of dimension change that matches borosilicate glass at a single equilibrium point. Above and below this equilibrium temperature, expansion rates diverge. Single-crystal silicon shows a coefficient of thermal expansion ranging from 2.6 × 10⁻⁶ K-1 at room temperature to 3.8 × 10⁻⁶ K-1 at 400°C. Borosilicate glass formulations (such as Corning 7740 or Borofloat 33) exhibit steeper slope variations over the same temperature span.
Equilibrium crossover typically occurs between 280°C and 320°C. Processing above this crossover window causes the glass to shrink faster than silicon during initial cooling, imposing compressive stress on the silicon substrate. Cooling below the crossover point reverses the strain dynamic, generating tensile stress states in the silicon layer.
| Substrate Pair | Bond Temp (°C) | Silicon CTE (K-1) | Glass CTE (K-1) | Net Thermal Strain (με) |
|---|---|---|---|---|
| Silicon / Corning 7740 | 350 | 3.4 × 10⁻⁶ | 3.2 × 10⁻⁶ | +380 |
| Silicon / Borofloat 33 | 400 | 3.6 × 10⁻⁶ | 3.3 × 10⁻⁶ | +520 |
| Silicon / SD-2 Glass | 380 | 3.5 × 10⁻⁶ | 3.5 × 10⁻⁶ | +40 |
| Silicon / Hoya SD-1 | 320 | 3.3 × 10⁻⁶ | 3.2 × 10⁻⁶ | +110 |
How Does Viscous Relaxation Limit Cooling Stress?
Above the glass strain point, molecular rearrangement allows mechanical forces to dissipate rapidly into the fluid matrix. Borofloat 33 features a strain point near 518°C and an annealing point near 560°C. Anodic processing occurs below these temperatures, typically between 350°C and 420°C. At these operational levels, viscous flow is negligible over standard processing timeframes.
Elastic strain accumulation begins immediately upon lowering the system temperature. The total residual stress locked into the dual-layer structure correlates directly with the integrated thermal expansion difference integrated from the bonding temperature down to room ambient:
σth = intTroomTbond fracEg1 – νg left( αs(T) – αg(T) right) dT
In this equation, Eg represents glass Young’s modulus, νg denotes glass Poisson’s ratio, αs(T) is the temperature-dependent silicon expansion rate, and αg(T) is the glass expansion rate. Thermal strain propagates directly into active sensor structures suspended over etched cavities.
Thicker glass substrates shift the neutral mechanical axis away from the joint line, reducing the absolute curvature of the piezoresistive membrane.

Foil
Sputtered thin films placed between the semiconductor and the insulator convert localized surface forces into distributed shear strain. Metal or semiconductor interlayers alter the electrical potential drop while introducing a compliant boundary. Selecting intermediate layer materials with intermediate expansion characteristics reduces interfacial stress peaks.
Intermediate Buffer Layers and Stress Absorption
Depositing a thin layer of amorphous silicon or titanium alters the electric potential drop while providing a mechanical transition zone. Sputtered amorphous silicon interlayers with thicknesses between 100 nm and 500 nm act as electrical conductors during initial voltage bias application. The amorphous film homogenizes space-charge accumulation, eliminating localized high-field stress concentrations caused by glass surface roughness.
Ductile metal interlayers, such as aluminum or titanium foils and thin films, yield plastically under high shear loading. Yielding dissipates elastic energy that would otherwise remain trapped at the silicon-glass interface. Film thickness must stay below 300 nm to prevent complete field screening within the metallic layer, which halts anodic reaction progress.
Adherence to SEMI E10 productivity guidelines caps anneal dwell times, shifting residual stress management onto post-bonding thermal profiling.
Thermal Ramp Rate Profiles and Anneal Steps
Cooling rates below two degrees Celsius per minute prevent steep temperature gradients between the substrate core and its outer edges. Thermal profiling schedules balance residual strain reduction against cycle time costs. Controlled multi-step cooling protocols allow structural relaxation within the glass boundary layer.
- Sputter a 200 nm amorphous silicon interlayer on the polished borosilicate glass surface before thermal processing.
- Heat the mated substrates to 380°C in a vacuum chamber held at 10-4 mbar under a clamping pressure of 0.2 MPa.
- Apply an electrostatic bias of 800 V for twelve minutes until current density drops below 5 mA/cm2.
- Cool the assembly at 1.0°C/min through the transformation zone down to 200°C before venting the chamber.
Substrate bow decreases when thermal ramp rates slow down during the initial 100°C drop from peak processing temperature. Fast cooling rates lock high differential thermal strains into the rigid joint.
Inadequate shear stress buffering results in microscopic interfacial delamination, causing sensor offset drifts that exceed datasheet limits within six months of deployment.

Bench
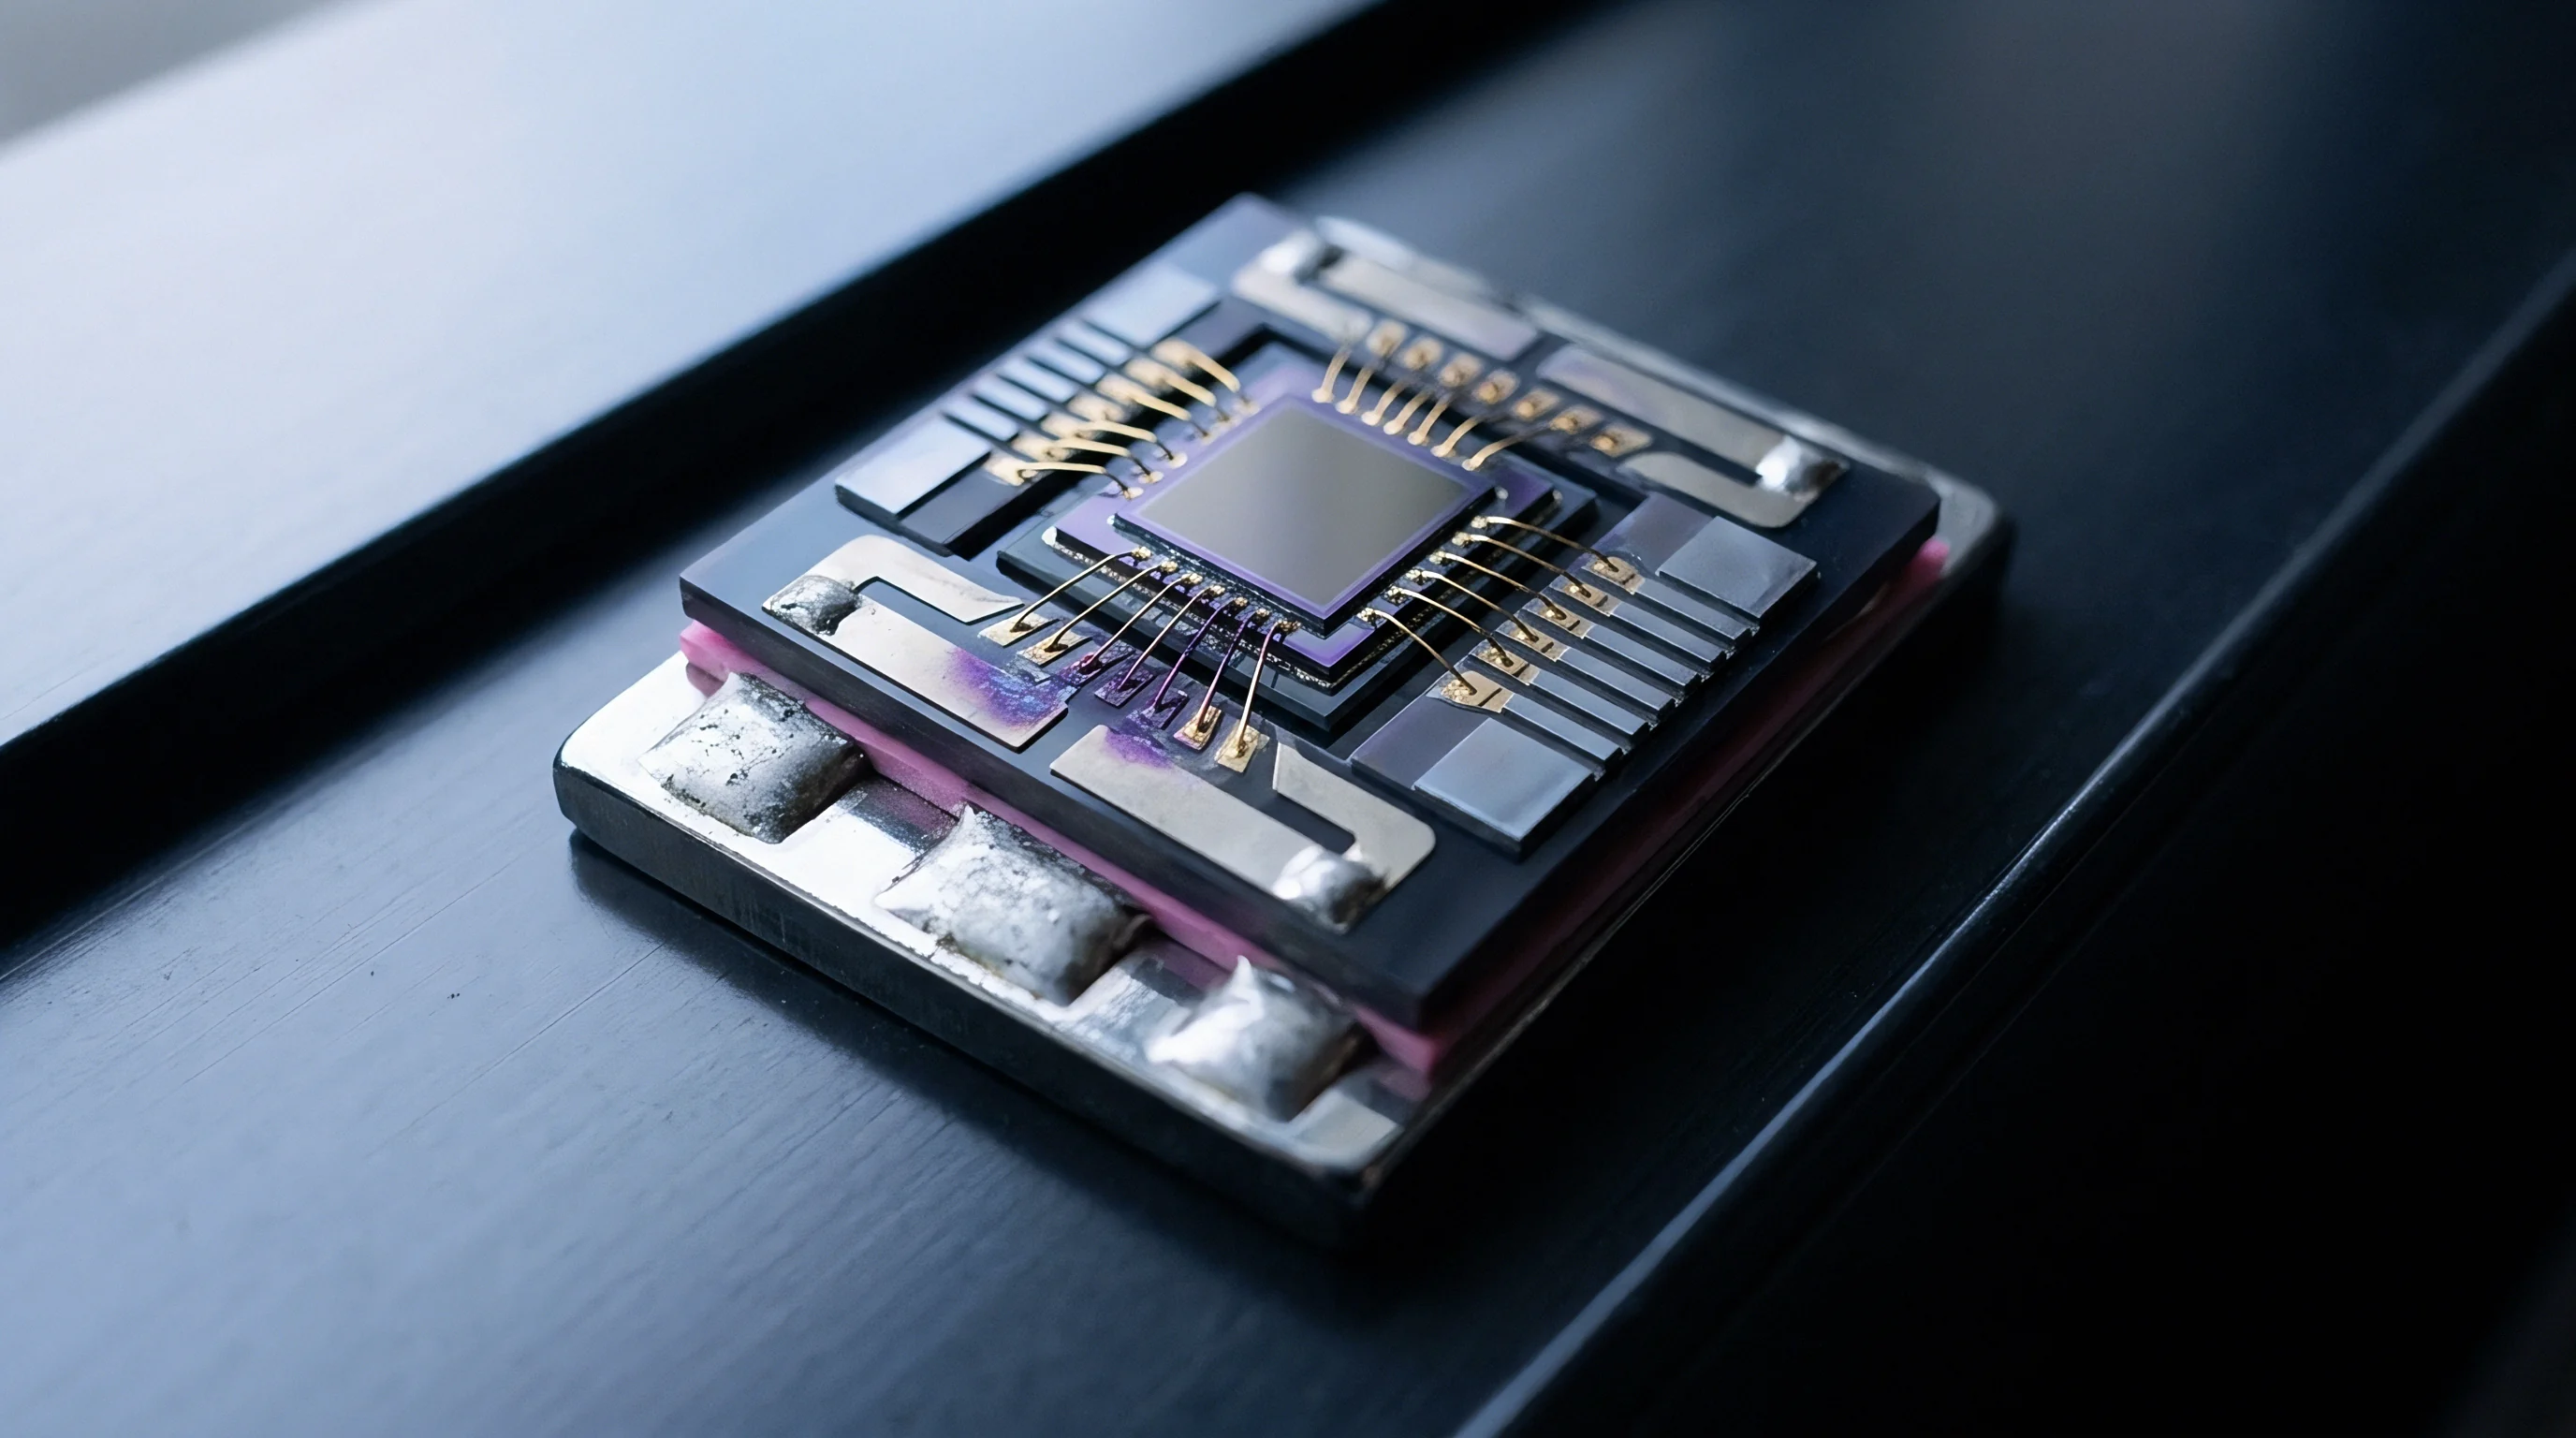
Quantifying structural deformation requires high-resolution optical and spectroscopic measurement protocols across the entire bonded assembly. Standard optical tools track macroscopic wafer bow, while localized spectroscopic equipment isolates micro-scale lattice strain. Metrology steps confirm whether stress mitigation steps achieve target tolerances before wafer dicing.
Wafer Bow Profilometry and Stoney Equation Corrections
Reflected laser beams track surface topography to compute the total radius of curvature across a substrate pair. Wafer bow measurements use optical profilometry to calculate total displacement perpendicular to the reference plane. Converting radius of curvature (R) to interface stress (σ) uses the modified Stoney relation for non-equal substrate thickness:
σ = fracEs hs26 (1 – νs) hg R left
In this expression, hs and hg represent silicon and glass thickness, Es and Eg are Young’s moduli, and νs and νg denote Poisson’s ratios. Standard Stoney approximations fail when glass thickness matches or exceeds silicon thickness. Applying corrected bi-material equations is necessary to prevent stress calculation errors exceeding 30%.
Spectroscopic and Photoelastic Stress Mapping
In-plane lattice compression shifts crystal vibrational modes, enabling non-destructive strain measurement at micrometer resolution. Micro-Raman spectroscopy measures the strain-induced shift of the longitudinal optical phonon mode in single-crystal silicon. The unstressed silicon triple optical phonon peak appears at 520 cm-1.
Stress shifts this spectral peak according to a linear relation:
Δ ω = Π · σ
The piezospectroscopic coefficient Π equals approximately -2.0 cm-1/GPa for uniaxial tensile stress. Micro-Raman mapping resolves stress gradients across MEMS diaphragm anchors down to a spatial resolution of 1.0 μm.
| Metrology Method | Spatial Resolution | Stress Sensitivity | Measured Parameter | Sample Preparation |
|---|---|---|---|---|
| Laser Profilometry | 100 μm | ± 2 MPa | Wafer curvature (R) | None (Full Wafer) |
| Micro-Raman Spectroscopy | 1.0 μm | ± 10 MPa | Phonon shift (Δ ω) | None (Surface exposed) |
| Transmission Photoelasticity | 10 μm | ± 5 MPa | Birefringence (Δ n) | Polished cross-section |
| X-Ray Diffraction (XRD) | 50 μm | ± 1 MPa | Lattice constant (Δ a) | None (Full Wafer) |
Consider a 100 mm diameter silicon wafer of thickness hs = 500 μm bonded to a borosilicate glass substrate of hg = 1000 μm. Taking silicon biaxial modulus Es / (1-νs) = 180.5 GPa, a measured wafer bow δ = 35 μm across scan length L = 80 mm yields radius of curvature R = L2 / (8 δ) = 0.082 / (8 × 35 × 10-6) = 228.57 m. Applying the corrected formula determines average interface shear stress to be 32.9 MPa.
Raman peak shift analysis delivers a spatial stress resolution of 1.2 micrometers when calibrated against a single-crystal silicon reference standard at 22°C.
Photoelastic polariscope measurement verifies in-plane shear stress distributions inside the transparent glass substrate. Polarized light passing through stressed glass splits into orthogonal rays, producing fringe patterns proportional to principal stress differences. Comparing Raman lattice strain maps against photoelastic glass stress maps reveals local shear stress concentrations at cavity corners.
- Laser Topography Profiling tracks total surface displacement vectors across entire wafer surfaces to compute macro-level bending moments.
- Confocal Raman Spectroscopy scans piezoresistive bridge elements to verify localized residual compression below 15 MPa.
- Infrared Photoelastic Birefringence evaluates optical path differences in glass substrates to locate interfacial shear stress peaks.
MIL-STD-883 Method 2011 Clause 3.2 specifies bond shear strength thresholds, compelling assembly plants to reject substrate lots exhibiting residual interface shear stresses above 45 MPa.

Dossier
Commercial viability depends on balancing processing duration against long-term sensor calibration stability. Extended cooling profiles reduce wafer bow, but lengthen cycle times in production equipment. Establishing tight process controls requires understanding how residual stress levels impact sensor drift and final yield metrics.
Yield Economics and Sensitivity Drift Trade-Offs
Extended anneal schedules increase furnace cycle times, reducing daily wafer throughput across production lines. A bonding profile running six hours per run yields four batches per day per chamber. Shortening processing duration to two hours triples chamber output, but raises residual interfacial stress from 25 MPa to 78 MPa.
High residual strain drives long-term zero-point drift in piezoresistive pressure sensors.
Unmitigated residual strain relaxes slowly over extended service periods. Strain relaxation causes zero-point drift in sensitive transducer diaphragms, consuming allowable measurement error budgets within months. The financial loss from field returns and recalibration calls far outweighs savings gained from shorter bond runs.
| Cooling Ramp (°C/min) | Cycle Time (min) | Interface Stress (MPa) | 3-Year Zero Drift (%FS) | Final Yield (%) |
|---|---|---|---|---|
| 0.5 | 360 | 18 | 0.05 | 98.2 |
| 1.0 | 240 | 32 | 0.12 | 96.5 |
| 2.5 | 150 | 58 | 0.38 | 89.1 |
| 5.0 | 90 | 85 | 0.95 | 72.4 |
Acceptance Thresholds for Sensor Diaphragm Offsets
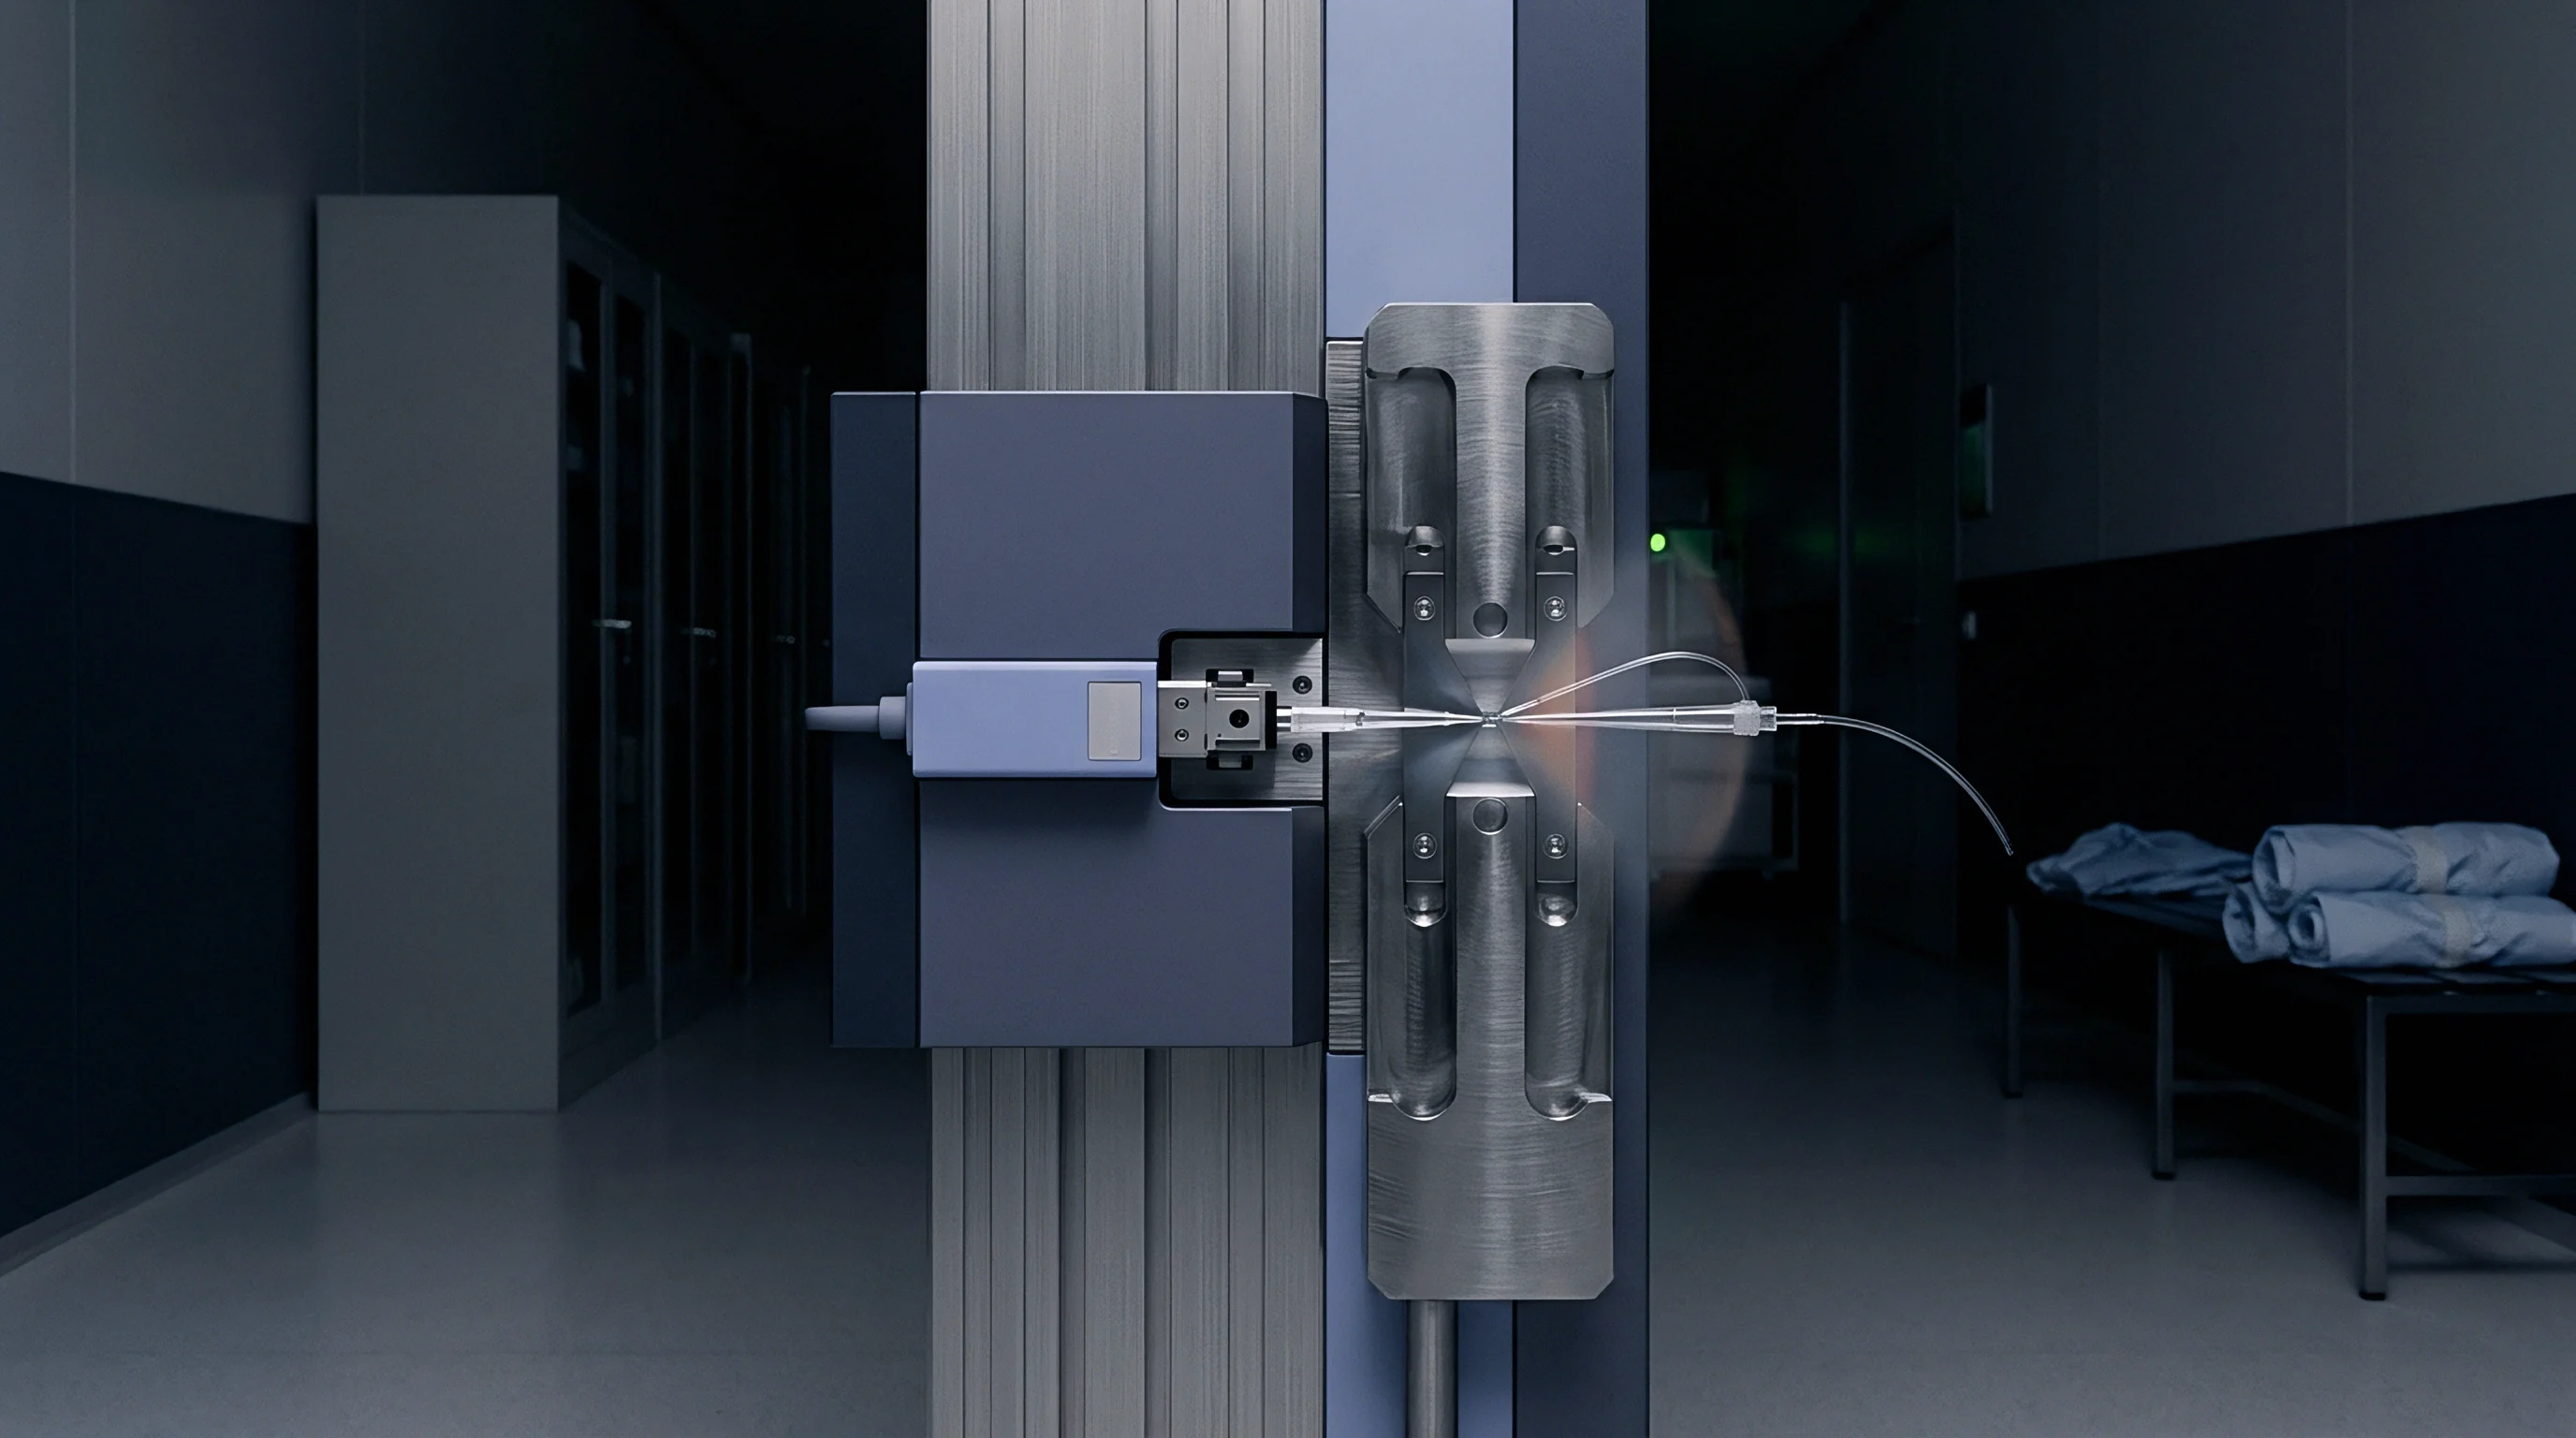
Unmitigated residual forces propagate into piezoresistive bridge structures, causing uncompensated output changes during operational cycling. Residual stress gradients act as a constant mechanical offset on piezoresistive resistors. Thermal cycling accelerates stress relaxation, causing the zero-pressure sensor output to wander over time.
Testing schedules enforce strict acceptance windows for wafer bow before sending bonded wafers to dicing stations. Wafers exhibiting total bow greater than 50 μm across 100 mm diameter substrates suffer high die loss during dicing due to edge chipping and blade binding. Holding residual stress below 30 MPa preserves die yield and holds long-term drift under 0.1% full scale output across three years of field service.
Zero-point thermal drift in pressure transducers correlates directly with the density of unrelaxed alkali depletion layers in the underlying glass.
Whether inline Raman stress mapping can replace destructive thermal shock screening across high-volume MEMS packaging lines remains an open question for quality leads.