Stencil Aperture Area Ratio Calculation for Fine Pitch Ball Grid Arrays
Area ratios above 0.66 secure repeatable solder paste release on fine-pitch arrays, while specialized foil coatings permit acceptable transfer down to 0.50.
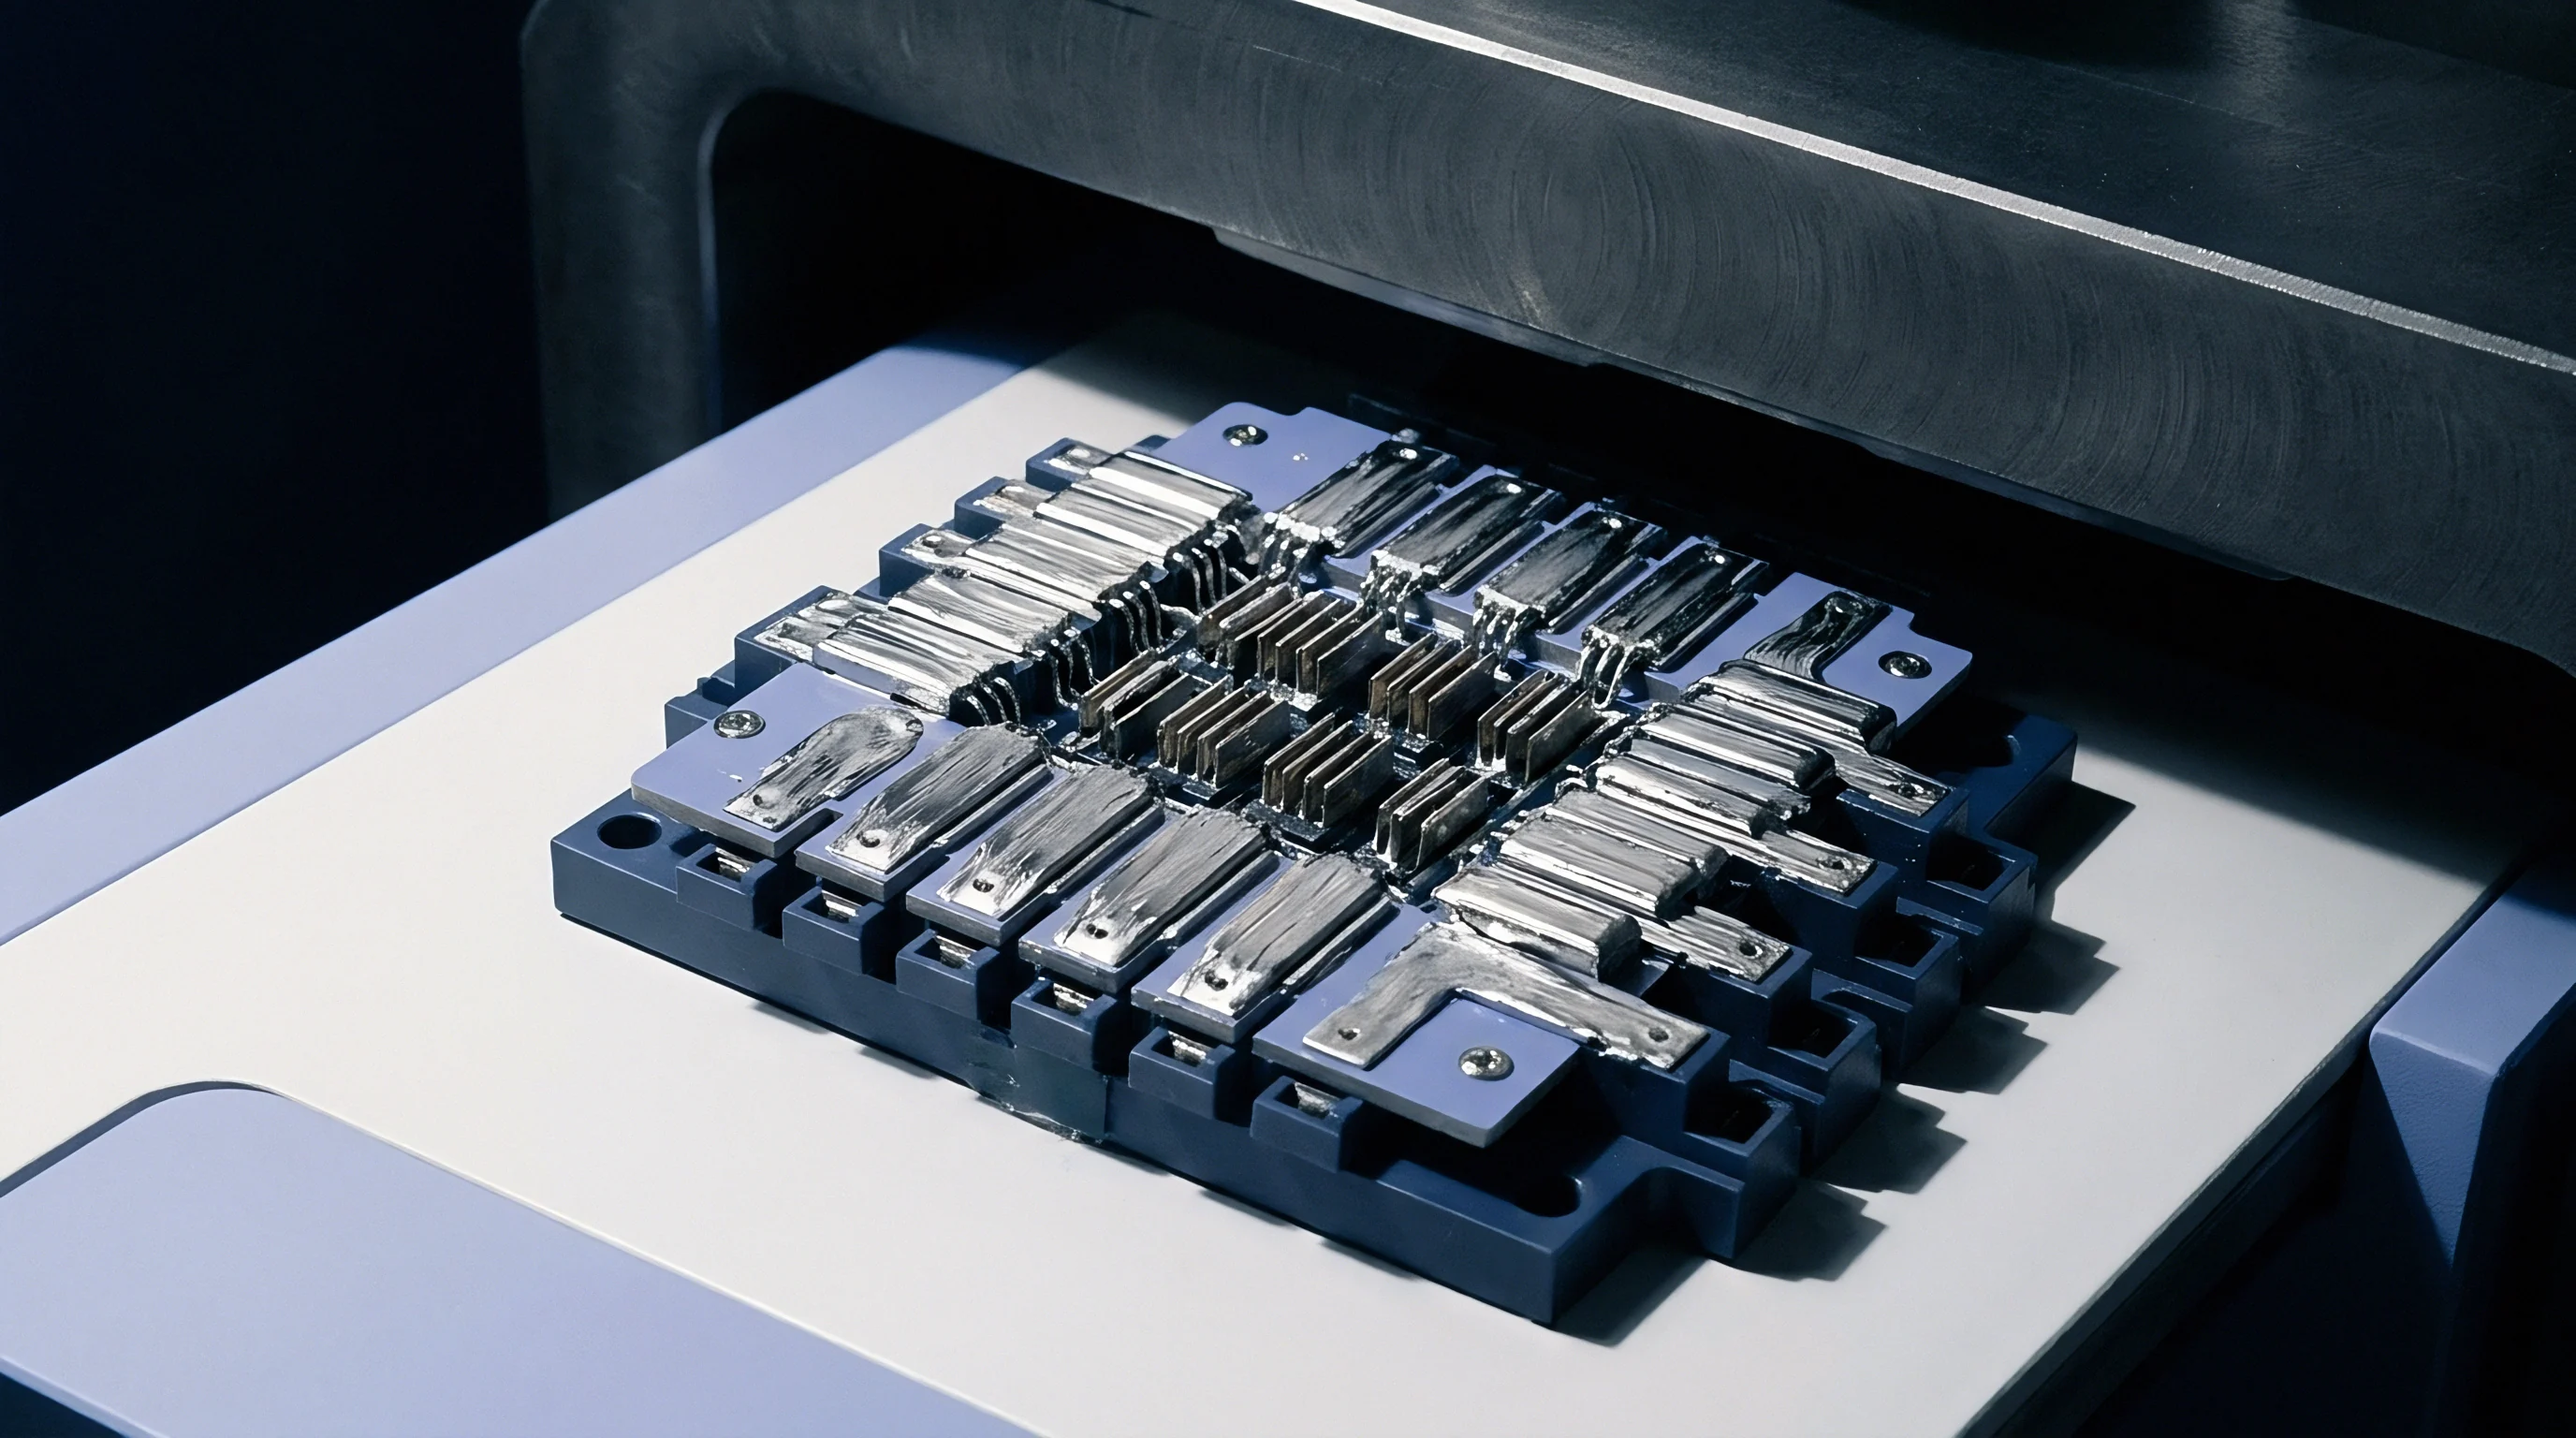
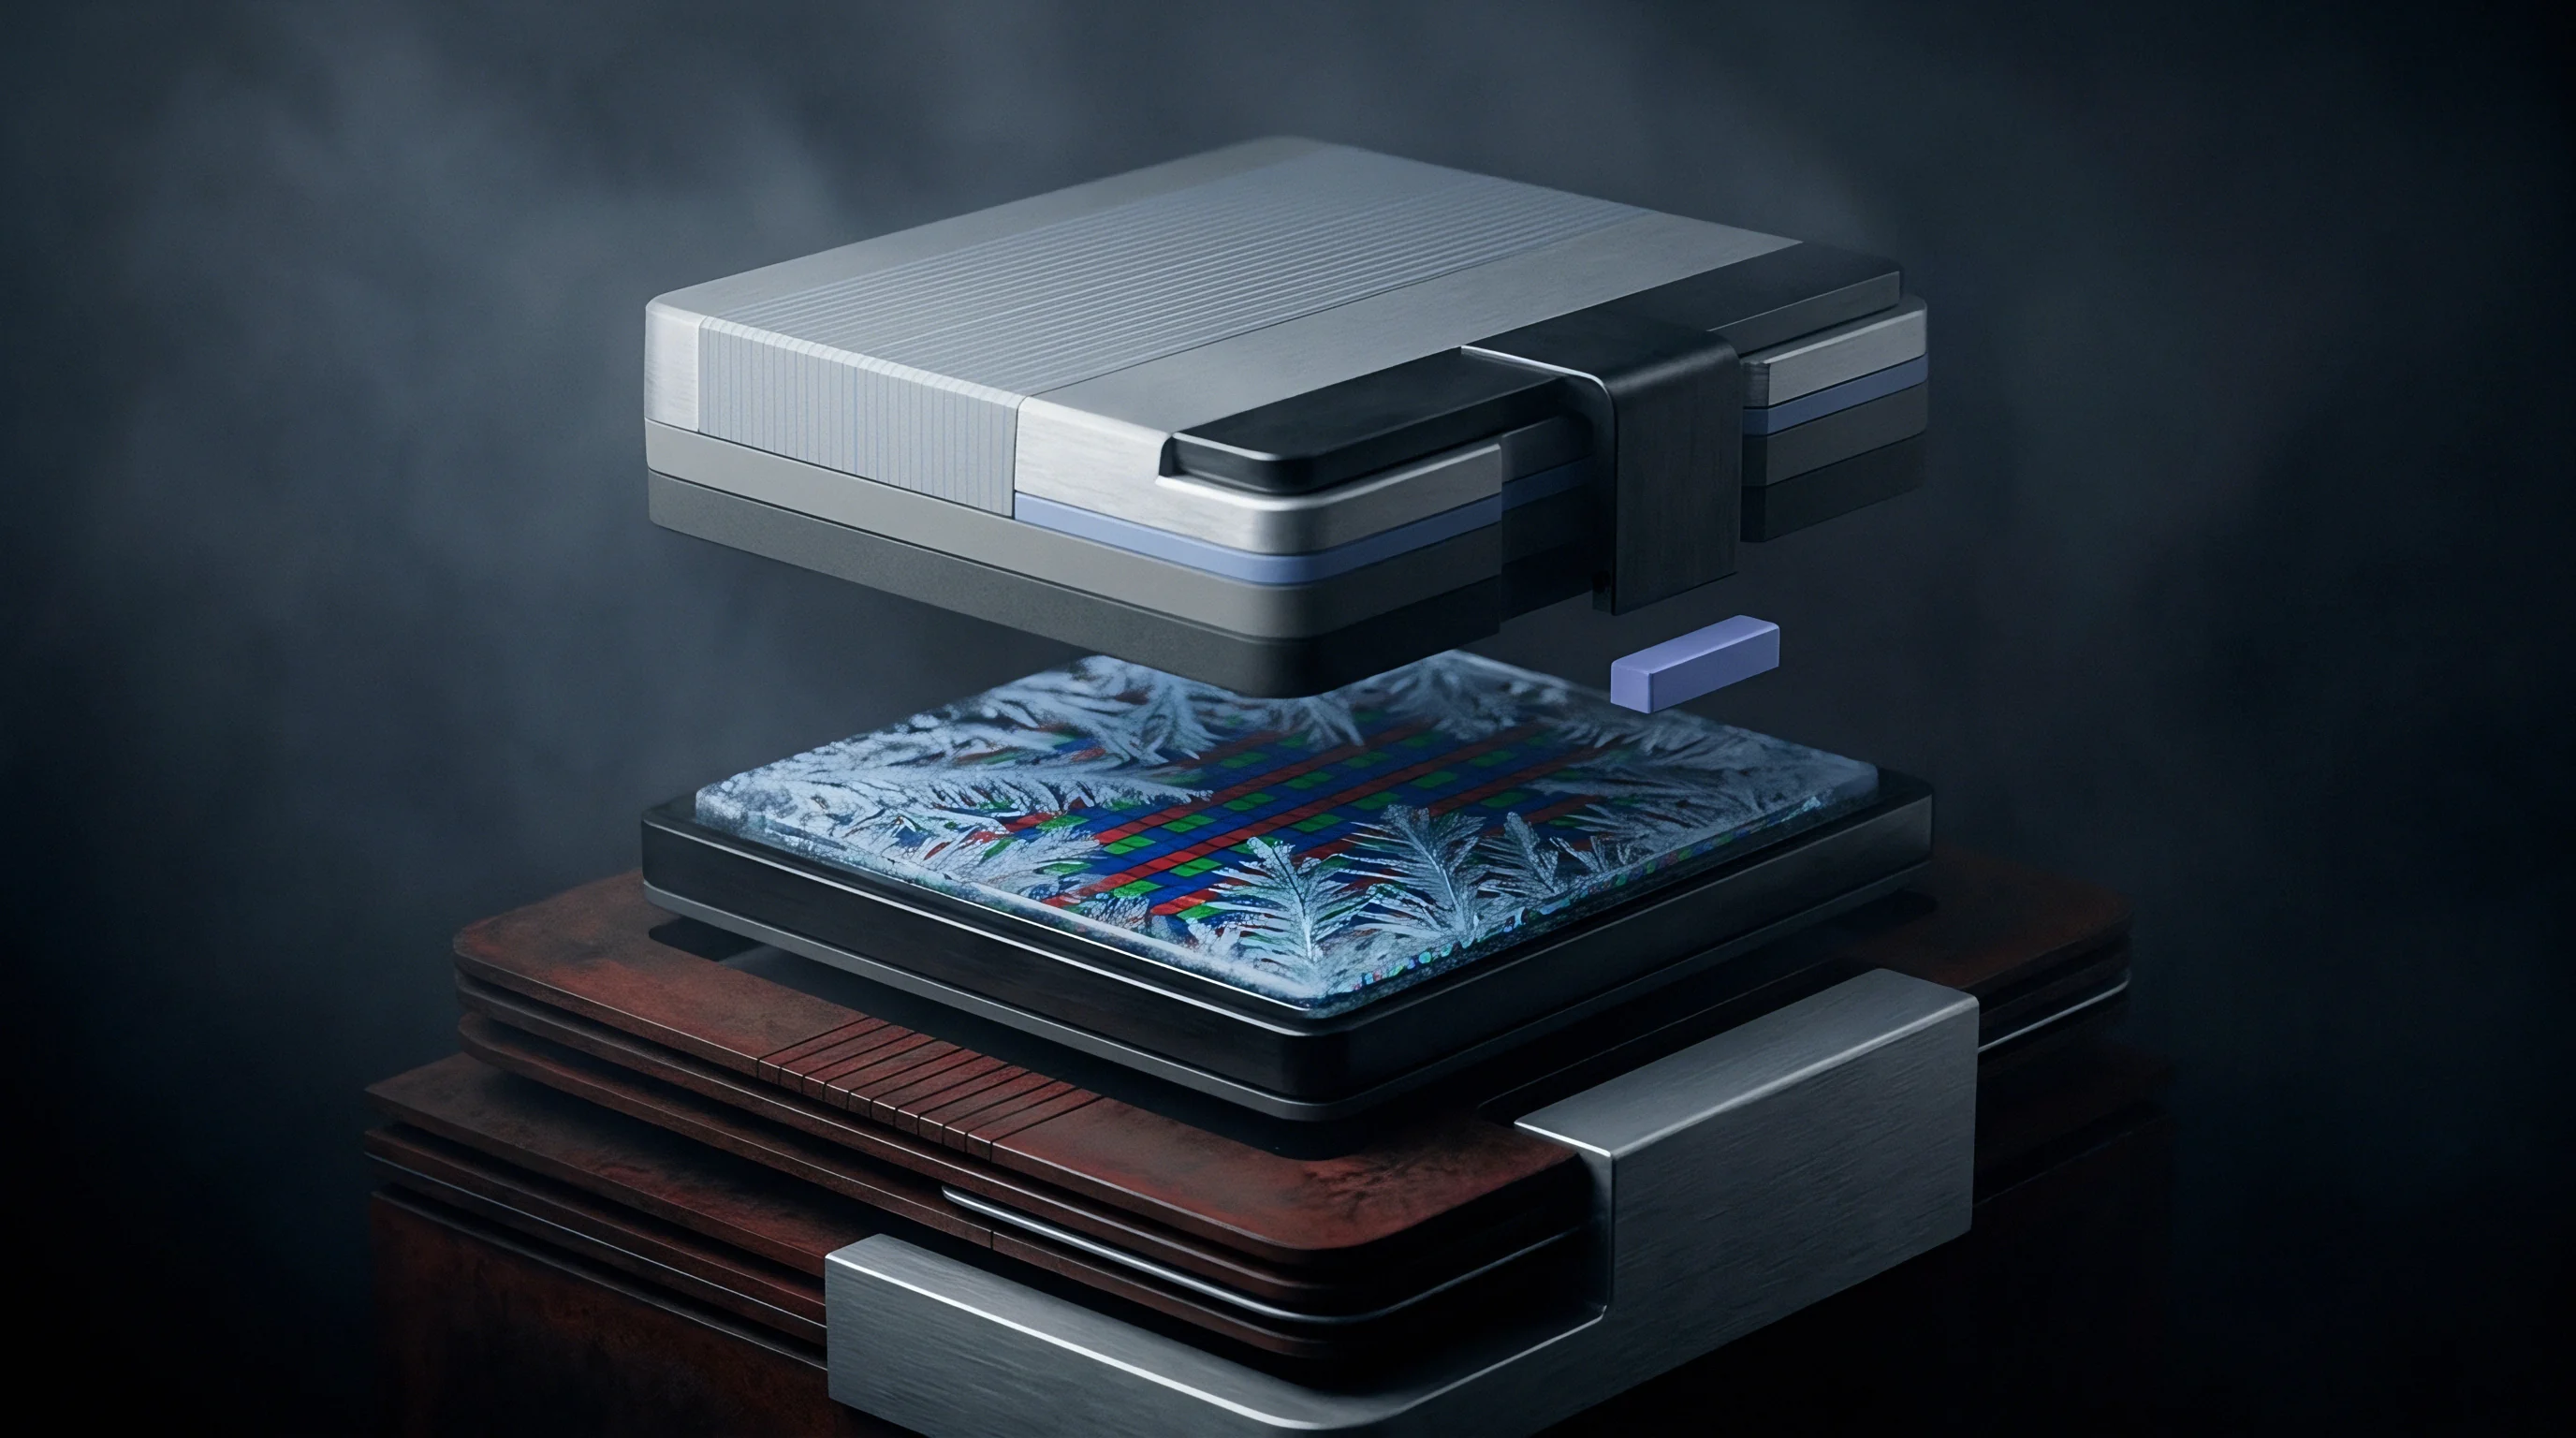
Release
Surface-mount assembly yields for ball grid array packages depend heavily on how cleanly solder paste releases from the stencil. As the squeegee pushes viscous paste across the foil, hydraulic pressure forces it into the open apertures. When the blade passes and the circuit board lowers vertically away from the stencil, two competing surface forces act on the paste trapped inside each cavity.
Adhesion to the copper land pulls the paste downward toward the circuit board, with the paste behaving as a Bingham plastic. At the same time, friction and shear adhesion along the aperture sidewalls resist this release, pulling the paste back toward the foil. A clean deposit forms only when the downward force from the board pad overcomes the upward retention force of the sidewalls.
If sidewall friction dominates, paste remains trapped in the cavity, causing insufficient solder volume, dry joints, or intermittent open connections across the ball grid array.

Mathematical Foundation of Aperture Geometry
During separation, the downward pulling force scales with the area of the pad ~ which matches the aperture opening ~ while the upward retaining force scales with the surface area of the aperture sidewalls. Because of this balance, engineering standards use the area ratio as the primary metric for predicting paste release.
The area ratio is the area of the aperture opening divided by the area of its internal sidewalls. For a circular aperture on a fine pitch ball grid array, the opening area is pi times the diameter squared divided by four, while the sidewall area is pi times the diameter times the foil thickness; simplifying this ratio gives the aperture diameter divided by four times the foil thickness. For a square aperture, where the opening area is the width squared and the sidewall area is four times the width multiplied by the foil thickness, the formula similarly simplifies to the aperture width divided by four times the foil thickness.
Engineers also track the aspect ratio, defined as the aperture width or diameter divided by foil thickness. Historically, IPC-7525 guidelines called for an aspect ratio above 1.5 and an area ratio greater than 0.66 for standard surface-mount components printed through chemically etched or standard laser-cut stainless steel. On fine pitch ball grid arrays with pitches of 0.50 mm, 0.40 mm, and 0.35 mm, geometric constraints push area ratios down toward 0.50, forcing a departure from traditional design rules.
Electroformed nickel foils with smooth aperture walls achieve reliable solder paste release down to an area ratio of 0.55 under standard room temperature printing conditions.
When the calculated area ratio drops below 0.66 on standard laser-cut stainless steel stencils, transfer efficiency ~ the ratio of actual deposited volume to theoretical aperture volume ~ degrades rapidly. At area ratios above 0.70, transfer efficiency holds reliably between 85 percent and 105 percent. Once the ratio falls below 0.60, transfer efficiency drops below 60 percent while variation between prints spikes, preventing clean release.
Apertures that fall below this transfer threshold yield inconsistent paste volumes, which leads to non-wet open joints and latent field fractures after thermal cycling.


Foil
Selecting the right foil thickness sets the volumetric limits for printing, sitting as the primary denominator in the area ratio calculation. When a board layout combines legacy discrete components with fine pitch ball grid arrays, sticking to a single uniform foil thickness forces difficult trade-offs.
Standard 0.80 mm pitch ball grid arrays work well with foils from 100 µm to 125 µm (4.0 mil to 5.0 mil) thick. Their solder balls, typically 0.40 mm to 0.45 mm in diameter, land on pads measuring 0.35 mm to 0.40 mm across. On a 100 µm foil, that yields an area ratio of 0.87 to 1.00 ~ comfortably above the IPC-7525 baseline.
Placing a 0.40 mm pitch array on the same board disrupts this completely. Those packages use nominal 0.25 mm solder balls on 0.20 mm to 0.22 mm lands; printing a 0.20 mm circular aperture through that same 100 µm foil drops the area ratio to 0.50, causing standard stainless steel stencils to clog immediately.

Step-Down Stencils for Mixed Component Placement
Multi-thickness stencils solve this problem on boards carrying both power stages and micro-pitch packages. By chemically etching or micro-milling local pockets on either the board or squeegee side of the foil, step-down stencils thin the area around the fine pitch ball grid array to 75 µm or 50 µm (3.0 mil or 2.0 mil) while maintaining 100 µm to 125 µm across the rest of the board.
Stepped foils require strict keep-out zones because flexible squeegee blades cannot adapt instantly to recessed surfaces as they pass over a step edge. Standard guidelines specify a minimum transition distance of 0.60 mm to 0.90 mm for every 25 µm of step depth. Encroaching on this keep-out zone leaves unprinted flux residue and skimpy paste deposits along the edge of the pocket as pressure forces paste into the corners.
Should Stencil Thickness Drop below Three Mils?
Thinning the foil too much creates mechanical risk over repeated wipe cycles. Dropping to 50 µm (2.0 mil) raises the area ratio of a 0.20 mm aperture to 1.00, but it slashes the overall deposit volume across the footprint. That reduced volume often fails to maintain sufficient mechanical standoff height beneath large silicon dies.
If a substrate warps even slightly during reflow, pulling the outer balls upward, insufficient paste volume will fail to span the vertical gap, leading to head-in-pillow defects. Choosing a foil thickness is always a compromise between meeting area ratio thresholds and depositing enough solder volume.
- Component warpage budget defines the required paste volume to bridge coplanarity variations across package corners during thermal reflow.
- Squeegee blade compliance determines the minimum spacing between stepped pockets and fine pitch aperture arrays to avoid paste scooping.
- Solder powder particle size matches aperture width to prevent physical particle jamming across the aperture throat during the print stroke.
- Mechanical foil tension maintains planar stencil contact against the board to prevent paste bleeding under high print pressures.
| Ball Pitch (mm) | Nominal Pad Diameter (mm) | Stencil Foil Thickness (µm / mil) | Calculated Area Ratio | Solder Powder Type | Expected Transfer Efficiency (%) |
|---|---|---|---|---|---|
| 0.50 | 0.28 | 100 / 3.94 | 0.70 | Type 4 | 88 to 94 |
| 0.50 | 0.28 | 75 / 2.95 | 0.93 | Type 4 | 95 to 102 |
| 0.40 | 0.22 | 100 / 3.94 | 0.55 | Type 4 | 52 to 68 |
| 0.40 | 0.22 | 75 / 2.95 | 0.73 | Type 4 or Type 5 | 85 to 92 |
| 0.40 | 0.22 | 50 / 1.97 | 1.10 | Type 5 | 96 to 104 |
| 0.35 | 0.18 | 75 / 2.95 | 0.60 | Type 5 | 65 to 74 |
| 0.35 | 0.18 | 50 / 1.97 | 0.90 | Type 5 | 88 to 95 |
| 0.30 | 0.15 | 50 / 1.97 | 0.75 | Type 6 | 80 to 88 |
| Data measured using SAC303 halogen-free no-clean solder paste printed at 50 mm/s squeegee speed under 0.18 kg/cm blade pressure. | |||||
Selecting thinner metal protects fine pitch prints, but it risks starving adjacent power inductors of the solder volume they need for reliable joints.

Wall
As geometric ratios approach critical limits, aperture wall smoothness dictates transfer efficiency. Solder paste mechanically locks into rough surface microstructures; if the interior sidewalls carry deep striations, burrs, or tooling marks, frictional drag increases sharply during stencil lift-off.
Chemical etching leaves an hourglass cross section with rough knife-edges along the centerline ~ a profile poorly suited to fine pitch ball grid arrays. Modern micro-pitch stencils instead rely on laser cutting or additive electroforming to form smooth, uniform vertical walls.
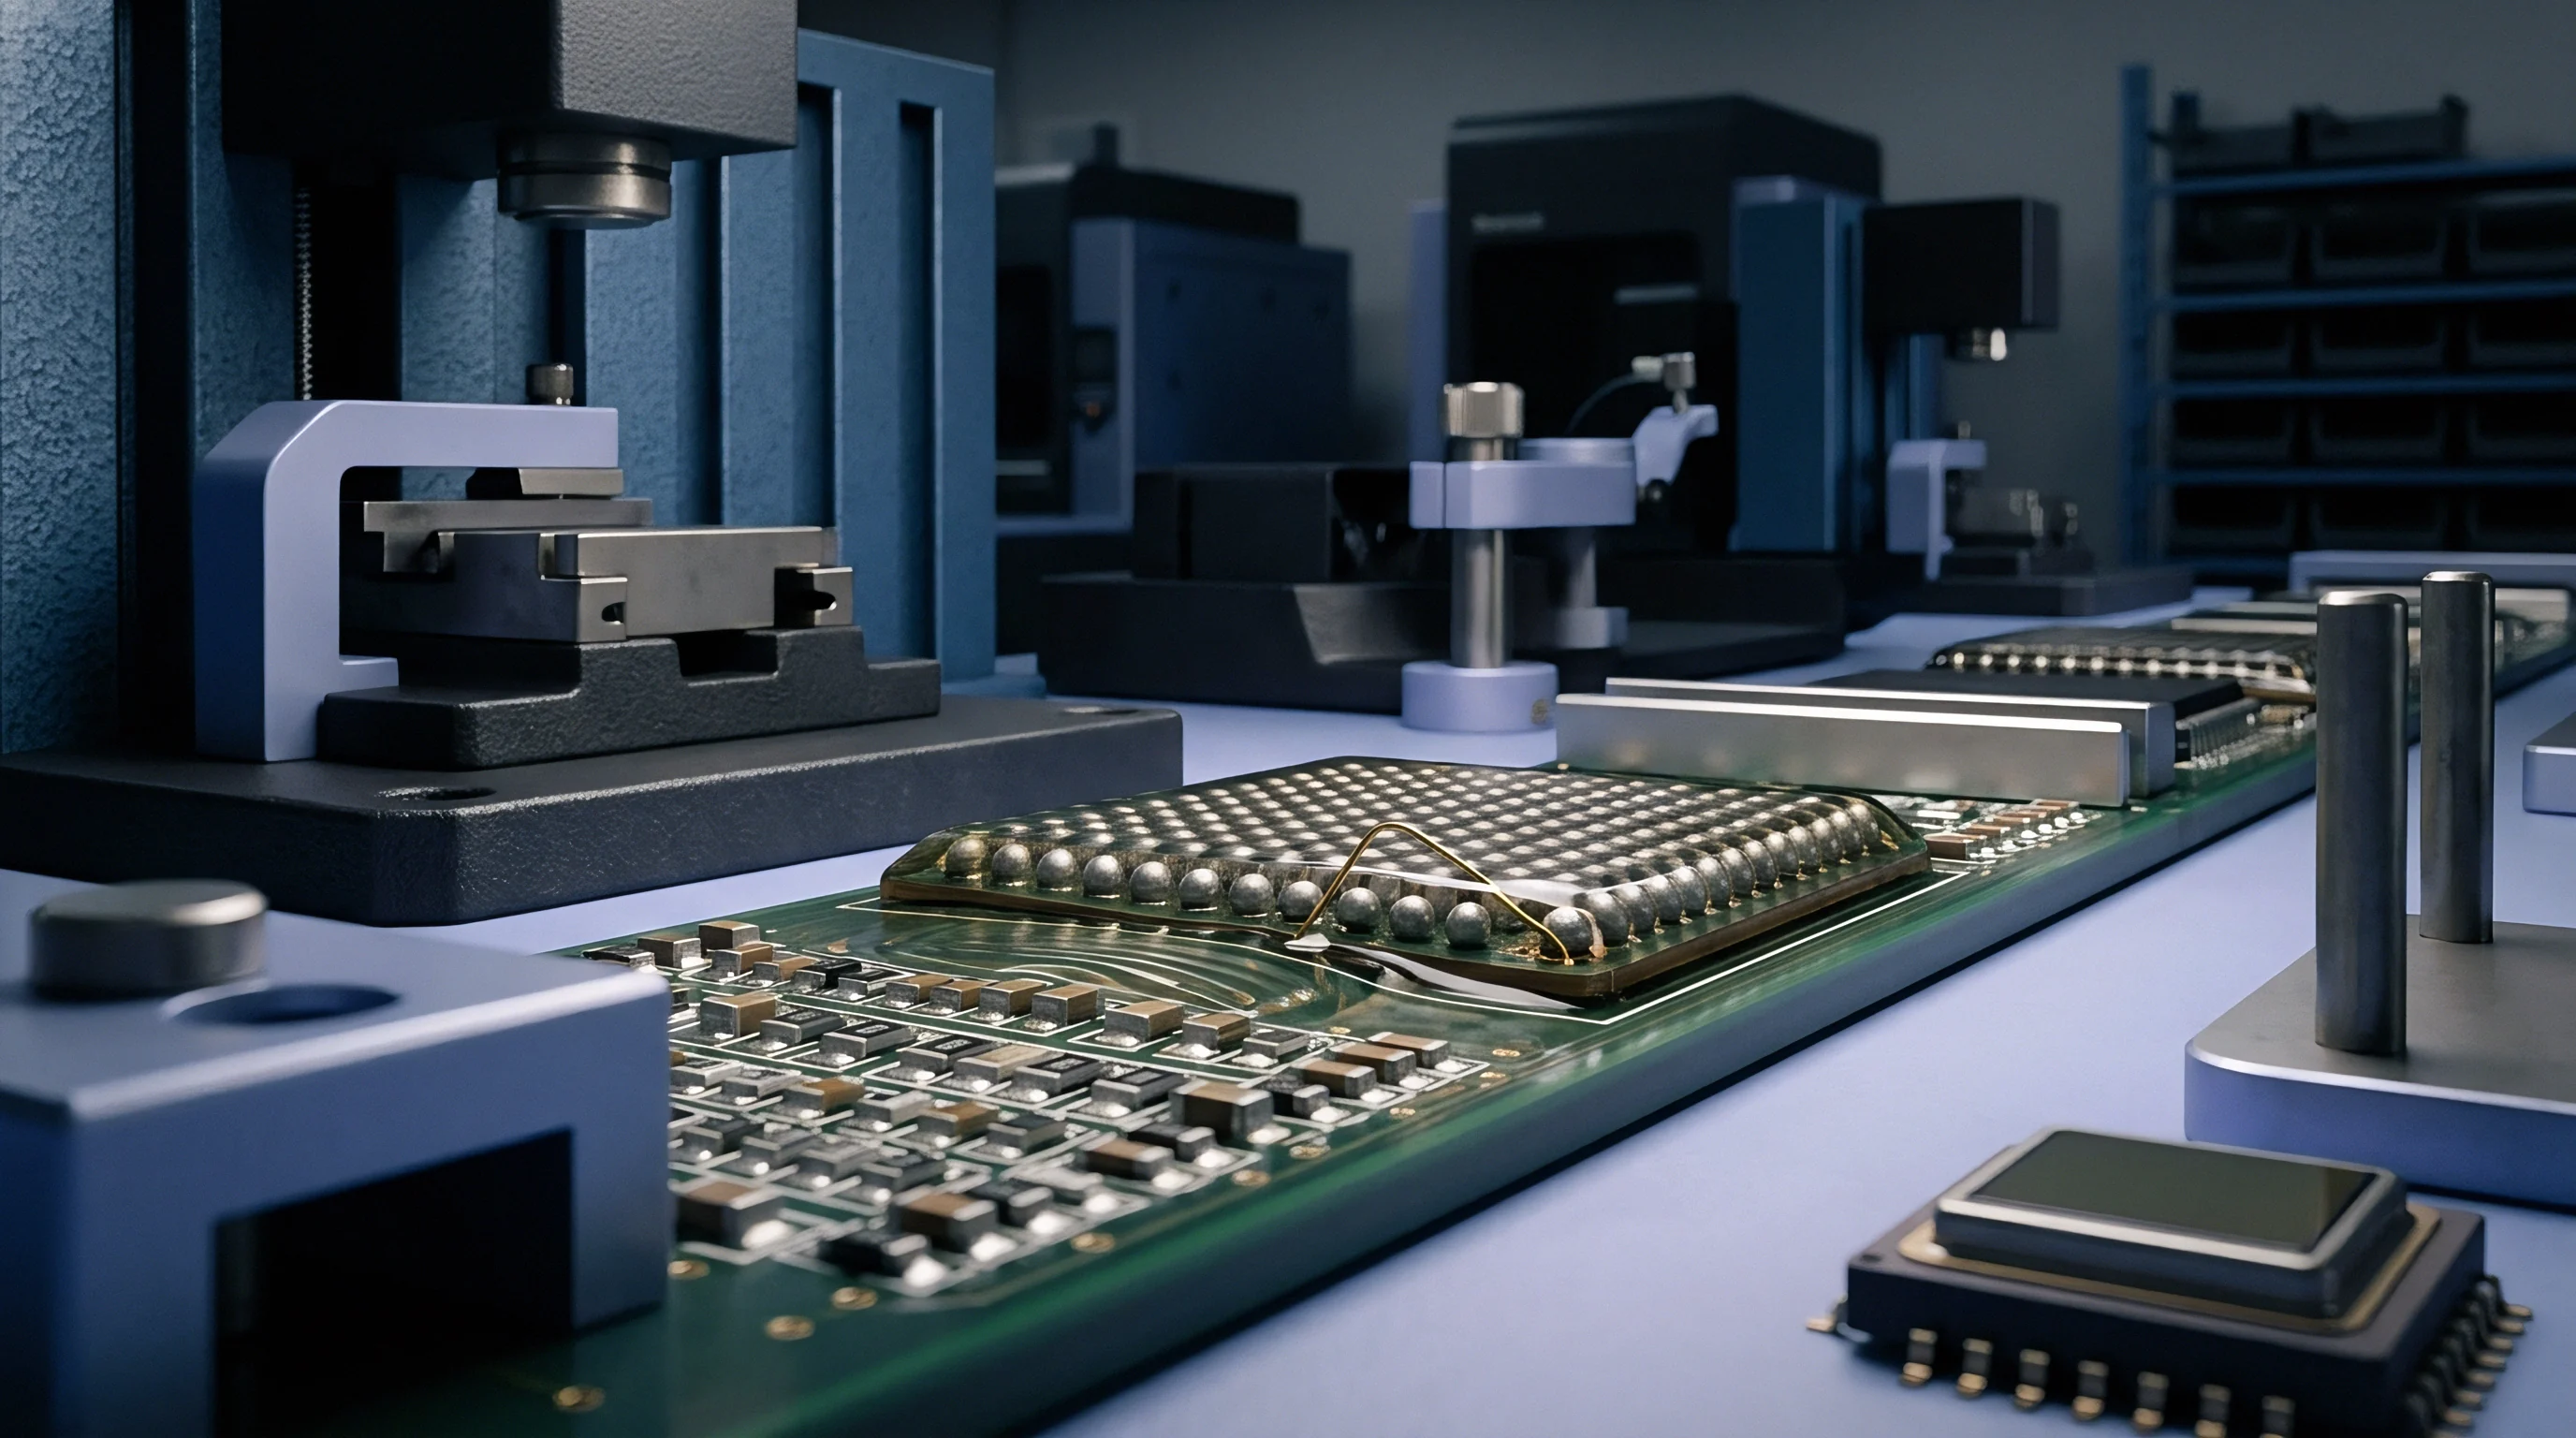
Fabrication Method Precision Comparison
Laser cutting, chemical etching, and electroforming yield noticeably different edge profiles. Diode-pumped fiber lasers cut stainless steel foils with beam spot sizes down to 20 µm, achieving tight positional accuracy. However, because the laser melts the steel locally, it leaves re-solidified dross, micro-scalloping, wall taper, and heat-affected zones along the aperture sidewalls.
Electropolishing removes these micro-burrs by submerging the cut foil in an acid bath under electrical current, dissolving microscopic peaks faster than valleys. This smooths out laser striations into rounded profiles that shed paste far more cleanly. Because electropolishing removes 2 µm to 5 µm of metal, slightly widening the aperture, designers must subtract this etch allowance from their CAM files.
Electroformed nickel stencils avoid thermal cutting entirely by plating nickel atom-by-atom over a photoresist mandrel, creating walls with a natural positive taper. These walls achieve exceptionally low surface roughness, often registering Ra values below 0.08 µm. This smooth finish allows full paste release down to area ratios of 0.55, well below the 0.66 baseline required for raw laser-cut steel.
Polymer nano-coatings wear off stencil contact surfaces long before the stainless steel aperture walls suffer mechanical deformation.

Surface Coatings and Liquid Repellency
Chemical surface treatments alter the boundary mechanics between the metal and the flux vehicle. Applying hydrophobic and oleophobic nano-coatings across the foil changes the surface energy of the aperture walls. Typical treatments use fluoropolymers or self-assembling phosphonate monolayers applied at thicknesses between 2 nm and 100 nm.
These coatings raise the contact angle of the flux against the aperture wall from about 35 degrees to nearly 110 degrees, preventing flux from wetting the metal and reducing shear friction during release. As a result, a laser-cut, electropolished stainless steel stencil with a certified nano-coating can release paste consistently at area ratios down to 0.50 before transfer efficiency drops below practical thresholds.
- Aperture wall micro-burrs snag solder particles during stencil separation, pulling paste deposits out of alignment.
- Thermal kerf taper creates negative draft angles that mechanically lock paste inside aperture cavities.
- Nano-coating abrasion wear degrades paste release performance gradually across consecutive production panel print cycles.
- Chemical wash degradation strips organic surface treatments during ultrasonic stencil cleaning cycles.
| Technology | Typical Wall Roughness Ra (µm) | Minimum Area Ratio Limit | Aperture Size Tolerance (µm) | Stencil Cost Multiplier |
|---|---|---|---|---|
| Standard Laser Cut Stainless | 0.40 to 0.60 | 0.66 | ± 7.5 | 1.0 |
| Laser Cut with Electropolish | 0.20 to 0.35 | 0.60 | ± 5.0 | 1.3 |
| Laser Cut with Nano-Coating | 0.15 to 0.25 | 0.55 | ± 5.0 | 1.8 |
| Electroformed Nickel Foil | 0.05 to 0.10 | 0.55 | ± 2.5 | 2.5 |
| Electroformed with Nano-Coating | 0.03 to 0.08 | 0.50 | ± 2.5 | 3.2 |
Fabricators often attribute premature clogging to flux chemistry or squeegee speed when unpolished laser-cut aperture walls are the actual culprit.


Land
The land geometry on the circuit board dictates the baseline dimensions for each stencil aperture. Designers choose between non-solder mask defined (NSMD) and solder mask defined (SMD) lands, a structural choice that directly affects transfer efficiency and area ratio calculations.
Non-solder mask defined lands feature bare copper pads surrounded by a clearance gap in the mask. In contrast, solder mask defined lands have mask overlapping the copper edges, establishing the target diameter through the mask opening itself, where any bridging creates immediate circuit shorts.

Which Pad Design Stabilizes Solder Release?
NSMD pads provide uniform perimeters and predictable wetting areas. Exposing the vertical sidewalls of the copper pad allows molten solder to flow around the pad edges during reflow, creating a mechanical wrap-around that improves fatigue resistance during thermal cycling.
SMD pads limit wetting to the top surface of the pad, where the mask forms a raised dike around the etched copper land, whose profile is naturally trapezoidal. When the stencil contacts an SMD footprint, its underside seals against this raised mask rather than bare copper, creating a slight standoff gap above the land.
Narrowing aperture width below the solder mask opening invites paste spillage onto bare laminate during board separation.
Print Alignment and Gasketing Dynamics
Clamping force presses the underside of the stencil against the board surface to establish a gasket seal, preventing paste from squeezing past aperture boundaries during printing. If the board has uneven mask thickness or underlying trace topography, that seal breaks down.
When mask misalignment or poor surface planarity destroys the seal, paste bleeds laterally underneath the foil, leading to bridging between adjacent balls on 0.40 mm pitch arrays and requiring tight process controls during board fabrication.
- Substrate surface planarity measurement confirms that bare copper pads sit coplanar with surrounding dielectric within 5 µm across the entire array matrix.
- Solder mask registration verification proves that mask openings align concentrically over copper pads within a maximum lateral offset of 10 µm.
- Aperture reduction execution decreases stencil opening diameters relative to land diameters by 10 percent to 15 percent to ensure reliable release gasketing.
- Pre-reflow paste inspection verification measures printed volume and height deposits to ensure all corners meet the statistical process baseline.
IPC-7351 land pattern tolerances specify tight boundary margins, requiring designers to reduce stencil aperture dimensions slightly to prevent bridging.


Inspection
Three-dimensional optical metrology validates print quality across thousands of array interconnect sites. In-line solder paste inspection systems use dual-laser triangulation or structured white-light moiré projection to measure the height, area, volume, and positional offset of every deposit.
Fine pitch ball grid arrays offer little margin for error. While passive components tolerate volume variations of up to 40 percent without failing, a 0.40 mm pitch array drops out of spec if deposit volume deviates by more than 20 percent from target, as paste volume determines the final joint standoff height needed to resist thermal fatigue.
Statistical Process Control and Cpk Thresholds
Metrology systems track volume distribution across consecutive panels to measure process capability (Cpk). High-yield surface-mount lines target a Cpk above 1.33 for standard components and above 1.66 for fine pitch ball grid arrays.
Calculating Cpk involves dividing the distance between the mean paste volume and the nearest specification limit by three times the standard deviation. When an aperture’s area ratio drops from 0.70 down to 0.55, standard deviation expands markedly; even if average volume stays near target, the wider distribution causes individual deposits to fall below lower specification limits. Using Type 4 paste in overly tight apertures accelerates clogging, forcing frequent stencil wipes that slow production throughput.
IPC-7525 specifications penalize stencil designs that neglect foil thickness tolerances by shifting the resulting paste deposit volumes below acceptable lower specification limits.

Yield Fallout Economics and Defect Sourcing
Defects on sub-half-millimeter components quickly erode manufacturing margins. Standard automated optical inspection cannot see beneath encapsulated array packages, requiring high-resolution transmission X-ray or 3D computed tomography to identify hidden voids, bridges, and non-wet open joints.
Offline X-ray inspection slows production, and rework costs escalate rapidly. Replacing a defective fine pitch ball grid array requires specialized thermal profiling, vacuum extraction, pad redressing, flux reapplication, and localized reflow. Each thermal cycle subjects surrounding components to extra stress, pushing the cost of reworking a high-density board up to twenty times higher than initial placement.
Proper area ratio design upfront avoids this expense entirely.
| Metric | Lower Specification Limit | Target Nominal | Upper Specification Limit | Target Cpk Index | Failure Mode Below Boundary |
|---|---|---|---|---|---|
| Paste Volume Ratio (%) | 70 | 100 | 130 | 1.66 | Open circuit or head-in-pillow |
| Deposit Height (µm) | 55 | 75 | 95 | 1.50 | Planarity separation failure |
| Positional Offset (µm) | -15 | 0 | +15 | 1.33 | Solder bridge to adjacent ball |
| Deposit Area Coverage (%) | 80 | 100 | 120 | 1.40 | Insufficient wetting footprint |
Whether real-time closed-loop squeegee adjustment can fully compensate for sub-0.4 mm aperture fouling remains a subject of ongoing debate among process engineers.