Transient Thermal Impedance Junction Temperature Measurement Setup
Transient thermal impedance measurement isolates internal semiconductor package layers by switching heating currents to sense forward voltage cooling curves.


Calibration
Thermal evaluation of power semiconductors starts by measuring forward voltage drop across an unheated die in a fluid bath. Held within a tolerance of 0.1 kelvin inside a dielectric liquid circulator, the device yields a baseline temperature-sensitive parameter curve that maps millivolt shifts directly to junction temperature changes prior to high-power loading. Without this precise calibration, transient cooling measurements produce skewed thermal impedance figures.

Temperature Sensitive Parameter Linearity across Device Chemistries
Silicon diodes exhibit negative thermal coefficients around two millivolts per kelvin, but wide-bandgap materials behave quite differently. Silicon carbide Schottky barrier diodes show non-linear forward voltage shifts at low measurement currents because barrier height inhomogeneities dominate conduction below 150 kelvin. Gallium nitride high-electron-mobility transistors feature lateral conduction paths where sheet resistance serves as an alternative sensing metric.
Establishing parameter validity across an operating envelope of 25 degrees Celsius to 175 degrees Celsius requires strict current stabilization.
| Device Chemistry | Transduction Parameter | Sensitivity (mV/K) | Linearity Range (deg C) | Calibration Drift (mV/1000h) |
|---|---|---|---|---|
| Silicon IGBT (Copack Diode) | Forward Voltage Drop | -2.05 to -2.20 | 25 to 150 | 0.15 |
| Silicon Carbide MOSFET (Body Diode) | Body Diode Forward Voltage | -2.80 to -3.40 | 25 to 175 | 0.42 |
| Silicon Carbide MOSFET (Channel) | Threshold Voltage at Gate | -4.10 to -5.50 | 25 to 175 | 1.20 |
| E-Mode Gallium Nitride HEMT | Source-Drain Forward Voltage | -1.60 to -1.95 | 25 to 150 | 0.85 |
Calibration software logs points at 25, 50, 75, 100, 125, and 150 degrees Celsius over a five-step thermal soak. Each temperature plateau requires twelve minutes of equilibrium to eliminate temperature gradients between the copper baseplate, internal solder, and die surface.
A measurement delay exceeding fifteen microseconds suppresses the extracted die-attach thermal resistance signature by twelve percent under a one-hundred-watt excitation step.

Gate Emitter Voltage Drift under Pulsed Sensing Conditions
Threshold measurements in wide-bandgap topologies show pronounced hysteresis as interface trap states charge during conduction. Because trapping shifts gate thresholds independently of heating, using the body diode of a silicon carbide power switch avoids gate trap instability and yields repeatable temperature-sensitive parameter coefficients. Applying gate bias during cooling introduces measurement artifacts that corrupt thermal structure functions.
The calibration dossier documents the exact operational parameters chosen for production acceptance runs:
- Measurement sense current stays bounded between five and ten milliamperes to prevent self-heating while exceeding package leakage currents at 175 degrees Celsius.
- Equilibrium stabilization time exceeds six hundred seconds at each thermal plateau to eliminate temperature deltas across the copper slug.
- Linear regression coefficients maintain a correlation metric above 0.998 across three consecutive temperature sweeps.
- Sensor calibration current supply maintains five microamperes regulation stability across three decades of ambient supply ripple.
JEDEC standard JESD51-1 Clause 3.2 specifies that calibration linearity verification requires at least five distinct temperature points across the operating envelope, rendering any three-point factory calibration invalid for contract sign-off.


Switch
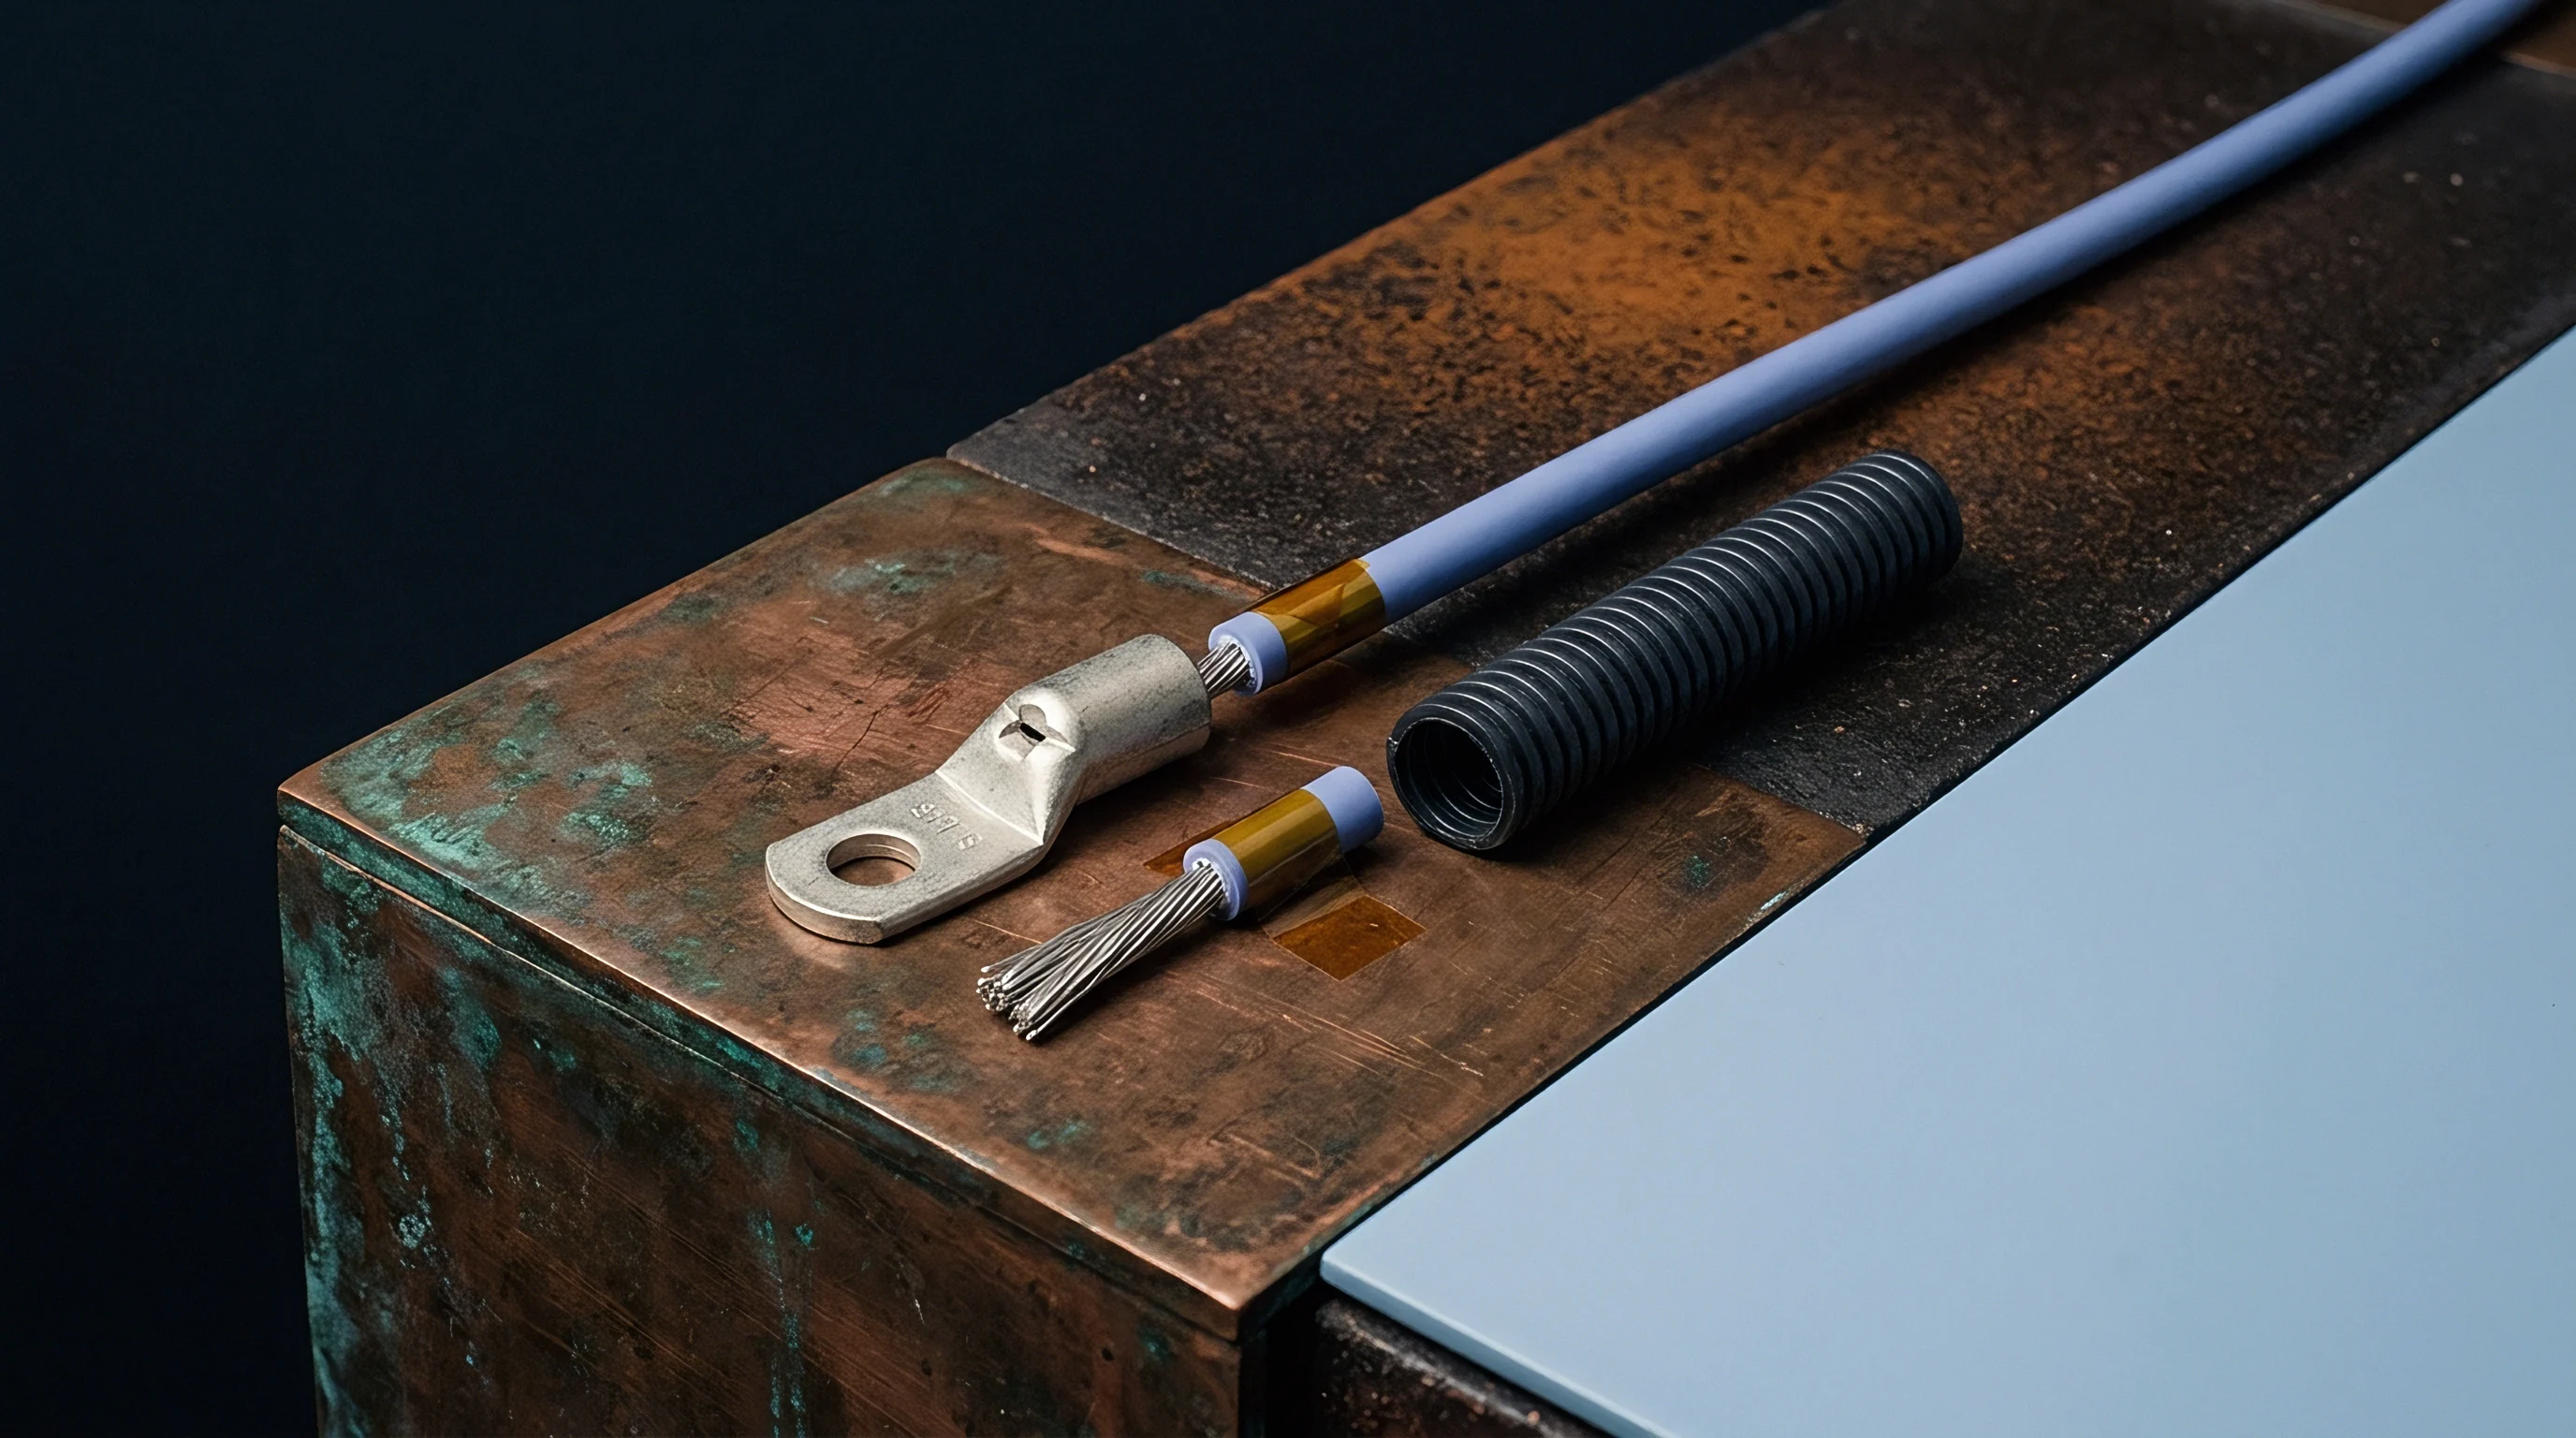
Commutating fifty amperes down to five milliamperes within one microsecond demands a tight physical loop layout. The transient thermal setup uses two separate power circuits sharing a single device connection: a high-current heating source and a regulated low-current sensing supply. Fast electronic switches disengage the heating source while isolating the sense circuit from hundreds of volts of back-electromotive force.
Inductive Flyback Suppression and Snubber Tuning
Parasitic busbar geometry creates rapid overvoltage transients that saturate analog input buffers during load disconnection. Because the heating current path contains loop inductance from cabling and package leads, disconnecting forty amperes in two hundred nanoseconds dumps inductive energy directly into the drain node. Left unclamped, this energy produces voltage spikes that exceed device breakdown ratings.
Shunt clamping diodes divert this inductive energy away from sensitive preamplifiers. Fast-recovery Schottky diodes paired with metal-oxide varistors clamp voltage peaks to forty volts, while damping resistors suppress LC tank oscillations between package capacitance and bus inductance. This allows the preamplifier to recover from saturation within eight hundred nanoseconds.
| Switching Parameter | Laboratory Baseline | Unsnubbed Fixture | Target Limit |
|---|---|---|---|
| Heating-to-Sense Commutation Time | 850 ns | 3.40 us | < 1.00 us |
| Peak Flyback Ringing Amplitude | 12.4 V | 185.0 V | < 20.0 V |
| Amplifier Saturation Recovery Period | 1.20 us | 18.50 us | < 2.00 us |
| Sense Current Slew Rate | 45 A/us | 8 A/us | > 40 A/us |

Can Parasitic Inductance Compromise Early Transient Data?
High-frequency oscillations can mask the true silicon response during the first ten microseconds after power removal, precisely when heat moves through the top thirty micrometers of silicon and metallization. If switching oscillations linger beyond two microseconds, deconvolution algorithms misinterpret those electrical waves as physical thermal RC stages. Placing short, coaxial Kelvin leads directly at the package terminals minimizes mutual inductive pickup.
JEDEC standard JESD51-14 defines junction-to-case thermal resistance at the divergence point between transient cooling curves recorded under wet and dry interface conditions.
Engineers evaluating switching performance must identify common operational failure mechanisms before validating transient test data:
- Preamplifier input saturation occurs when unclamped flyback voltage overrides the differential input stage, causing false thermal delay signatures.
- Reverse recovery blowback pushes current into the sense source, altering calibration baselines for several microseconds after load interruption.
- Switching gate jitter introduces timing discrepancies that distort initial logarithmic sampling bins during digital signal capture.
- Kelvin lead mutual coupling injects inductive voltage spikes into high-impedance sense channels during rapid current commutations.
Failing to suppress inductive flyback within two microseconds truncates the initial structure function, obscuring top-surface metallization and gate degradation in the qualification dossier.


Clamp
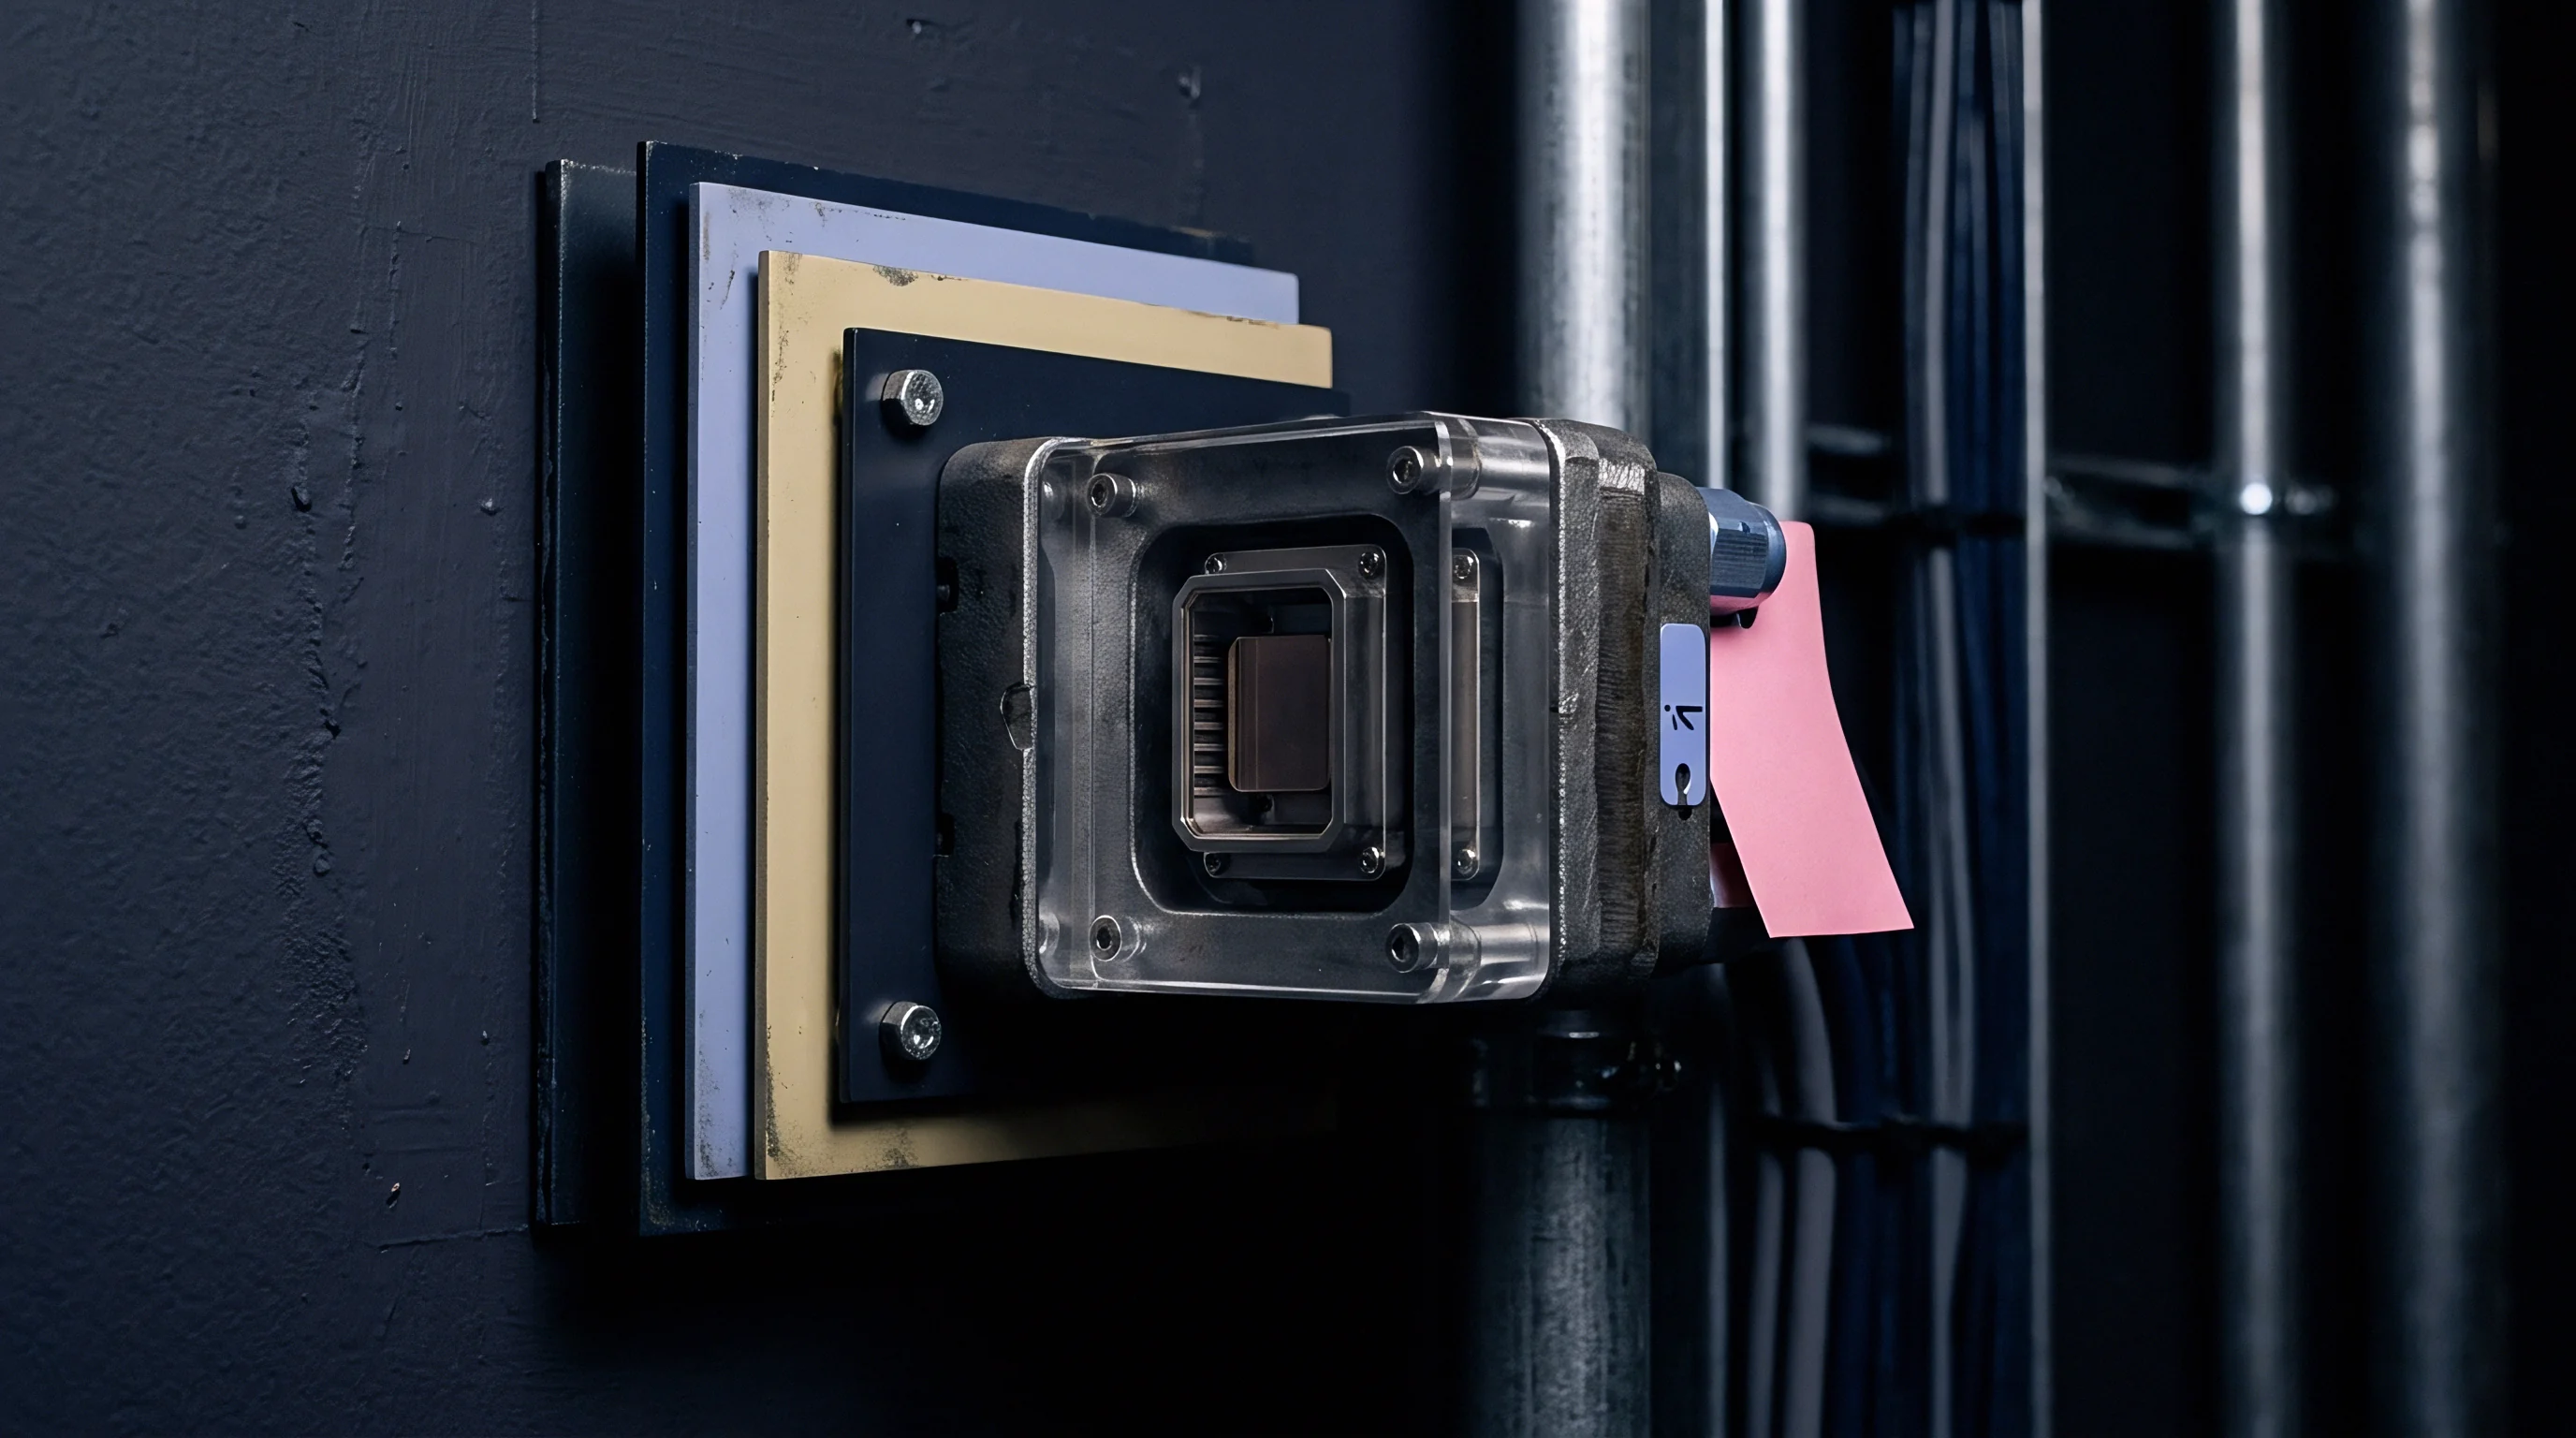
Mechanical mounting torque governs conductive heat transfer into the liquid cold plate. Contact impedance at the package-to-sink boundary introduces broad scatter across transient thermal impedance curves, where small variations in screw tension, baseplate bending, or interface application easily swamp subtle defects inside the die-attach solder layer.

Interfacial Pressure Uniformity across Power Package Geometries
Convex baseplate curvature creates localized air voids that multiply boundary contact impedance fivefold. Thick copper baseplates in power modules can bow by up to one hundred micrometers across their diagonals following vacuum reflow soldering, and applying clamping force only at peripheral mounting holes lifts the center of the baseplate away from the chiller block.
To eliminate localized hotspots caused by uneven contact resistance, controlled pneumatic clamping heads replace manual torque wrenches to deliver uniform, normal loads. Pneumatic rams apply repeatable pressures between 0.5 and 2.0 megapascals across the entire package footprint. Maintaining uniform mechanical pressure over thermal grease films prevents dry spots that would otherwise invalidate one-dimensional heat flow assumptions.
| Interface Condition | Contact Pressure (MPa) | Bond Line Thickness (um) | Interface Resistance (K/W) |
|---|---|---|---|
| Dry Metallic Contact | 0.5 | 0.0 (Asperities) | 0.485 |
| Dry Metallic Contact | 2.0 | 0.0 (Asperities) | 0.290 |
| Phase Change Material (Al-Oxide) | 0.5 | 38.0 | 0.095 |
| Phase Change Material (Al-Oxide) | 2.0 | 22.0 | 0.052 |
| Standard Silicone Grease | 0.5 | 45.0 | 0.082 |
| Standard Silicone Grease | 2.0 | 18.0 | 0.038 |
Thinner thermal grease layers lower conductive resistance until microscopic package warpage permits direct dry contact points across the perimeter.

Dual Interface Comparisons for Case Isolation
Testing power devices twice ~ once dry and once with thermal grease ~ pinpoints the package boundary divergence point. Standard JESD51-14 defines junction-to-case thermal resistance by overlaying transient curves from these two interface states. Because both runs share identical heat pathways through the silicon, die attach, and baseplate, the cooling curves match until thermal energy crosses into the external interface layer.
Executing an interface separation run demands exact mechanical steps:
- Fixture surface lapping ensures the nickel-plated copper chill plate maintains a flatness tolerance under five micrometers across two hundred square millimeters.
- Degreasing and solvent cleaning eliminates residual silicone compounds from the cold plate surface using sequential isopropyl alcohol and acetone flushes.
- Dry baseline measurement captures the first transient cooling curve with bare metallic contact under one megapascal of normal pressure.
- Controlled grease stencil application deposits a fifty-micrometer layer of thermal compound onto the device baseplate before secondary testing.
- Pneumatic clamp engagement reapplies calibrated mechanical load to achieve repeatable bond line consolidation without lateral shear stress.
Increasing the clamping force past the yield limit of the copper baseplate bows the center die upward, introducing insulating air pockets.
Interfacial grease pump-out during power cycling can stem from application handling errors or underlying baseplate mechanical non-planarity.

Deconvolution
Converting raw cooling curves into localized structural distributions requires extracting the numerical time-constant spectrum. Heating current is applied until the device reaches steady-state equilibrium and sets up a stable temperature gradient. At time zero, power disconnects, and a high-speed analog-to-digital converter samples the forward voltage drop across six decades of time ~ from one microsecond to one thousand seconds ~ using logarithmic sampling to capture fast early transitions.

Mathematical Ladder Transformations to Physical Cauer Models
Series RC representations derived directly from analytical cooling curves lack physical spatial correspondence. A multiexponential curve fit yields an unphysical network where every capacitor ties to ground; while this model accurately captures terminal electrical-thermal impedance, individual RC stages do not map to actual material layers as solder fatigue expands microvoids over time.
Deconvolving the time-constant spectrum transforms the network into a Cauer model continued fraction. Here, thermal capacitors connect to local nodes along a physical thermal resistance line, allowing each RC cell to map directly to a package layer: silicon bulk, die attach solder, ceramic substrate, module baseplate, and thermal interface compound. Plotting cumulative thermal capacitance against cumulative thermal resistance yields the differential structure function.
| Physical Package Layer | Material Composition | Thickness (um) | Rth (K/W) | Cth (J/K) |
|---|---|---|---|---|
| Semiconductor Die | Silicon Bulk | 120 | 0.045 | 0.032 |
| Die Attach Layer | Sn-Ag-Cu Solder | 50 | 0.082 | 0.015 |
| Substrate Top Metallization | Direct Bonded Copper | 300 | 0.018 | 0.125 |
| Isolation Ceramic | Silicon Nitride (Si3N4) | 320 | 0.115 | 0.450 |
| Substrate Base Metallization | Direct Bonded Copper | 300 | 0.018 | 0.125 |
| Module Baseplate | Copper-Nickel Plated | 3000 | 0.065 | 5.850 |
When Does Structural Deconvolution Separate Die Attach Resistance?
Localized peaks along differential capacitance profiles reveal solder voiding directly beneath the semiconductor element. Taking the derivative of cumulative thermal capacitance with respect to cumulative thermal resistance produces peaks within high-conductivity materials ~ like copper layers ~ that absorb substantial heat with minimal temperature change. Troughs, by contrast, mark low-conductivity boundary zones like solder interfaces and thermal grease layers.
Solder degradation narrows the horizontal distance between the silicon peak and the substrate metallization peak on the structure function curve as die-attach voids increase thermal resistance. Subtracting a dry interface curve from a wet interface curve identifies the exact divergence point, establishing the junction-to-case resistance boundary without external thermocouple probes while liquid-cooled plates hold temperature constant.
A mathematical evaluation illustrates error propagation when deconvolution algorithms process noisy voltage transient data:
Assume an initial heating power of 150 watts applied to a power switch until reaching thermal equilibrium at 85 degrees Celsius. The measurement begins with a sense current of 10 milliamperes, presenting a temperature-sensitive parameter slope of 2.15 millivolts per kelvin. Analog acquisition records a cooling transient spanning 1.0 microsecond to 100 seconds across 1000 logarithmically spaced bins.
A high-frequency noise ripple of 0.5 millivolts on the voltage channel translates to an instantaneous temperature error of 0.23 kelvin. When numerical differentiation algorithms compute the time constant spectrum through Bayesian deconvolution, this 0.23 kelvin ripple amplifies into spurious phantom peaks across the sub-ten-microsecond domain. Setting smoothing filter bandwidths below two octaves suppresses this computational noise, yet widens the extracted die-attach trough by 18 percent, artificially inflating reported die-attach resistance from 0.082 K/W to 0.097 K/W.
The exact mathematical criteria for separating physical thermal boundary transitions from numerical deconvolution artifacts in thin-film gallium nitride packages remain subject to active industry dispute.


Ledger
Capital procurement decisions for transient thermal test benches balance instrument channel count against throughput cycle times. Dedicated analytical testers with sub-microsecond electrical switching and automated structure function processing require substantial capital outlays, so purchasing hinges on whether the equipment serves as a development workstation or an in-line quality screening station.

Hardware Allocation between Failure Analysis and Screening
Automated handler integration cuts testing expenses on high-volume packaging lines. Because full transient characterization under JESD51-14 requires cooling cycles over sixty seconds per unit to reach equilibrium, generating complete structure functions for 100 percent of production is impractical. Volume lines instead use shortened power pulses ~ applying a five-hundred-millisecond pulse to verify die-attach solder integrity without heating the massive copper baseplate.
This short-pulse screening checks thermal impedance at one millisecond, ten milliseconds, and one hundred milliseconds against statistical process control limits. Elevated thermal resistance at ten milliseconds flags die-attach voids for immediate rejection prior to wire bonding, leaving full dual-interface structure function analysis for lot qualification, supplier audits, and failure analysis.
A short thermal pulse exposes die attachment voids quickly, whereas a sustained thermal pulse carries heat all the way to the baseplate boundary.