Thermal Zero Shift Mechanics in Micro Dosing Flow Control Systems
Thermal zero shift creates undetected micro-dosing volume bias that degrades production yield unless verified across operational temperature sweeps.
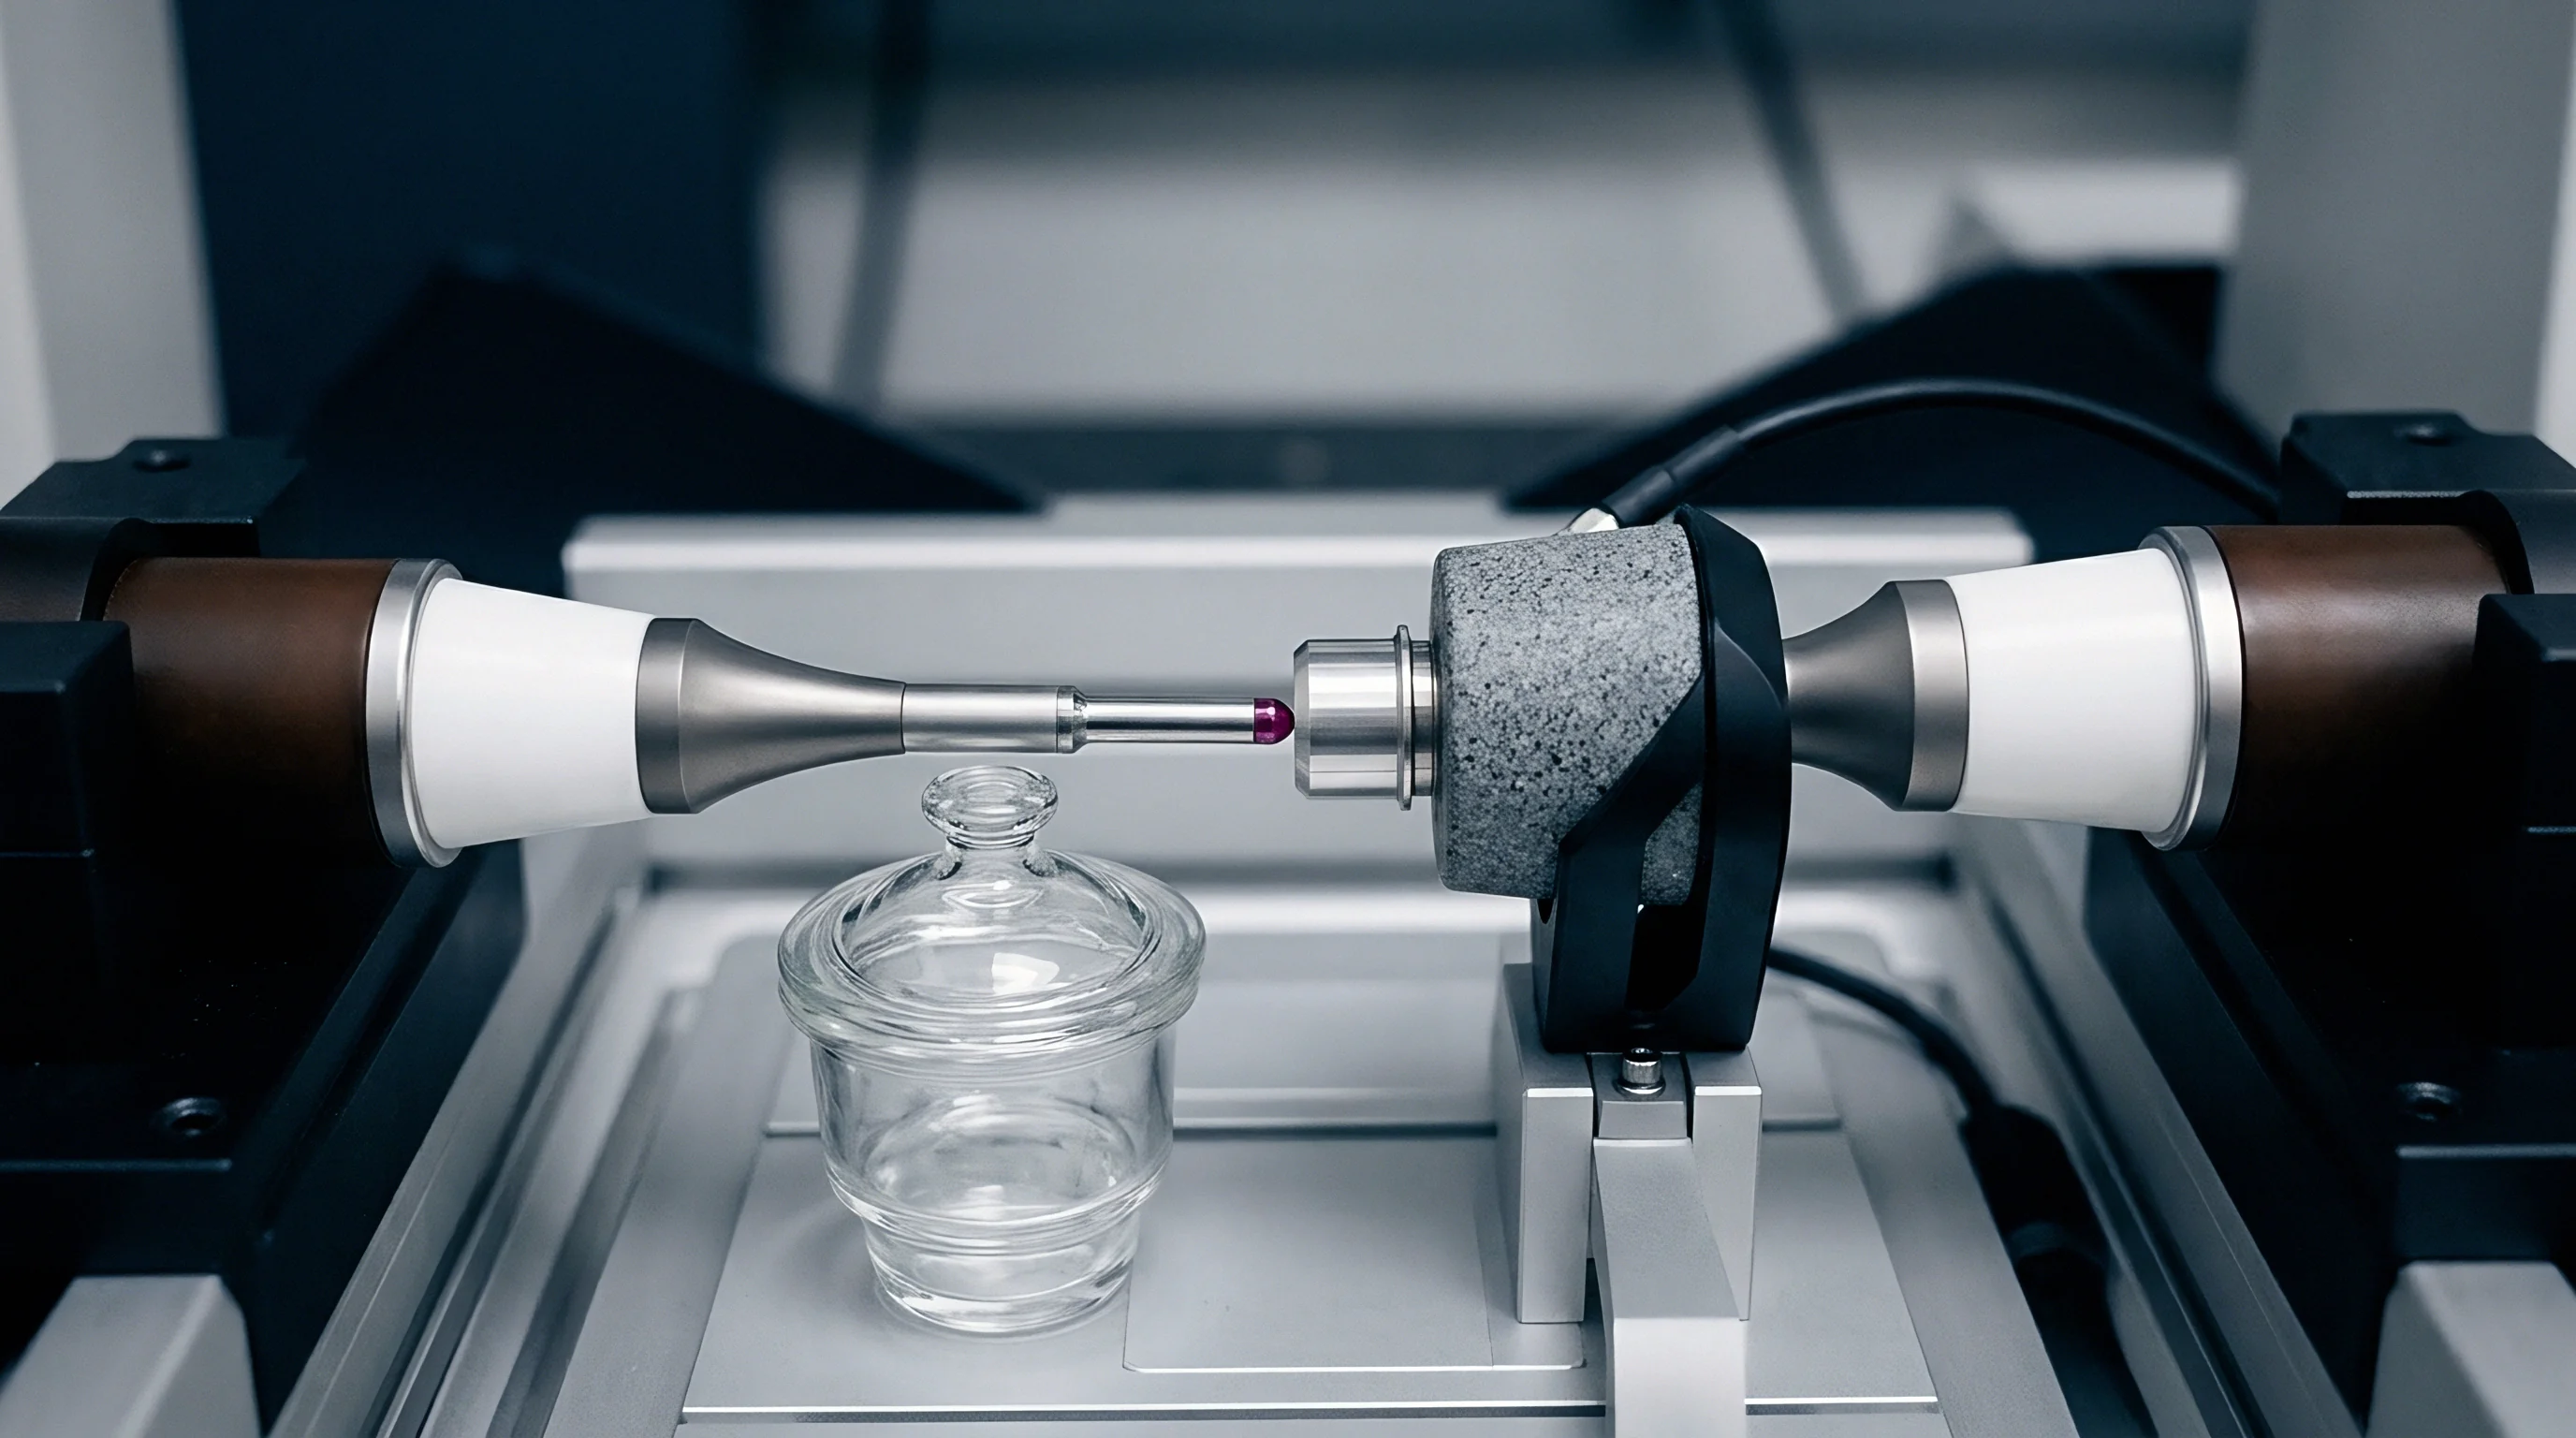
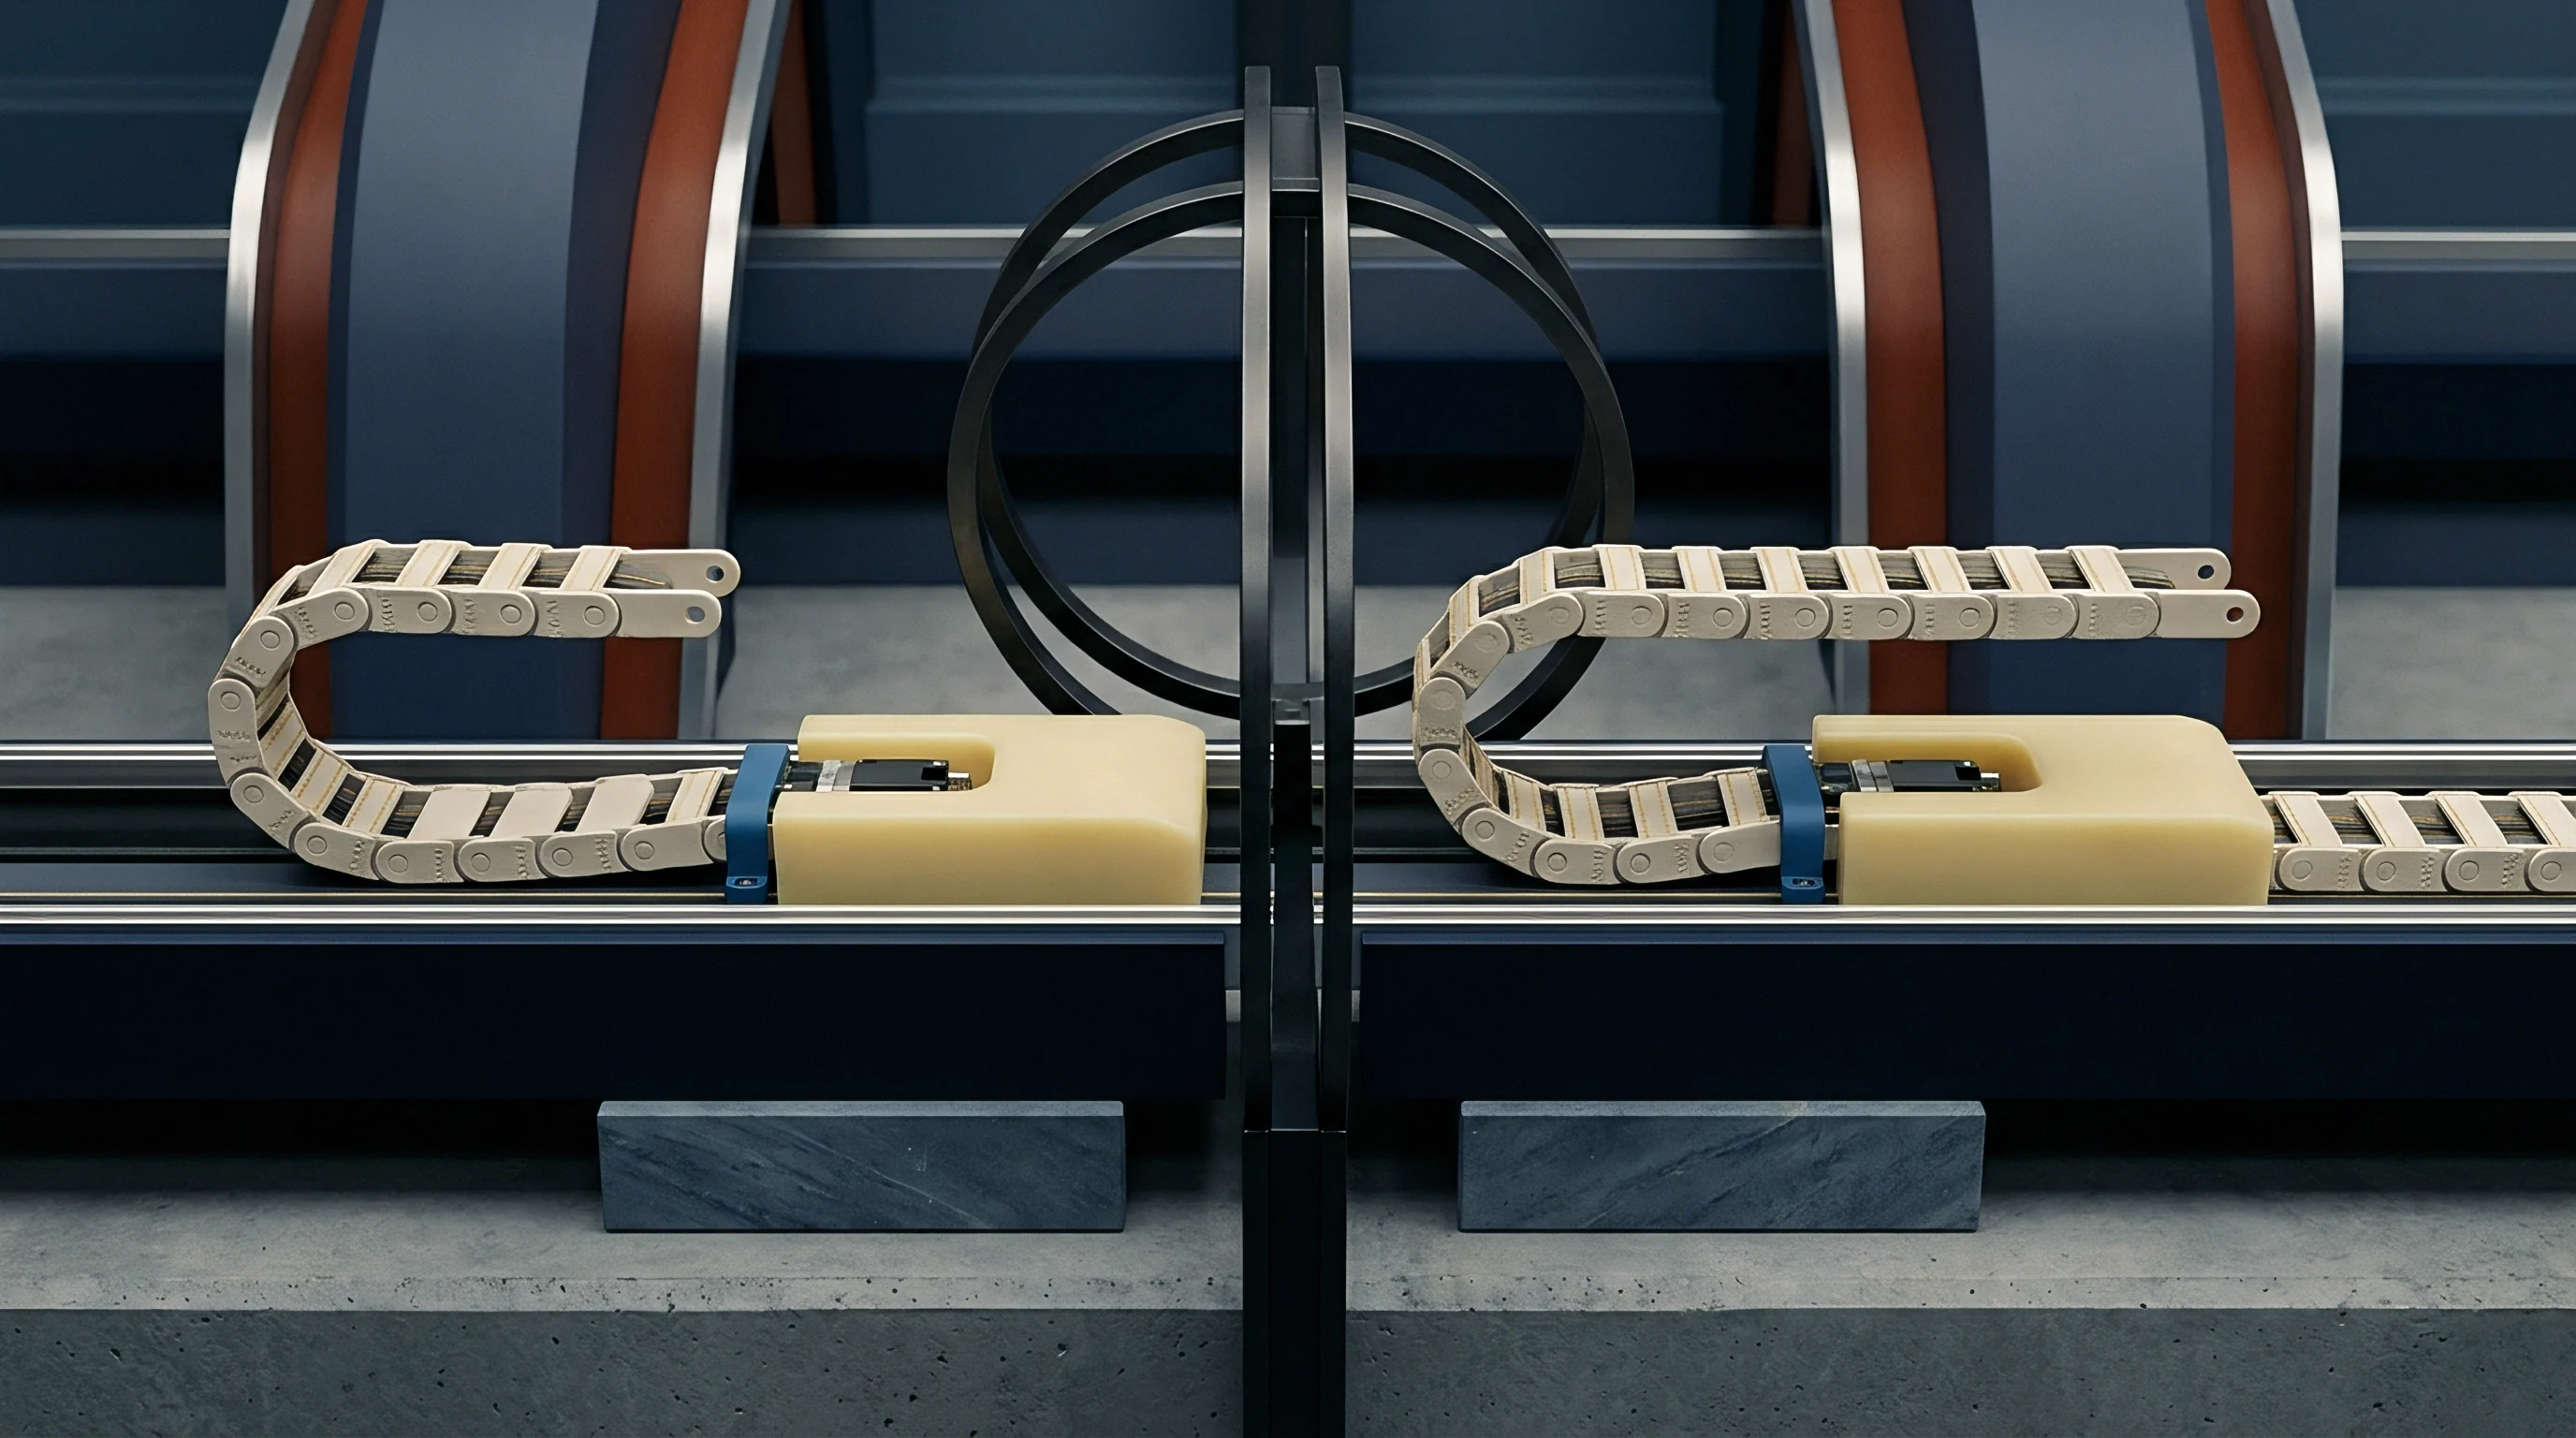
Gradient
Micro-dosing architectures operating below ten milliliters per hour develop baseline instability whenever localized heat transfer alters the resistance balance of the sensing elements. Drive coils, ambient swings, and fluid temperature mismatches can all create an asymmetric temperature field across thermal mass flow meters or Coriolis capillary tubes. This offset mimics the differential signal of actual fluid motion.
At flow rates down in microliters per minute, the signal from true mass transport easily drops below the millivolt output generated by a thermal imbalance of just fifty millikelvins across the sensing bridge.

Thermal Asymmetry across Micro Sensor Bridges
Differential temperature sensing relies on balanced conduction between upstream and downstream resistance elements set symmetrically along a capillary channel. Silicon micromachined sensors mount thin-film platinum or polysilicon thermopiles on a suspended silicon nitride membrane to isolate them from parasitic heat loss to the frame. With static fluid in the conduit, thermal energy from an integrated central heater spreads evenly to both sensing bridges, keeping the differential temperature at zero under ideal conditions.
Mounting stress, non-uniform adhesive bond lines, and heat from nearby circuit board components introduce steady-state temperature gradients across the die. When a gradient aligns with the flow axis, it produces an offset voltage before any fluid moves. A power regulator six millimeters away dissipating four hundred milliwatts can drive a thermal slope of twenty-five millikelvins across a two-millimeter sensor membrane.
For a sensor calibrated to a full-scale range of one milliliter per hour with a sensitivity of fifty microvolts per microliter per hour, that conductive bias shows up as a permanent zero offset of twelve microliters per hour.
A static temperature offset of twenty-five millikelvins across the sensing span produces a twelve microliter per hour bias on a one milliliter full-scale range.
Pure silicon expands uniformly, but uneven heat sinking at the fluid fittings converts mechanical strain into thermal asymmetry. Stainless steel fluid manifolds carry thermal time constants over forty minutes, while the silicon micro-channel responds in three milliseconds. As a result, sudden ambient temperature shifts reach the silicon chip through its electrical leads and mounting points long before the metallic fluid ports can settle.
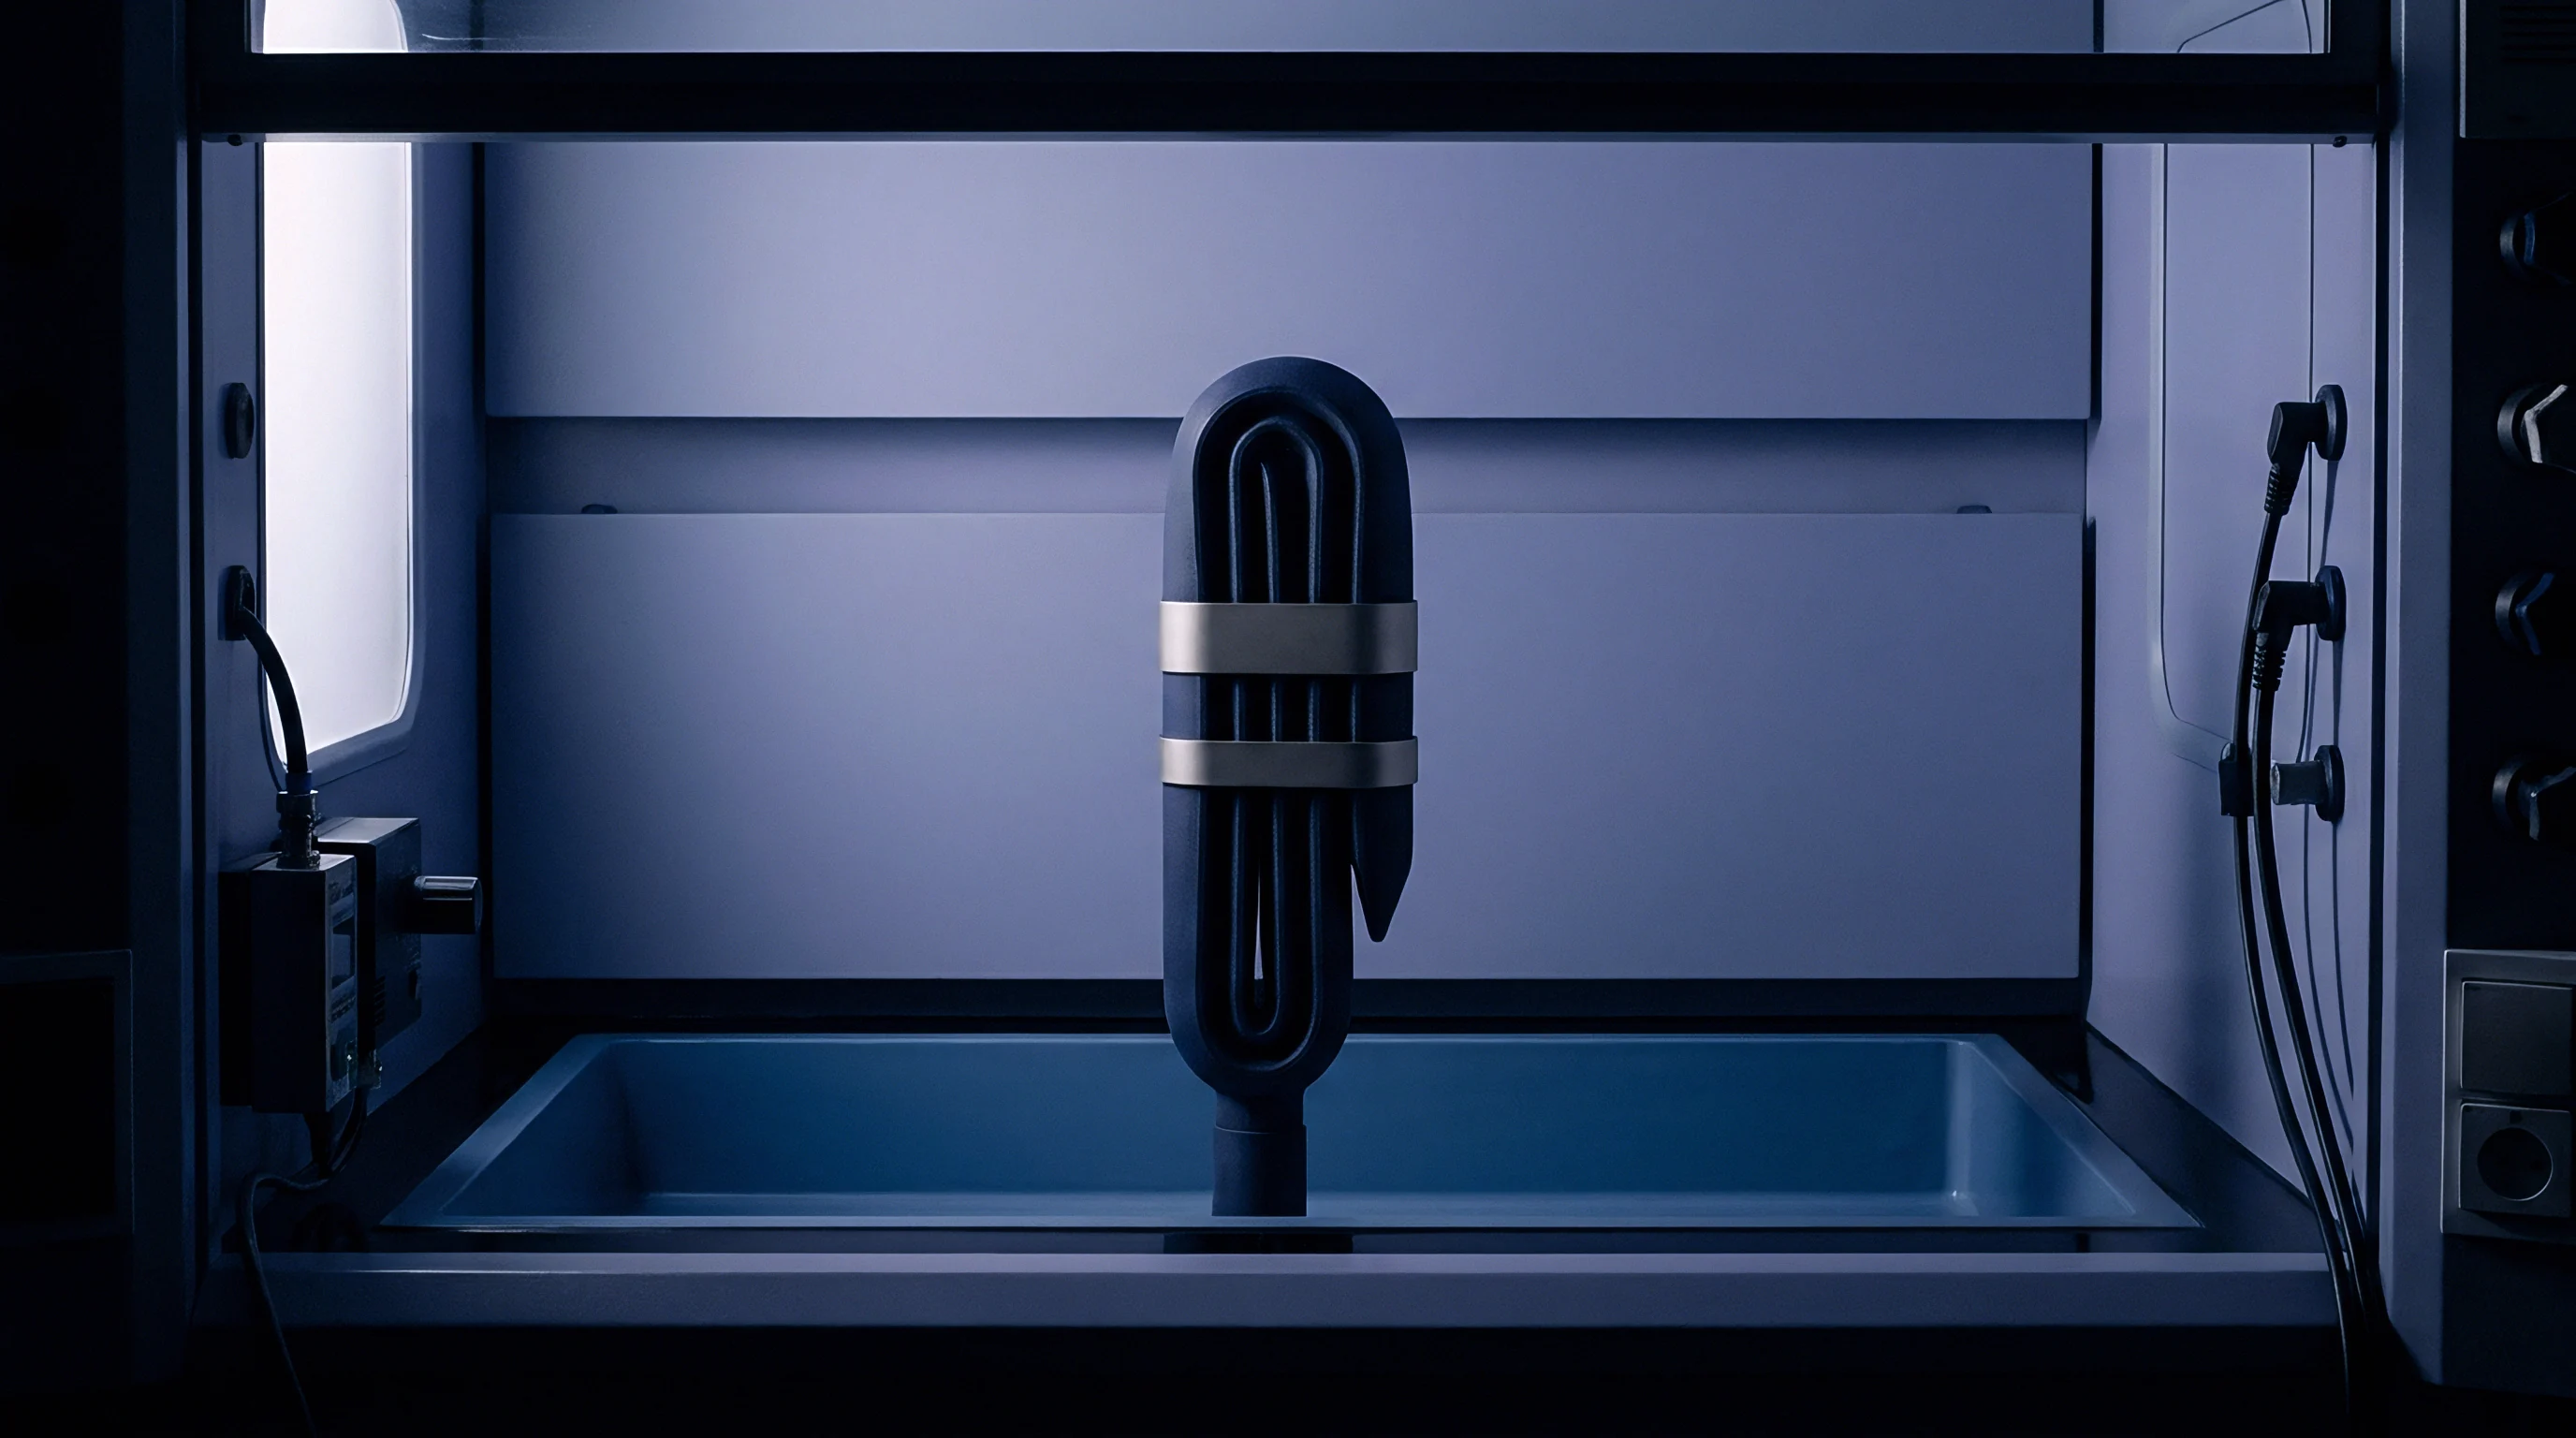
Dissipation Paths in Capillary Mass Measurement
Capillary thermal flow controllers heat fluid directly through the tube wall, tracking how convective flow distorts the resulting temperature profile. Energy from the heater coil escapes along three parallel paths: axial conduction through the metal tube wall, radial conduction through the surrounding gas or potting material to the enclosure, and advection in the moving liquid. Down in the nanoliter-per-hour range, advection accounts for less than one-tenth of one percent of total heat loss, leaving conduction through the tube wall to dominate the balance.
Variations in tube wall thickness alter axial heat transfer. A five percent change in cross-sectional area along the heated capillary zone skews the temperature profile, while ambient shifts alter the balance between radial and axial heat loss, shifting the zero baseline of the differential voltage amplifiers.
| Flow Rate (microliters per hour) | Fluid Advection Share (%) | Capillary Wall Conduction Share (%) | Gas Potting Radial Loss Share (%) | Apparent Zero Shift per Kelvin (nl/h/K) |
|---|---|---|---|---|
| 10 | 0.04 | 71.40 | 28.56 | 420 |
| 50 | 0.19 | 71.29 | 28.52 | 415 |
| 250 | 0.94 | 70.76 | 28.30 | 390 |
| 1000 | 3.62 | 68.84 | 27.54 | 280 |
| 5000 | 15.80 | 60.14 | 24.06 | 95 |
Insulated enclosures shield against ambient drafts but retain heat generated by internal drive electronics. Heat sinks mounted directly to the sensor base create fixed thermal paths that bypass the fluid conduit, breaking thermal symmetry so that the zero point drifts continuously during warm-up until every structural component reaches thermal equilibrium.
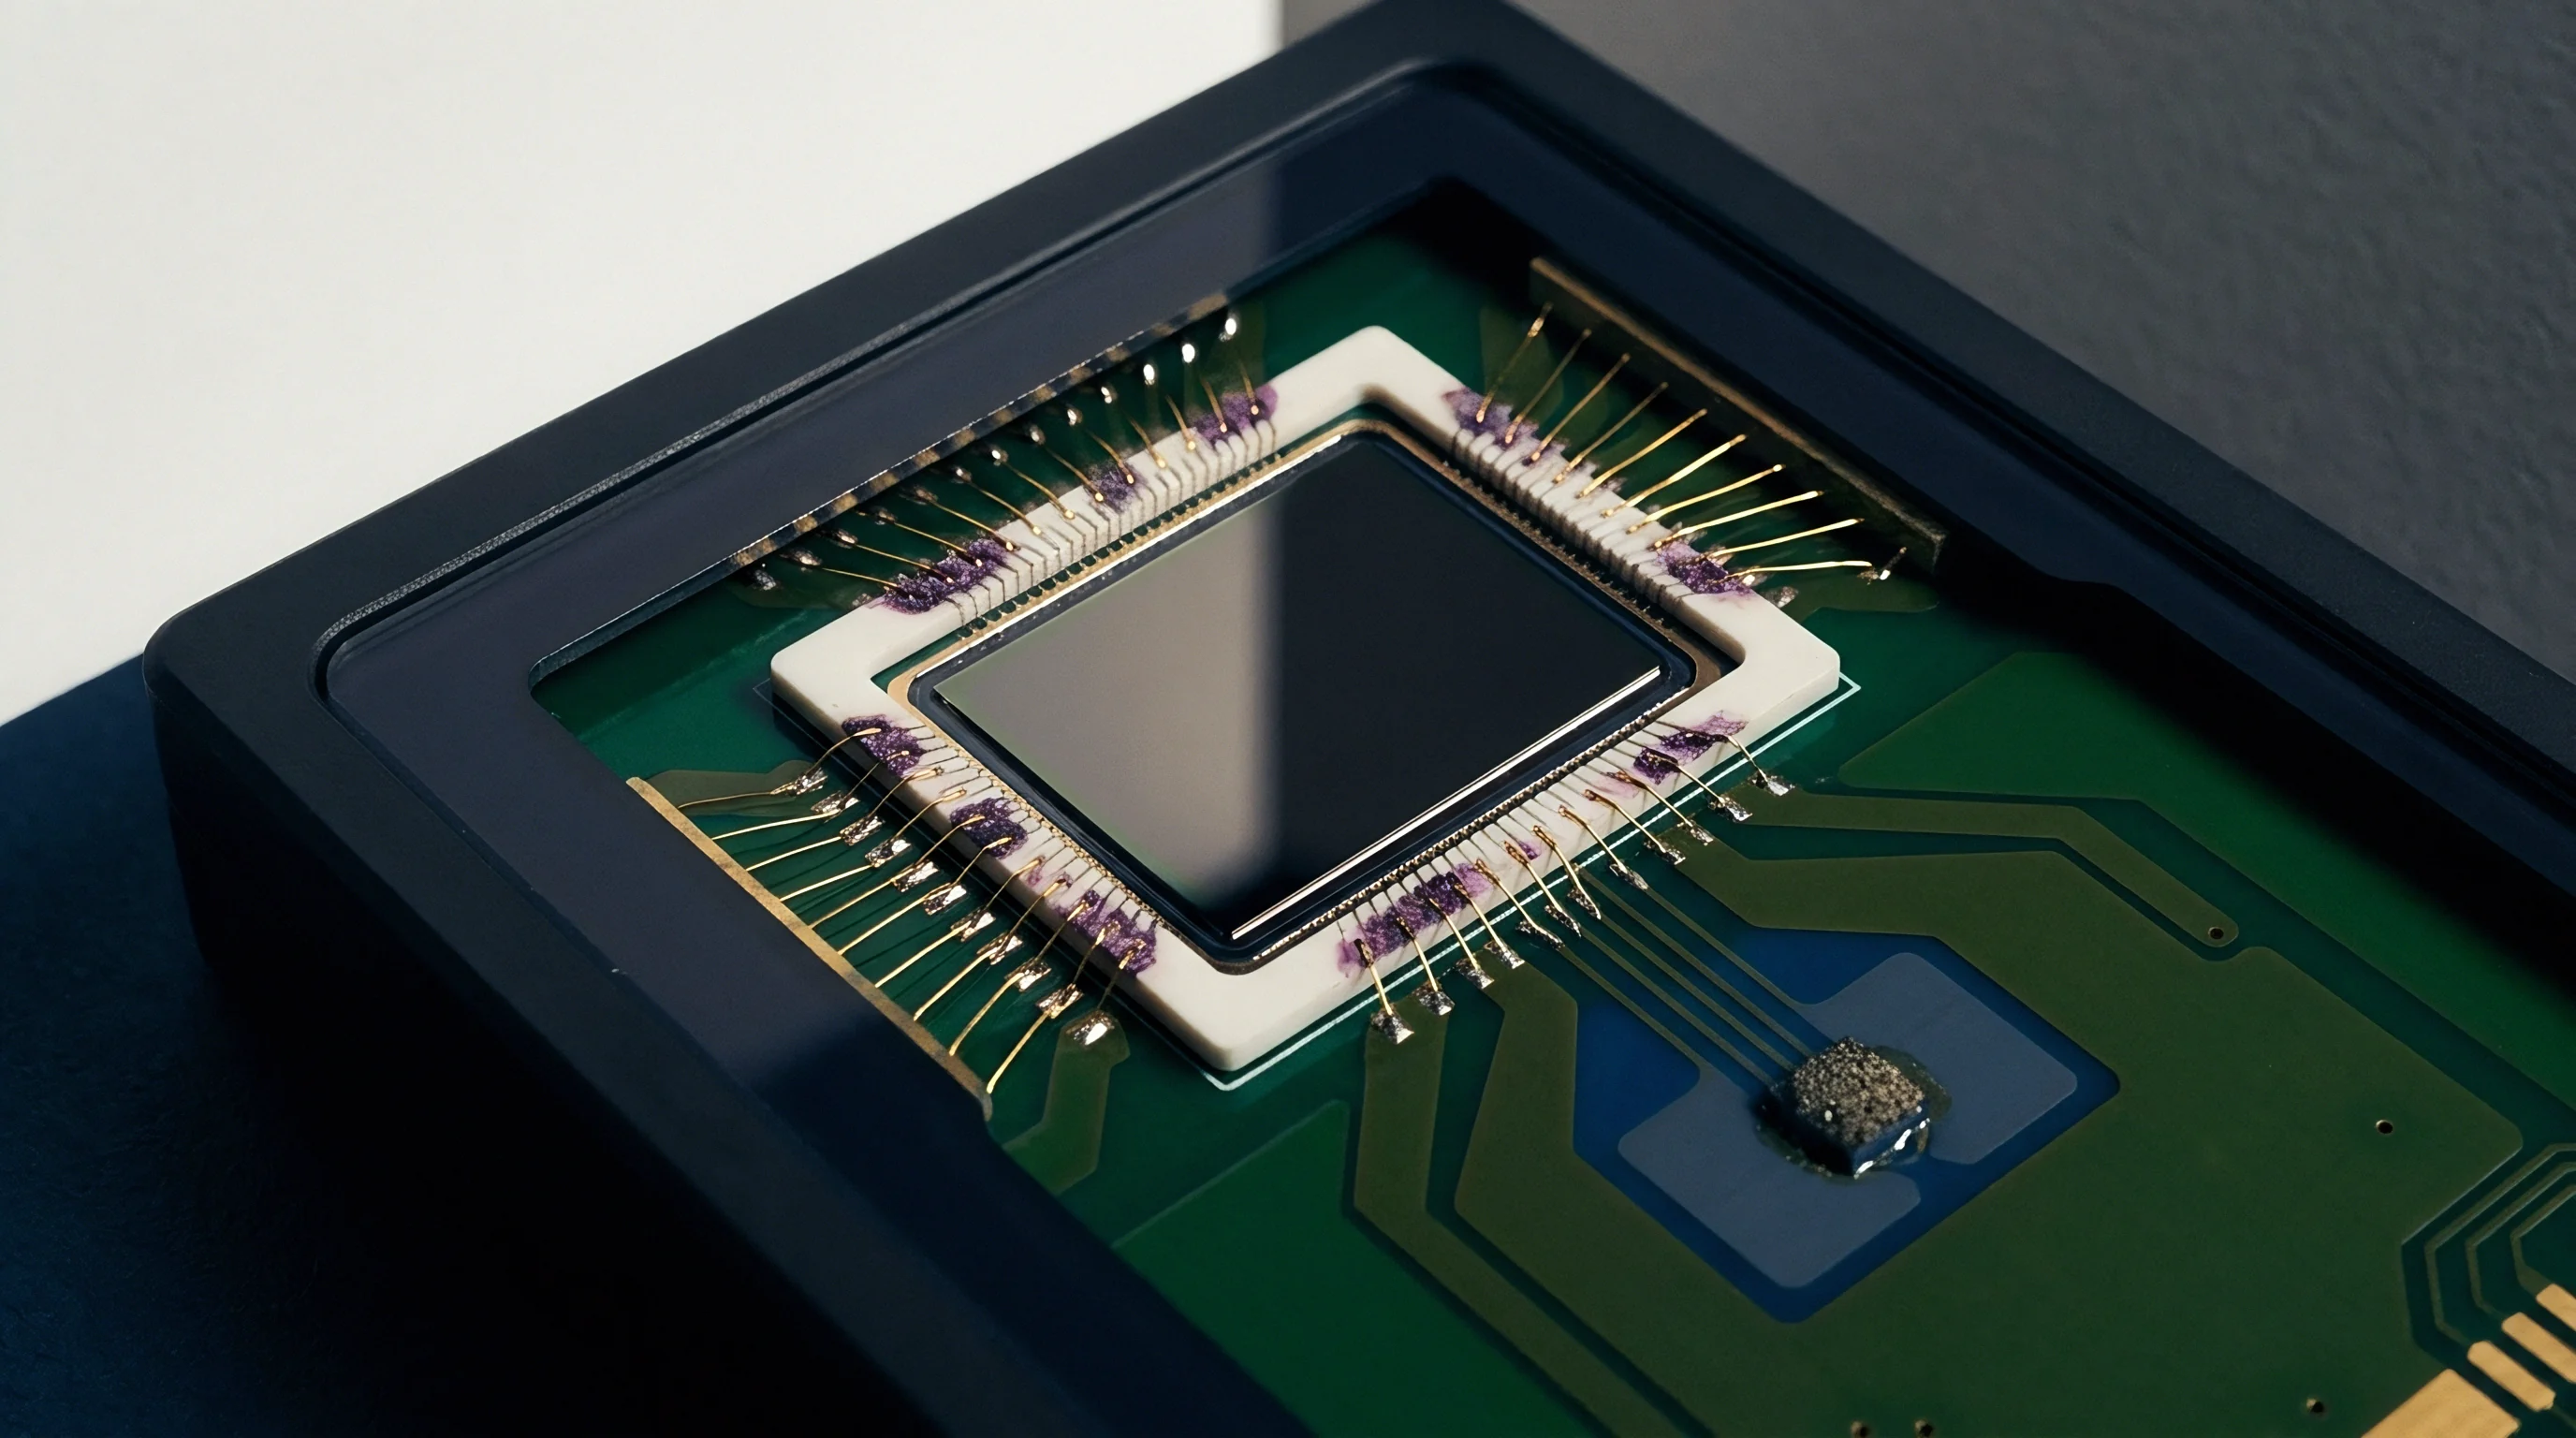
Bore
Internal geometry along micro-fluidic dosing channels sets the laminar velocity profile and the growth of the convective boundary layer across the sensor. Capillary channels with hydraulic diameters below one hundred micrometers create high flow resistance, generating viscous shear heating that alters temperature profiles under pressure. When micro-dispensing reagents against backpressures above five bar, this viscous dissipation heats the liquid right at the inner wall.
Viscous Heating and Boundary Layer Distortion
Fluid passing through a sub-millimeter channel converts mechanical pressure into heat as governed by the Brinkman number. Even when the Brinkman number remains low ~ as with water at micro-dosing rates ~ viscous heating concentrates inside the laminar boundary layer along the wall, altering the thermal boundary layer generated by the measurement heater.
In fluids with strong thermal viscosity coefficients ~ such as organic solvents, glycols, or biological media ~ heat from the sensor thins the fluid layer next to the channel wall. The velocity profile shifts away from the ideal parabolic Hagen-Poiseuille model, speeding up flow near the wall. Because the sensor measures a velocity field distorted by its own thermal input, the resulting baseline shift registers as false flow even with downstream shutoff valves closed.
Capillary Expansion and Structural Strain
Thermal expansion of the channel changes its internal cross-section, altering fluid volume in the measurement zone and shifting the resonant frequency in micro-Coriolis units. In sensors using a vibrating silicon or titanium tube, zero-flow frequency depends on baseline structural stiffness. Temperature shifts change the material’s Young modulus and cause dimensional variations that shift the phase difference between detection legs under zero-flow conditions.
- Capillary Tube Wall Expansion changes internal cross-sectional area based on the wetted material’s thermal expansion coefficient, introducing false volumetric displacement readings during temperature shifts.
- Silicon Nitride Membrane Deflection develops under thermal stress from expansion mismatches between the dielectric isolation layer and silicon frame, straining integrated piezo-resistors.
- Bonding Epoxy Swelling exerts mechanical torque on the fluid channel during humidity shifts, causing baseline drift that mimics actual flow.
- Fluid Density Variations alter the fluid mass inside the measurement loop, shifting the resonant baseline without any fluid movement.
Fluid properties and channel geometry must be matched carefully to suppress zero drift across thermal steps.
Drift
Long-term zero drift in micro-flow instruments represents a permanent shift away from factory calibration. Unlike reversible thermal offsets caused by temporary temperature gradients, extended operation at elevated temperatures drives material creep, dielectric polarization, and resistance changes that degrade baseline stability over months in production cleanrooms.
Micro-Coriolis Resonant Tube Dynamics
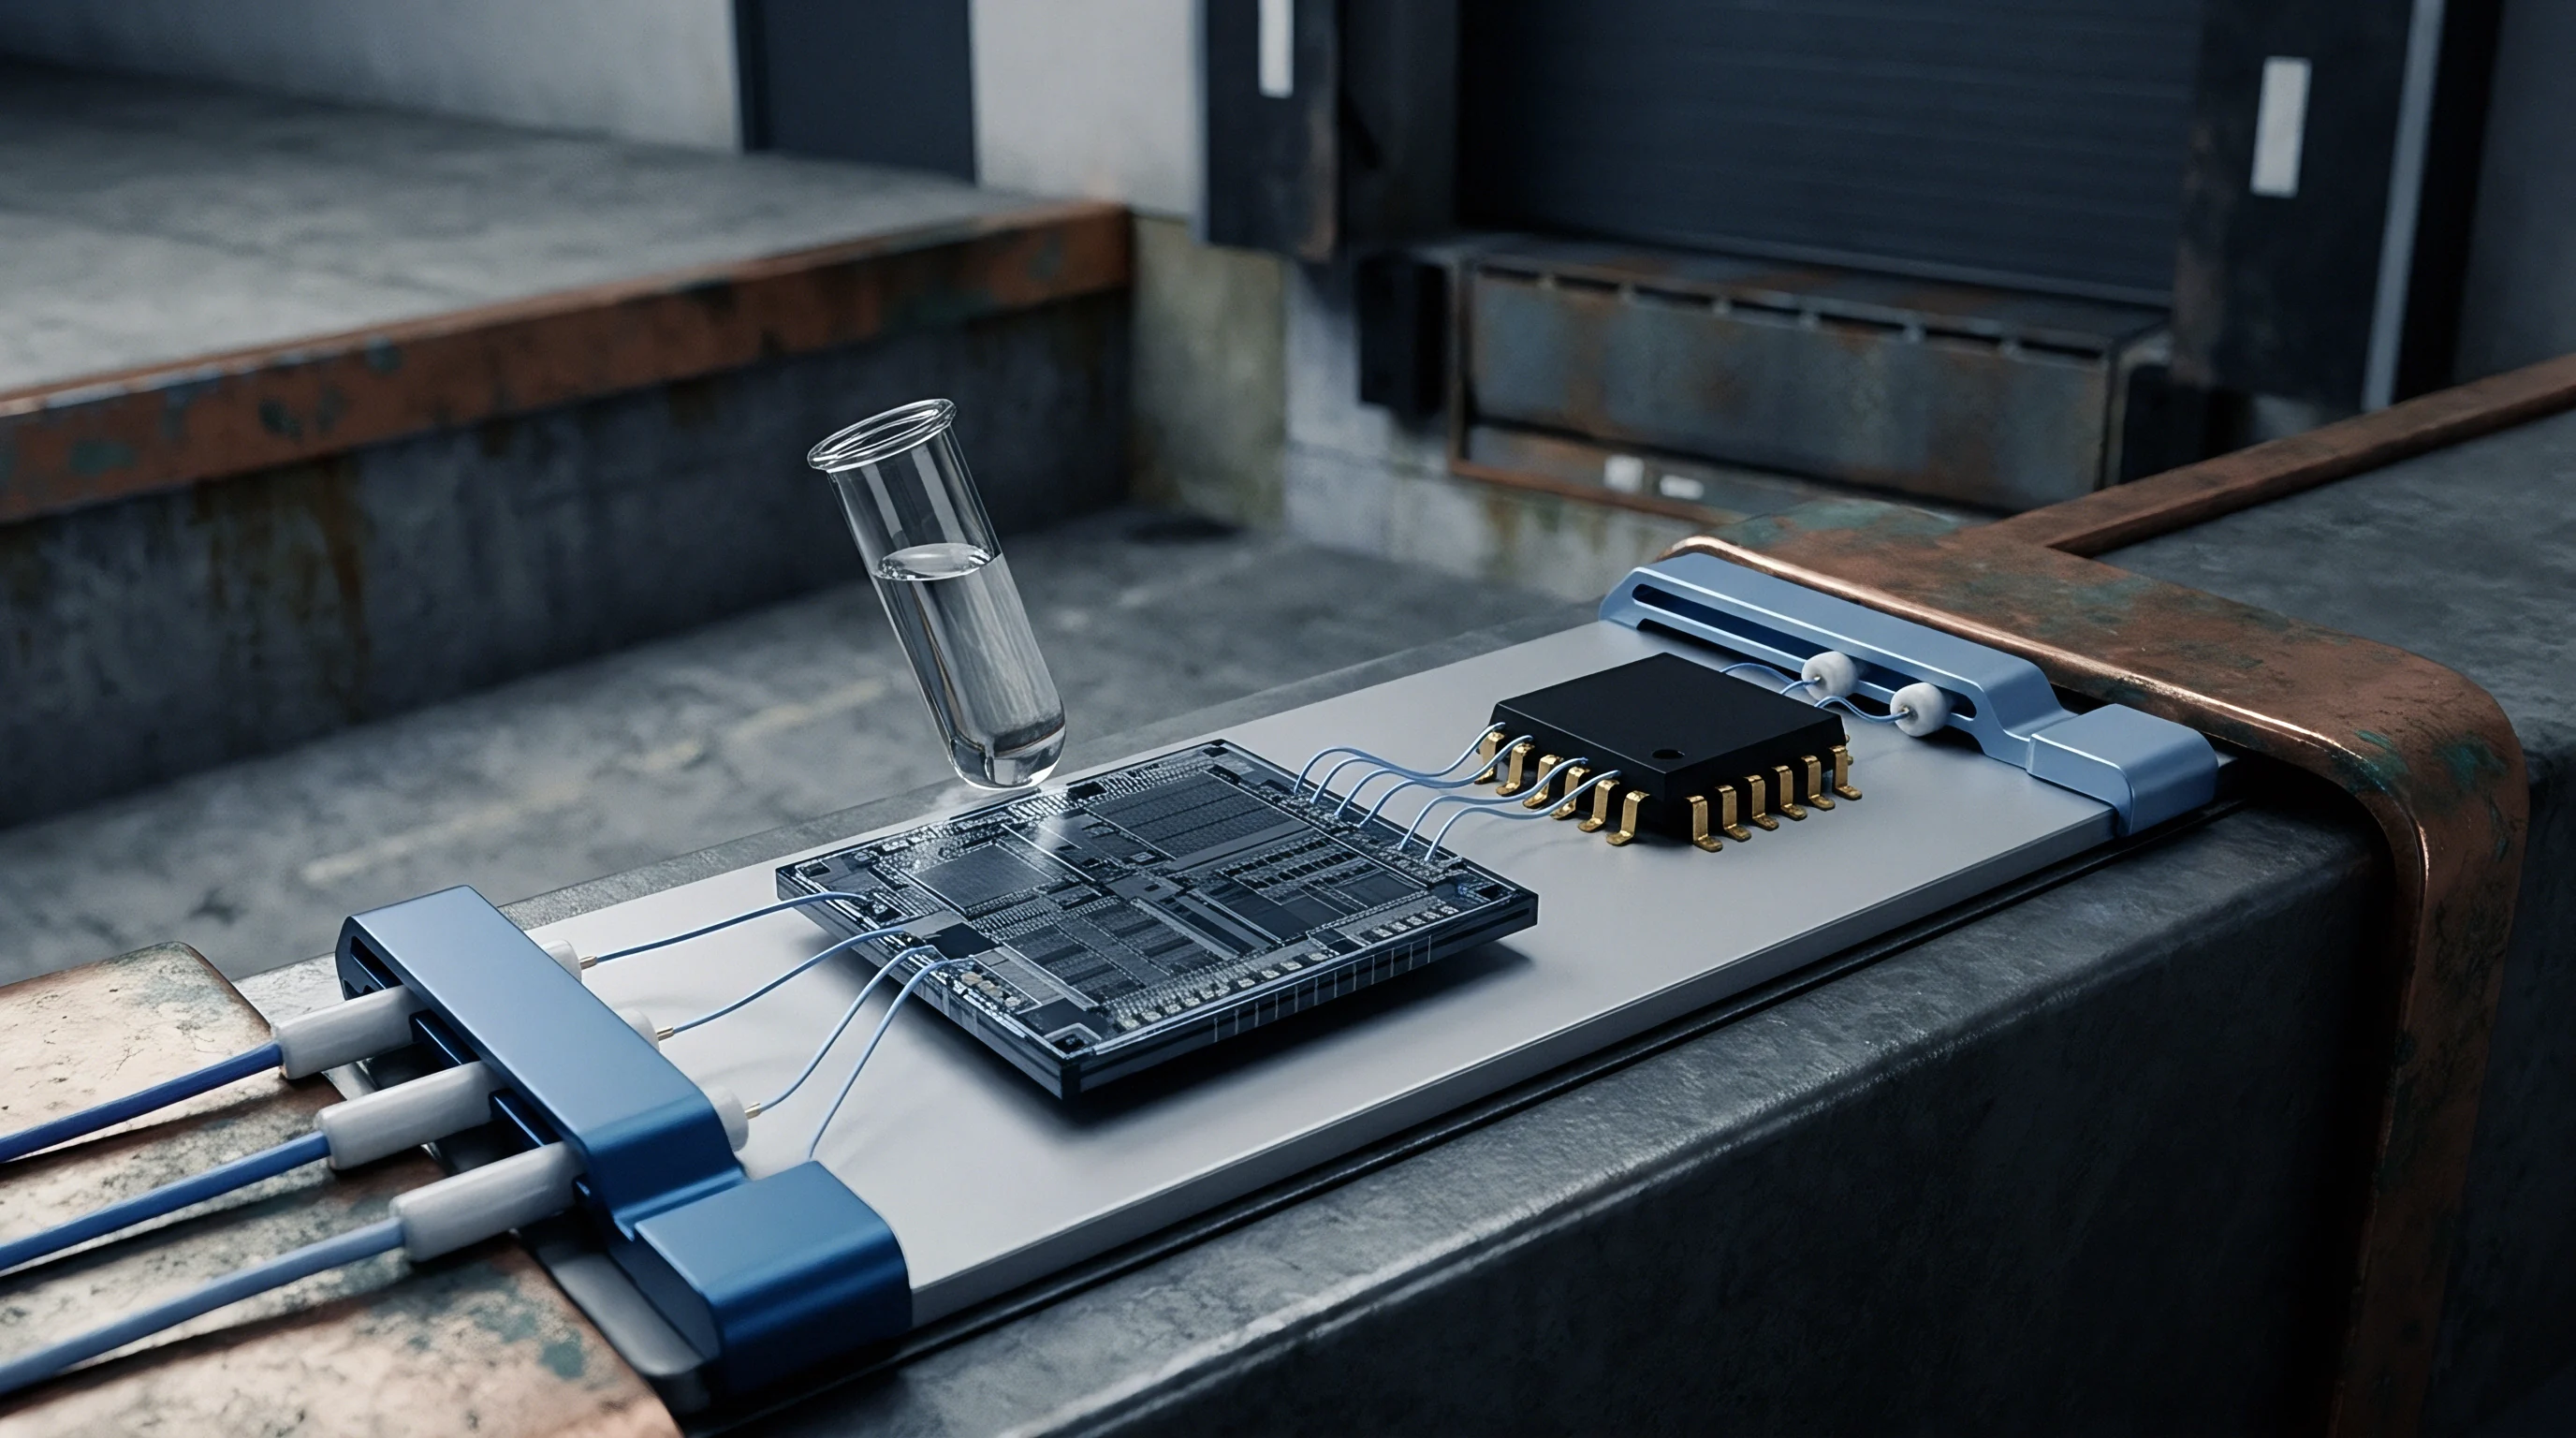
Resonant micro-tube flow meters operate by oscillating micro-machined channels at frequencies between two and thirty kilohertz, deriving mass flow from the phase difference between two points along the tube. At zero flow, this phase difference should be zero radians, but manufacturing tolerances introduce a slight structural asymmetry. Calibration accounts for this residual offset using firmware corrections set at twenty degrees Celsius.
Internal stress relaxation in silicon or metal tubes causes progressive drift over time. Running a micro-Coriolis tube at forty degrees Celsius alters its shear modulus and relaxes micro-strains left from anodic bonding or brazing. A phase drift of just fifty picoseconds translates to an apparent flow error of fifteen microliters per hour on a five-milliliter-per-hour sensor.
IEC 60751 Class A platinum sensors limit resistance tolerance, but mechanical packaging stress introduces zero shifts that exceed the intrinsic element error by an order of magnitude.
Packaging strain is the primary driver of long-term zero drift. Silicon micro-Coriolis dies bonded to glass sub-mounts with epoxy experience continuous shear stress from thermal expansion mismatches. Over three years, epoxy aging and thermal cycling relieve these stresses non-linearly, shifting the quiescent phase angle unpredictably.
While manufacturing annealing steps reduce initial burn-in drift, baseline movement continues throughout sensor life.
Thermal Mass Sensor Resistance Drift
Thermal anemometric and calorimetric micro-sensors depend directly on the stability of thin-film resistance elements. Platinum, nickel-iron, and polysilicon resistors experience gradual drift from grain boundary oxidation, electromigration, and substrate diffusion. A drift of just one-tenth of one percent in a single leg of a Wheatstone bridge produces a zero offset equal to five percent of full-scale flow.
| Sensor Architecture | Dominant Physical Cause | Typical Drift Rate (% FS per year) | Reversibility | Primary Mitigation Strategy |
|---|---|---|---|---|
| Silicon Micro-Coriolis | Glass-silicon bond stress relaxation | 1.2 to 2.8 | Irreversible | Low-temperature glass frit bonding |
| Thin-Film Platinum MEMS | Substrate grain boundary oxidation | 0.8 to 1.5 | Irreversible | Silicon oxide passivation layers |
| Capillary Stainless Tube | Heater coil adhesive creep | 1.5 to 3.5 | Partially Reversible | Direct laser-welded RTD elements |
| Polysilicon Membrane Calorimetric | Dopant migration under electrical field | 2.0 to 4.5 | Irreversible | Low drive currents below 2 mA |
| Optical Drop Counter | Thermal emitter luminance decline | 0.5 to 1.0 | Partially Reversible | Dual-detector balance schemes |
Electromigration inside thin-film tracks occurs continuously whenever current densities exceed ten thousand amperes per square centimeter. Operating micro-sensors at higher excitation voltages to boost signal-to-noise ratios accelerates this drift; reducing excitation voltage slows electromigration, but at the cost of signal resolution at low flow rates.

Audit
Incoming inspection must evaluate zero-point stability across expected thermal operating ranges before installing micro-dosing flow controllers in critical equipment. Datasheet specifications generally reflect controlled conditions at twenty-three degrees Celsius with zero differential pressure, whereas operational tools introduce fluid temperature shifts, ambient heat from servo drives, and fluctuating line pressures.
Verification Protocols and Setup Design
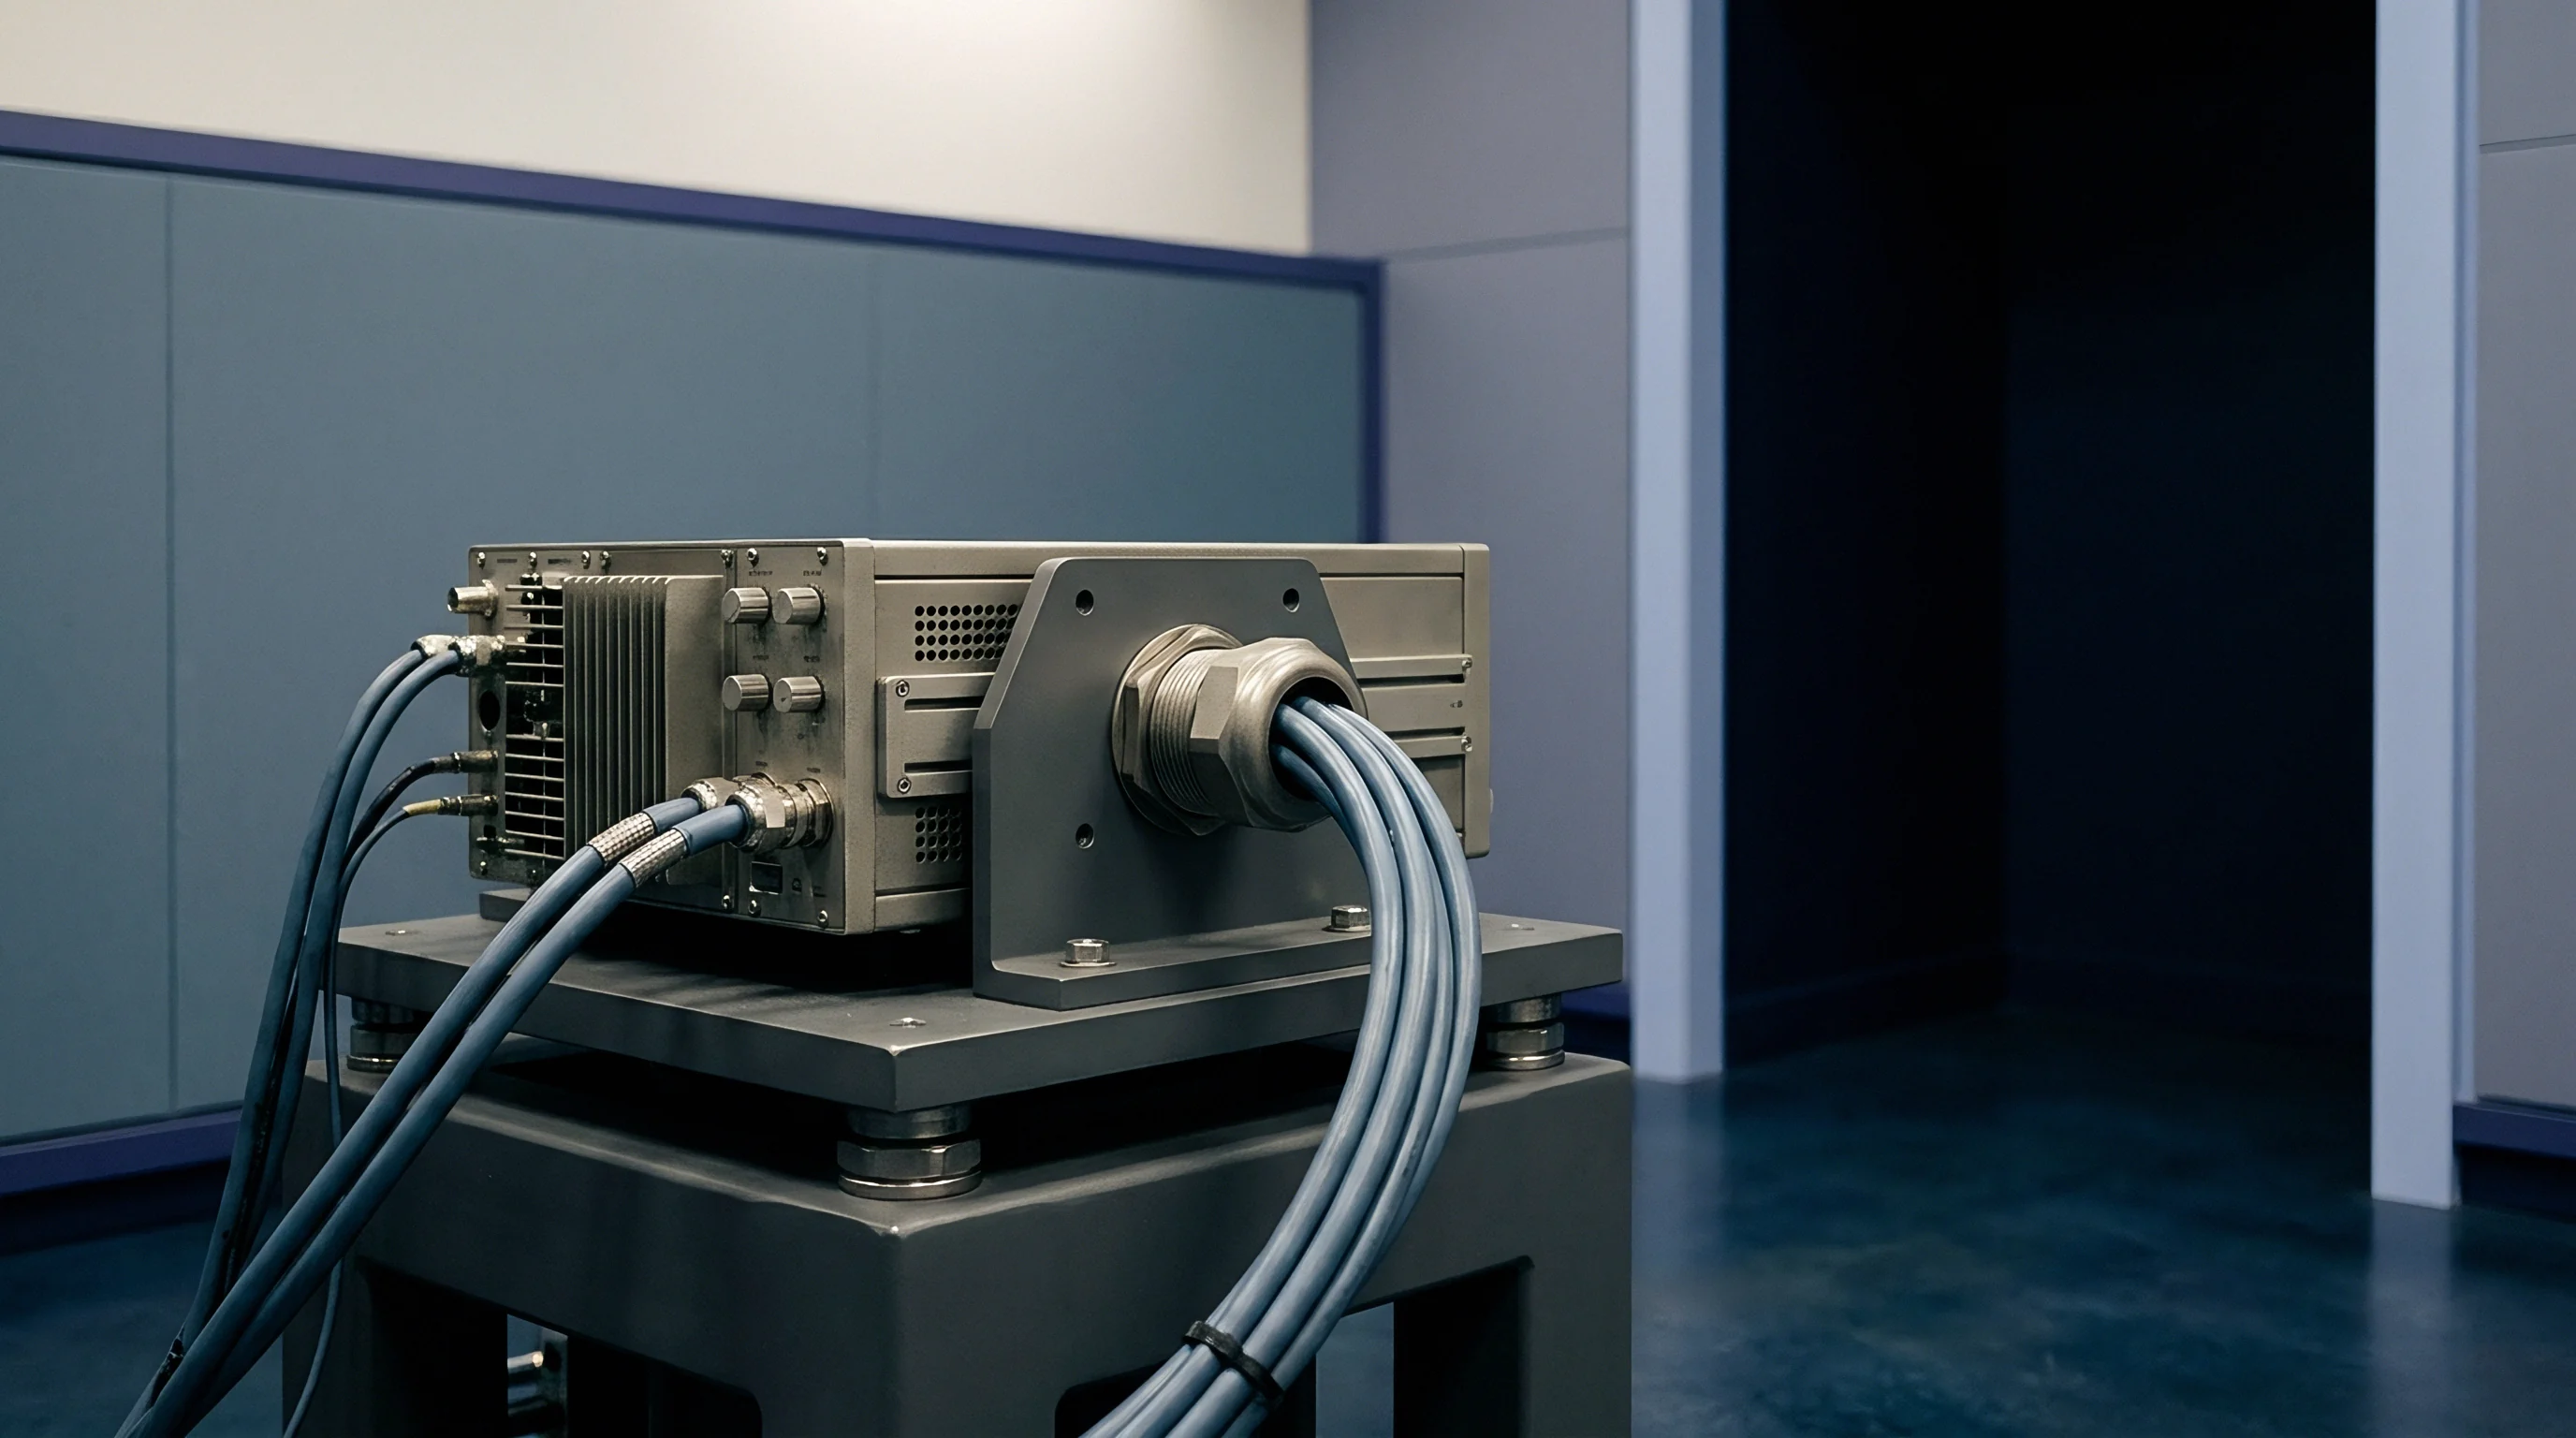
Evaluating micro-dosing meters requires environmental chambers and gravimetric reference balances to isolate the instrument from ambient drafts and mechanical vibration. Liquid lines should use rigid metal tubing rather than fluoropolymer tubing to prevent compliance and moisture permeability.
- Chamber Environmental Stabilization holds ambient temperature within fifty millikelvins for six hours without fluid flow to establish baseline noise levels.
- Isolation Valve Actuation isolates the sensor using zero-displacement pneumatic pinch valves upstream and downstream to eliminate hydraulic motion.
- Static Zero Offset Recording tracks differential voltage output across a twenty-degree Celsius thermal sweep at a rate of one-tenth of a degree Celsius per minute.
- Thermal Shock Injection introduces test fluid five degrees Celsius above chamber ambient to evaluate transient zero deviation and recovery time.
- Gravimetric Reference Comparison collects discharged fluid on an analytical balance with zero-point-one microgram resolution to verify mass balance against output signals.
Evaporative loss during micro-droplet collection can distort gravimetric measurements. Fitting an oil-sealed dynamic evaporation trap prevents loss of volatile test fluids during extended verification runs, ensuring micro-gram mass determinations remain valid.
Uncertainty Budgets in Micro-Flow Testing
Establishing traceable zero stability requires evaluating the combined standard uncertainty of the test bench under metrological standards. This budget must account for balance resolution, chamber temperature stability, fluid density changes, valve displacement artifacts, and digital quantization noise.
| Uncertainty Contribution | Source Distribution | Standard Uncertainty (μl/h) | Sensitivity Coefficient | Combined Uncertainty Share (%) |
|---|---|---|---|---|
| Gravimetric Balance Resolution | Rectangular | 0.85 | 1.0 | 18.5 |
| Evaporation Compensation Model | Normal (k=1) | 1.10 | 1.0 | 31.0 |
| Chamber Temperature Gradient | Rectangular | 0.92 | 1.2 | 25.8 |
| Pneumatic Valve Displacement | U-shaped | 0.65 | 1.0 | 10.8 |
| A/D Converter Quantization Noise | Rectangular | 0.40 | 1.0 | 4.1 |
| Fluid Density Temperature Correction | Normal (k=1) | 0.62 | 1.0 | 9.8 |
| Combined Expanded Uncertainty (k=2, 95% Confidence Level) | 3.96 μl/h | |||
While SEMI E56 defines standard test methods for gas mass flow controllers, applying its framework to micro-dispensing liquids requires documenting temperature coefficients across the complete operating envelope. Referencing SEMI E56 calibration in contracts without defining specific liquid properties leaves zero-drift specifications effectively unenforceable.
Exposure
Uncorrected zero drift leads directly to scrapped production lots, frequent line recalibrations, and warranty liabilities. In high-precision dispensing ~ such as semiconductor photoresist application, pharmaceutical fill-finish operations, and battery electrolyte injection ~ small flow measurement errors alter chemical ratios, introducing systematic dosing volume errors across entire production runs.

Economic Impact of Dosing Inaccuracies
In semiconductor photolithography, dispensing chemical-mechanical planarization slurries or spin-on dielectrics often uses five hundred microliters of fluid per wafer at four dollars per milliliter. A thermal zero shift of twenty microliters per hour on a sensor in continuous recirculation creates a persistent dosing bias between operational steps.
For an automated battery cell facility operating twenty-four lines with four dosing stations each ~ running continuously to yield thirty thousand units per station monthly ~ a baseline drift of three percent moves chemical concentrations out of specification. At a nominal dispense volume of one hundred microliters, a three-microliter over-dispense consumes an extra eighty-six liters of high-purity chemical annually across the plant, representing three hundred and forty thousand dollars in wasted material.
A three percent baseline zero shift during electrolyte filling wastes hundreds of thousands of dollars in high-purity materials across a single manufacturing facility.
When drift causes under-dosing rather than excess delivery, costs escalate even faster. Under-dosed battery cells fail internal resistance and capacity checks during final qualification. Scrapping twenty production lots for deficient active material impacts operating margins far beyond the cost of the flow sensor itself, as a deviation of just two microliters can create irreversible electrochemical imbalances in lithium pouch cells that trigger end-of-line rejection.

Lifecycle Recalibration and Replacement Strategy
Selecting micro-flow controllers purely on initial purchase price overlooks the ongoing expense of frequent recalibration. Sensors sensitive to thermal shifts often require automated zeroing routines before each cycle, necessitating upstream and downstream high-integrity shut-off valves that add dead volume, system complexity, and potential failure points.
- Automated Tare Cycling Overhead stops production lines for thirty seconds every hour, amounting to over seventy hours of lost machine availability per year.
- Secondary Reference Meter Validation requires offline calibration carts with gravimetric balances, adding labor costs and third-party certification fees.
- Periodic Sensor Replacement Cycles incur hardware replacement costs, technician labor, and system decontamination every eighteen months.
- Scrap Disposal Costs rise sharply when out-of-spec chemical or pharmaceutical batches require hazardous waste disposal instead of standard drainage.
Choosing micro-machined Coriolis sensors with active temperature compensation and reduced strain sensitivity carries a sixty percent price premium, but that upfront cost typically pays back within nine months by extending required recalibration intervals from three months to eighteen months. Skipping thermal zero-shift verification during component qualification simply shifts that financial risk onto end-of-line production yields.