Initial Thermal Analysis Calibration Standards for Electronic Encapsulation
Initial thermal calibration for electronic encapsulants requires high-purity metal standards, dynamic lag corrections, and verified uncertainty budgets.


Purity
Calibration of thermal analysis instruments for electronic encapsulants depends on reference materials certified by national metrology institutes. High-purity metals serve as primary fixed points on the International Temperature Scale of 1990 (ITS-90). Indium provides the primary anchor.
Certified standard reference materials deliver a melting point of 156.598 degrees Celsius and an enthalpy of fusion equal to 28.45 Joules per gram. Mercury, water, tin, lead, and zinc complete the multi-point calibration ladder spanning minus fifty to four hundred degrees Celsius.
Metallic reference standards require chemical purity exceeding 99.999 percent by mass. Trace impurities alter the solidus-liquidus equilibrium curve, depressing the observed onset temperature and broadening the melting transition width. The van ‘t Hoff equation describes how minute solute fractions degrade temperature sharpness based on the mole fraction of impurities and the molar heat of fusion.
Contamination by iron, copper, or lead in an indium standard alters the sharp phase transition into a extended melting range, introducing systemic negative bias into temperature readings.
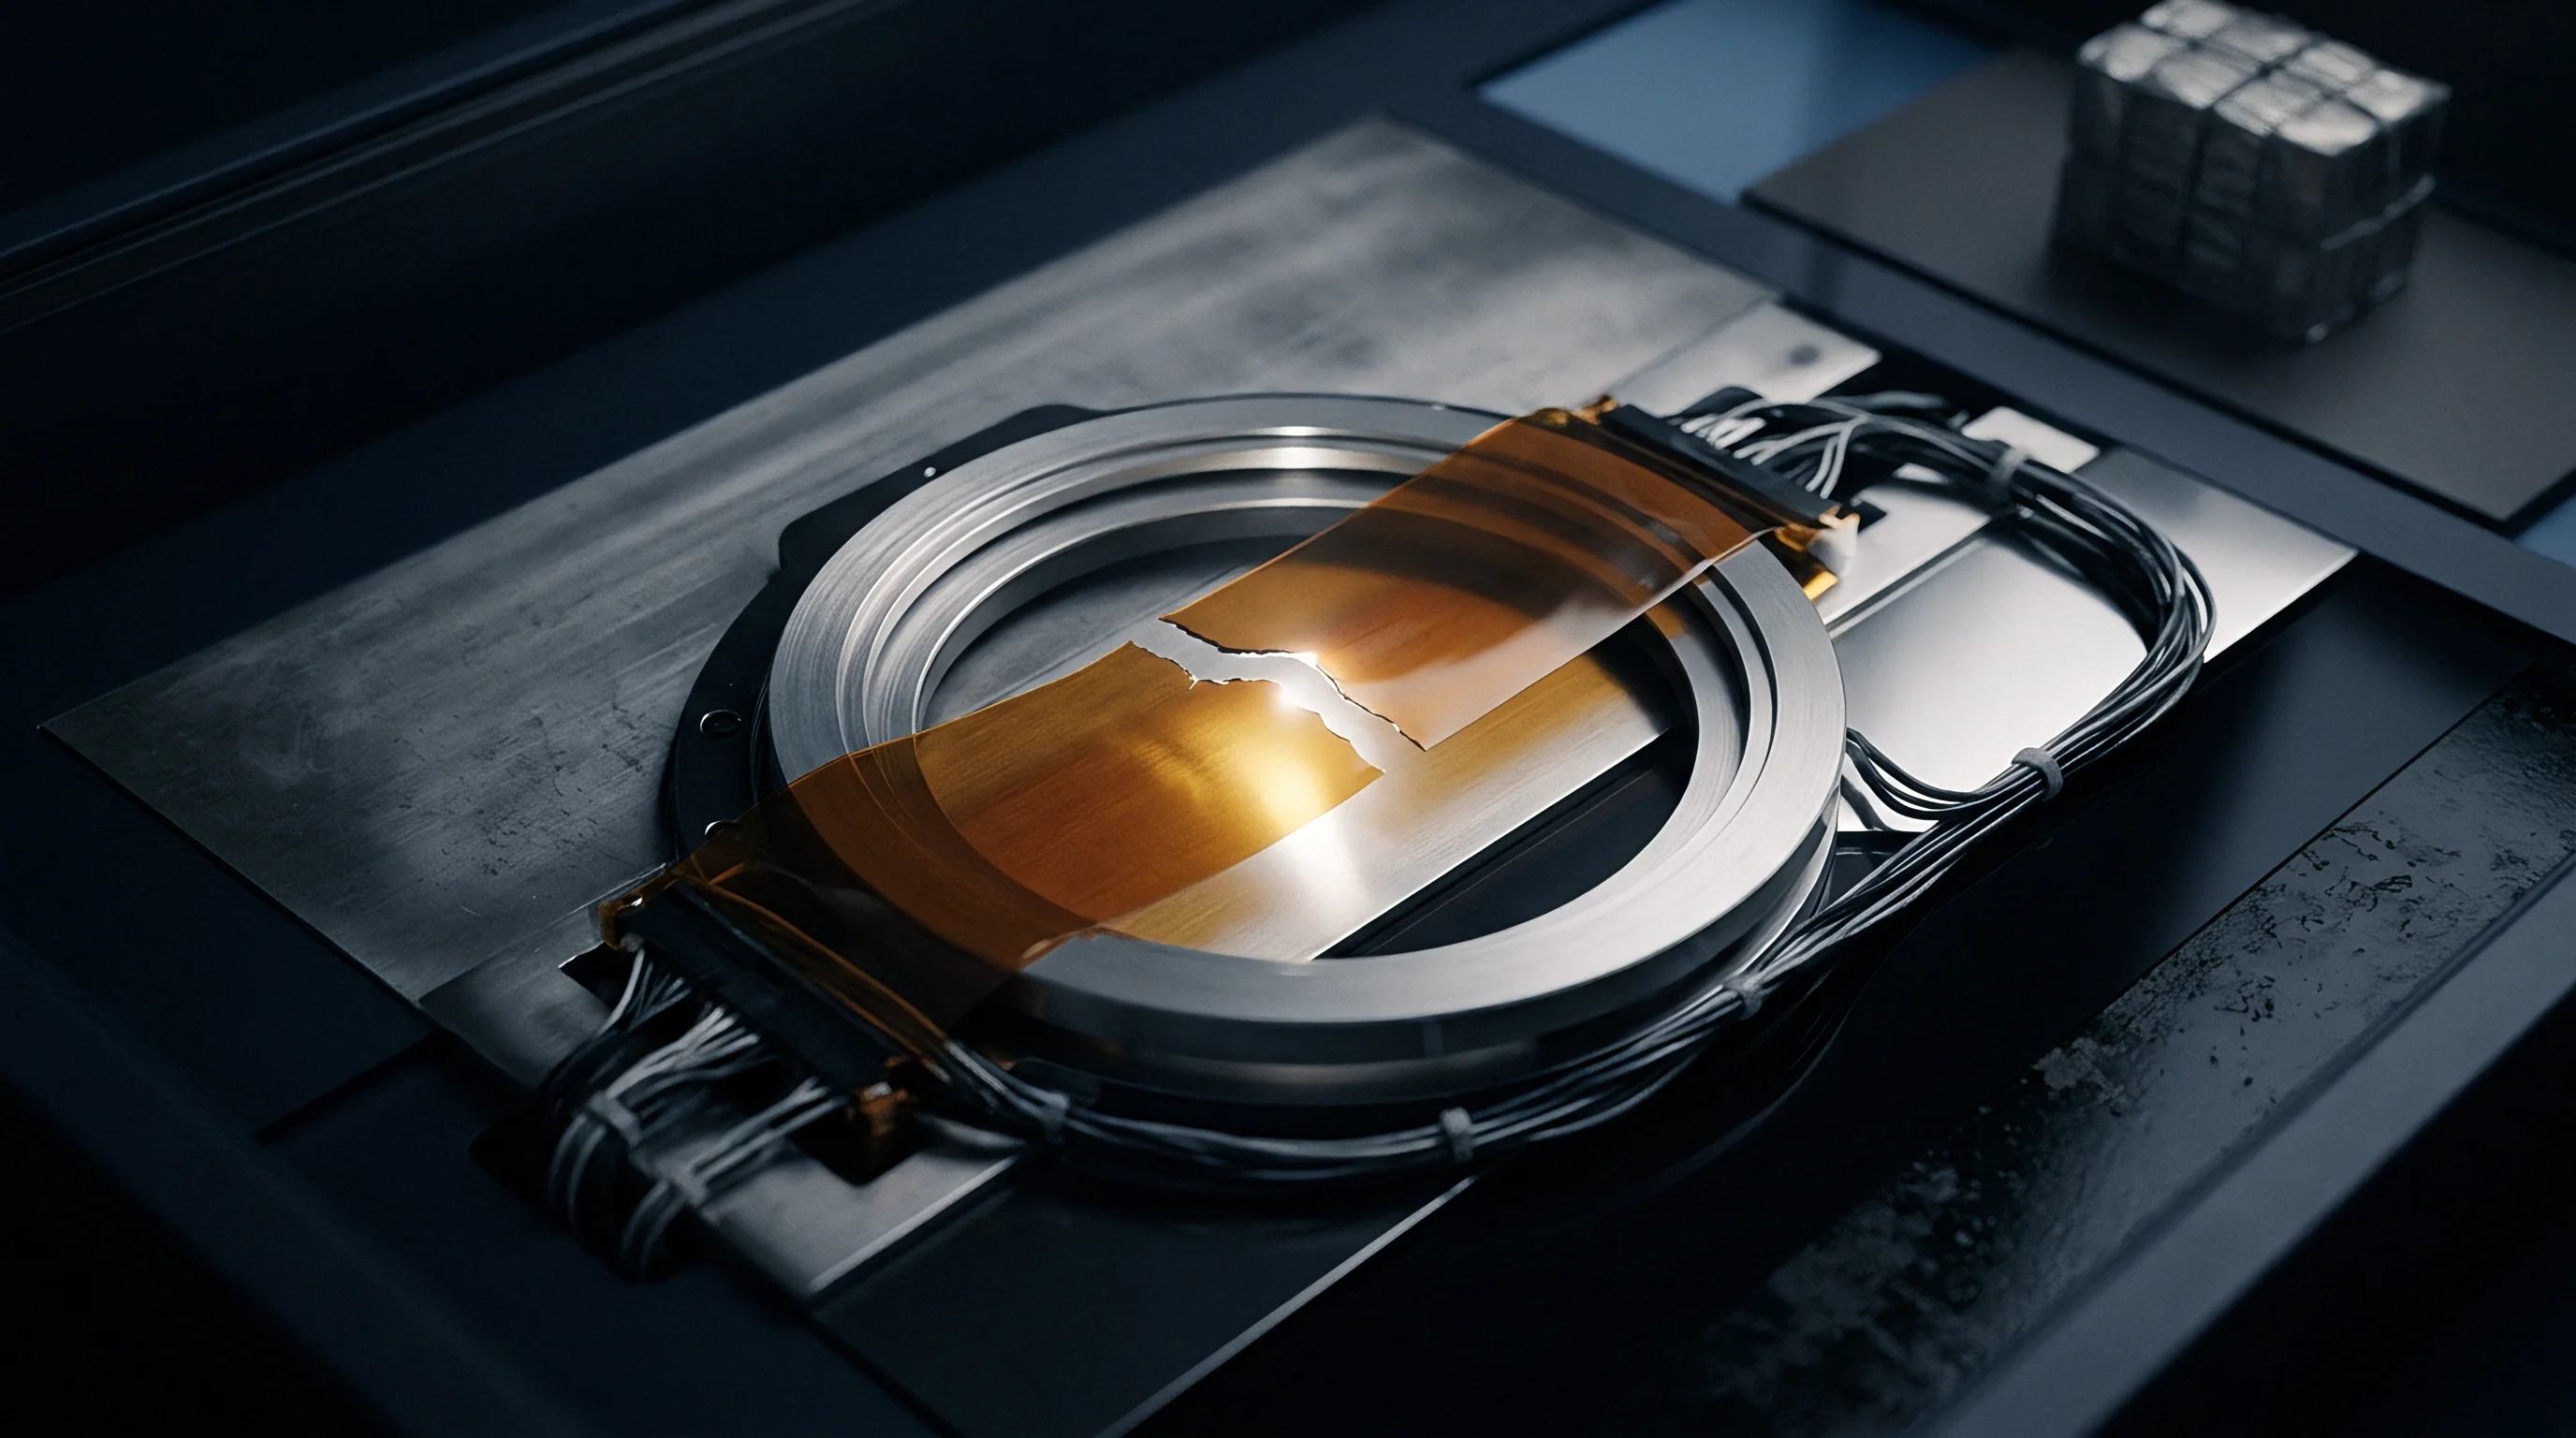
Temperature Onset Accuracy and Enthalpy Traceability
Differential scanning calorimeters measure heat flow into epoxy molding compounds during polymerization. Verification of heat flux sensors relies on comparing the measured enthalpy of fusion against certified enthalpy standard reference materials. Indium reference standards exhibit an uncertainty of plus or minus 0.2 Joules per gram.
Synthetic sapphire, comprising high-purity single-crystal alpha-alumina, serves as the primary standard for heat capacity calibration across extended temperature sweeps. Uncertified standards introduce hidden bias.
Certified reference indium melted under pure nitrogen at two degrees per minute establishes the thermal onset point within plus or minus 0.05 degrees Celsius.
Reference Metal Degradation in High Temperature Purge Cycles
Standard reference metals experience surface oxidation when purge gases contain residual oxygen. Repeated heating of tin or lead calibration standards above their melting points in unpurged chambers generates surface dross. Oxide skins insulate the metallic core, creating thermal contact resistance against the aluminum sample pan.
This oxidation shifts the apparent onset to higher temperatures and distorts peak symmetry. Thermal analysis cells maintain inert atmospheres using dry nitrogen or argon with oxygen concentrations kept below five parts per million.
The long-term thermodynamic stability of multi-component metallic eutectics under repeated thermal cycles remains an open question for laboratories operating continuous resin characterization lines.
Flux
Dynamic temperature calibration accounts for energy transport rates between the heating block, sample pan, and encapsulant specimen. Differential scanning calorimetry cells operate under non-isothermal conditions where thermal lag creates a temperature offset between the program temperature sensor and the actual sample temperature. Thermal lag scales with rate.
Faster heating rates increase the temperature gradient across the furnace cell, pushing measured reaction peak onsets toward higher readings.

Dynamic Thermal Lag Corrections for High Rate Testing
Test protocols for thermosetting resins run at ramps from two to twenty degrees per minute. Dynamic calibration matches the instrument response function to the experimental heating rate. Running a single-point temperature calibration at ten degrees per minute while testing mold compounds at twenty degrees per minute introduces a systematic thermal offset of approximately one to two degrees Celsius.
Liquid nitrogen purges remove moisture. Multi-rate calibration curves derive the thermal lag time constant, expressed in seconds, allowing mathematical correction of dynamic thermal signals.
| Heating Rate (K/min) | Indium Onset Observed (°C) | Thermal Lag Time Constant (s) | Peak Width at Half Height (°C) |
|---|---|---|---|
| 1.0 | 156.62 | 1.8 | 0.45 |
| 5.0 | 156.88 | 1.9 | 0.72 |
| 10.0 | 157.25 | 2.1 | 1.15 |
| 20.0 | 158.05 | 2.3 | 1.88 |
Execution of dynamic multi-rate calibration requires a strict operational sequence to establish accurate time constants across sample pan configurations.
- Clean the cell sensor disk with solvent and execute a high-temperature thermal bake to eliminate organic residues.
- Place a fresh five-milligram high-purity indium standard inside a crimped aluminum sample pan.
- Purge the sample cell with dry nitrogen at fifty milliliters per minute for twenty minutes prior to heating.
- Execute thermal scans at heating rates of two, five, ten, and twenty degrees per minute.
- Calculate the extrapolated onset temperature and thermal resistance constant for each ramp speed.

Sample Pan Resistance and Enthalpy Symmetry
Aluminum sample pans pressed with uneven flat bases introduce asymmetric thermal contact. Air pockets trapped between the pan bottom and the thermoelectric sensor disk introduce localized thermal resistance. This resistance distorts peak symmetry during glass transition and cross-linking exotherms.
Baseline shift distorts the calculation. Sapphire calibrates heat capacity directly. Using hermetically sealed aluminum pans eliminates volatile mass loss while standardizing pan-to-sensor contact geometry.
Calibration sample mass ought to match the test specimen mass within narrow boundaries to equalize internal thermal gradients.
Positioning sample pans precisely on cell sensor nodes ensures balanced thermal flux across reference and sample channels.


Dilatometry
Thermomechanical analysis measures dimensional changes in cured encapsulants across thermal cycles. Initial calibration of thermomechanical analysis instruments establishes transducer sensitivity, system compliance, and probe expansion characteristics. High-density microelectronic packaging relies on accurate determination of the coefficient of thermal expansion below glass transition and above glass transition.
Errors in probe expansion calibration alter package stress modeling calculations.

Probe Force Verification and Expansion Baseline Subtraction
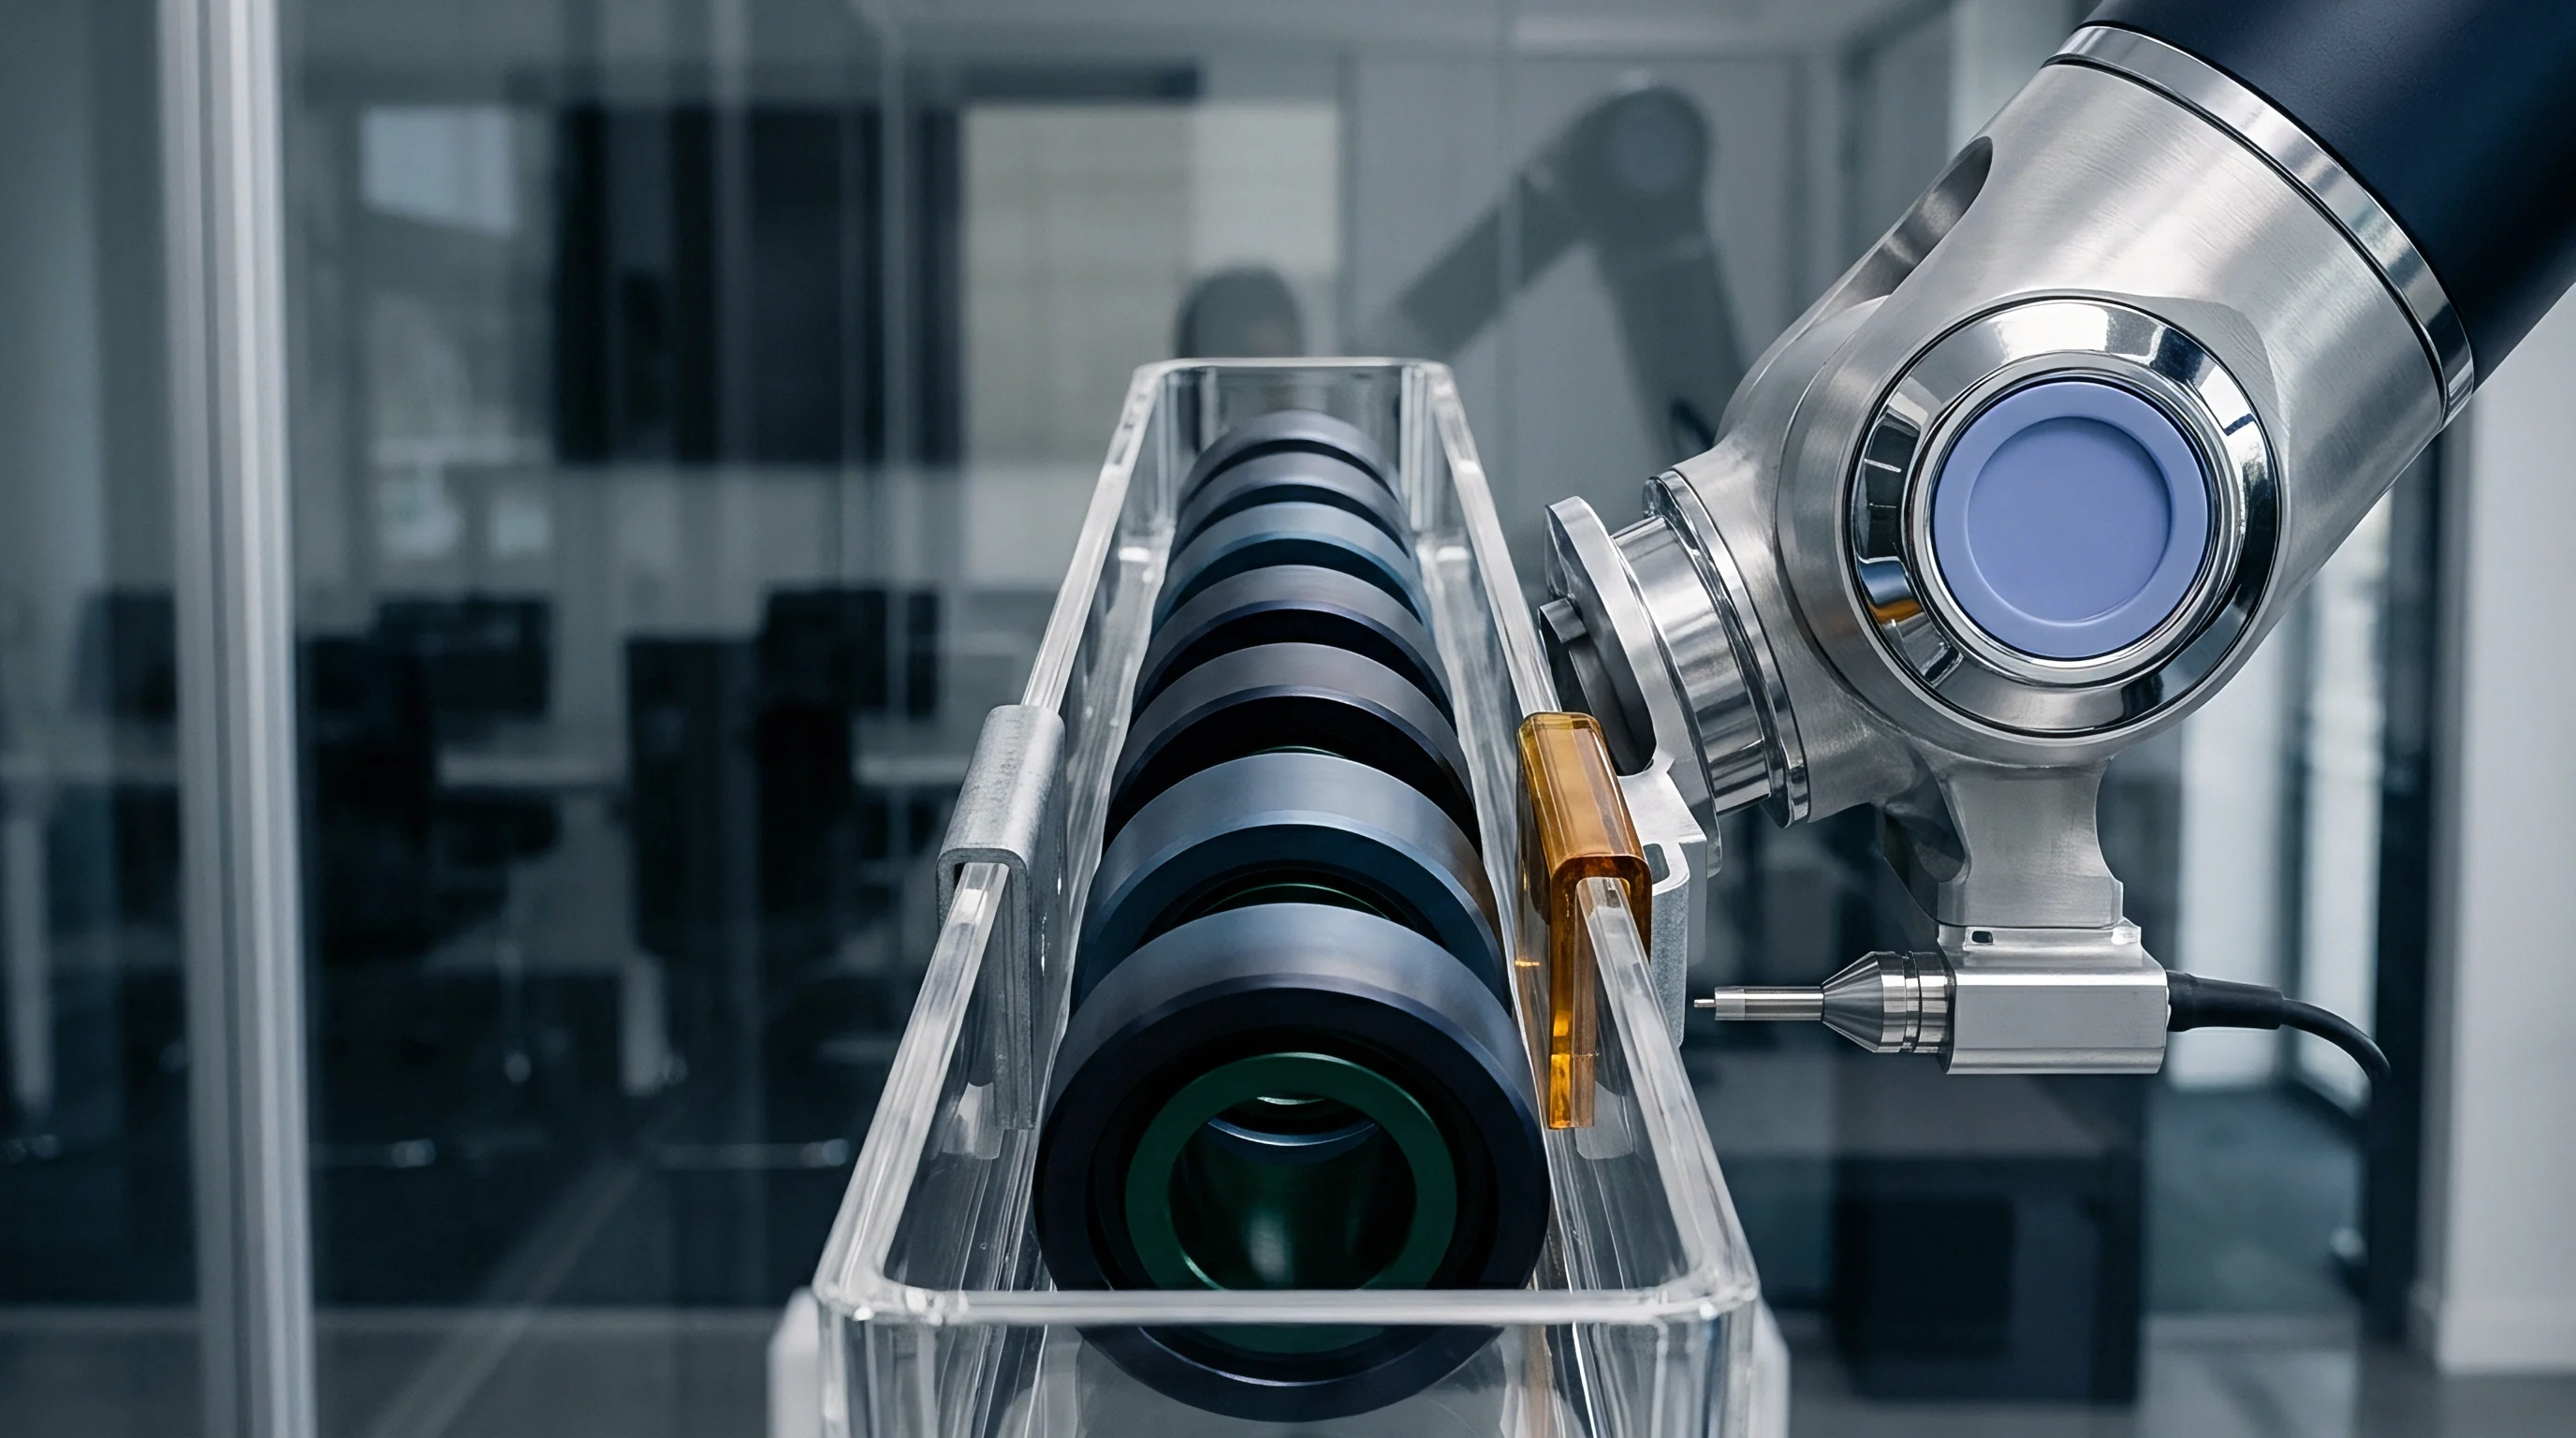
Contact force applied by quartz probes distorts dimensional signals near softening transitions. Probe force calibration utilizes calibrated dead-weight masses to adjust the electromagnetic force motor across zero point zero one to zero point one Newton force ranges. Softening resins deform under load.
Excess force causes the probe to penetrate into the encapsulant matrix during glass transition, yielding artificially low glass transition values and negative apparent expansion coefficients. Instrument compliance baseline runs using zero-expansion quartz reference blocks isolate machine expansion from specimen response.
Glass Transition Resolution in Filled Epoxy Compounds
Silica-filled mold compounds present subtle change slopes above eighty degrees Celsius. Thermal expansion calibration standards include fused silica, high-purity aluminum, and single-crystal sapphire reference specimens certified under standardized dilatometric protocols. Fused silica delivers an ultra-low linear coefficient of thermal expansion of 0.55 multiplied by 10 to the power of minus six per Kelvin between room temperature and two hundred degrees Celsius.
Standardizing specimen geometry ensures uniform heat distribution through the specimen thickness.
Standard ASTM E2113 specifies quartz reference calibration for TMA displacement transducers, imposing baseline subtraction to prevent mechanical compliance artifacts.
Failure to subtract structural instrument expansion yields false coefficients of thermal expansion, causing miscalculated solder joint stress and unexpected package delamination during field thermal cycling.

Contamination
Polymeric encapsulants release low-molecular-weight siloxanes, photoinitiators, and plasticizers during thermal execution. Volatile outgassing products deposit on furnace walls, optical windows, and internal sensor nodes. Thermal analyzer cells operating without proper exhaust ventilation accumulate organic condensation.
Volatile organics coat the furnace. Cleaning cycles restore sensor response.

Sensor Drift Driven by Volatile Resin Outgassing
Deposits accumulating on thermocouple disk assemblies degrade thermal conductivity paths. Sensor degradation manifests as zero-point drift, baseline slope distortion, and loss of heat flow sensitivity. Drift degrades repeatability over time.
Exposure to outgassing vapors shifts calibration curves continuously across operational sequences.
| Cumulative Exposure Runs | Baseline Offset Drift (µW) | Indium Onset Temperature Shift (°C) | Enthalpy Measurement Error (%) |
|---|---|---|---|
| 0 | 0.12 | 0.00 | 0.10 |
| 100 | 1.45 | 0.18 | 0.65 |
| 250 | 4.80 | 0.42 | 1.85 |
| 500 | 12.30 | 1.15 | 4.40 |
How Does Sensor Contamination Alter Enthalpy Baselines?
Condensation across cell surfaces creates uneven heat loss channels during linear temperature ramps. Non-uniform surface emissivity alters radiant thermal transfer inside the furnace cavity. This imbalance skews the differential signal, shifting heat capacity baselines.
Regular thermal cleaning cycles, comprising high-temperature bakes at five hundred degrees Celsius under pure oxygen purge, vaporize organic residue.
- Thermocouple Junction Corrosion degrades signal transmission, generating high-frequency thermal noise and broad peak broadening during resin melting scans.
- Quartz Probe Condensation increases mechanical friction within TMA guidance bearings, resulting in stick-slip height reading artifacts.
- Purge Gas Vent Blockage restricts volatile evacuation, forcing resin outgassing vapors into cold furnace zones and electronic housing assemblies.
- Furnace Emissivity Drift distorts radiative heating symmetry, causing non-linear baseline curvature across high-temperature sweeps.
Equipment vendors frequently attribute baseline curvature shifts to customer sample preparation flaws, dismissing internal sensor corrosion.


Dossier
Quantifying overall measurement uncertainty requires combining calibration uncertainties, baseline instability, and sample preparation variability. Measurement uncertainty budgets built according to accredited metrological frameworks establish confidence intervals for critical encapsulant parameters. Margin dictates the acceptance boundary.
Electronics qualification protocols demand traceable verification chains for glass transition temperature, coefficient of thermal expansion, and cure enthalpy.

Uncertainty Budgets for Epoxy Molding Compound Qualification
Component evaluations under automotive standards demand verified boundaries for physical parameters. Standard reference materials provide certified values with expanded uncertainties at a coverage factor of k equals two, corresponding to a ninety-five percent confidence interval. Constructing an uncertainty budget requires evaluating each contributing element independently.
| Source of Uncertainty | Standard Uncertainty u(x) (°C) | Probability Distribution | Sensitivity Coefficient | Combined Contribution (°C) |
|---|---|---|---|---|
| Primary Standard (Indium SRM 2232) | 0.03 | Normal | 1.0 | 0.030 |
| Thermal Lag Calibration Residuals | 0.12 | Rectangular | 1.0 | 0.069 |
| Instrument Baseline Repeatability | 0.15 | Normal | 1.0 | 0.150 |
| Sample Mass Variation (5 ± 0.5 mg) | 0.08 | Rectangular | 1.0 | 0.046 |
| Operator Tangent Selection | 0.25 | Normal | 1.0 | 0.250 |
| Combined Expanded Uncertainty (k = 2): ±0.61 °C | ||||
Combined expanded uncertainty calculations demonstrate that human operator tangent selection and baseline stability represent the largest contributors to overall measurement variability. Systematic automated derivative curve fitting reduces operator-dependent variations during glass transition assignments.
- Traceable Certificate Verification confirms reference materials hold active ISO/IEC 17025 accredited calibration documentation showing unbroken metrological chains.
- Dual-Point Temperature Calibration bounds instrument operational range using fixed reference points above and below targeted resin transition temperatures.
- Baseline Drift Verification establishes daily baseline flatness criteria prior to running critical material qualification samples.
- Purge Gas Mass Flow Calibration validates gas flow rates within five percent of targeted volumetric specifications to guarantee consistent cell atmospheres.
Thermal analysis certificates without documented expanded uncertainties fail to provide legally defensible proof of material specification compliance.

Laboratory Accreditation Boundaries and Re-Calibration Cycles
Accredited facilities establish recalibration schedules based on operational hours and purge gas exposure. ISO/IEC 17025 laboratory accreditation scopes require demonstrated competence in thermal analysis techniques, including annual verification of primary calibration standards. Re-calibration schedules follow empirical drift data.
Standard ASTM E1363 section eight mandates annual recalibration of temperature scales using primary reference materials, changing vendor acceptance compliance from self-declaration to audited traceability.