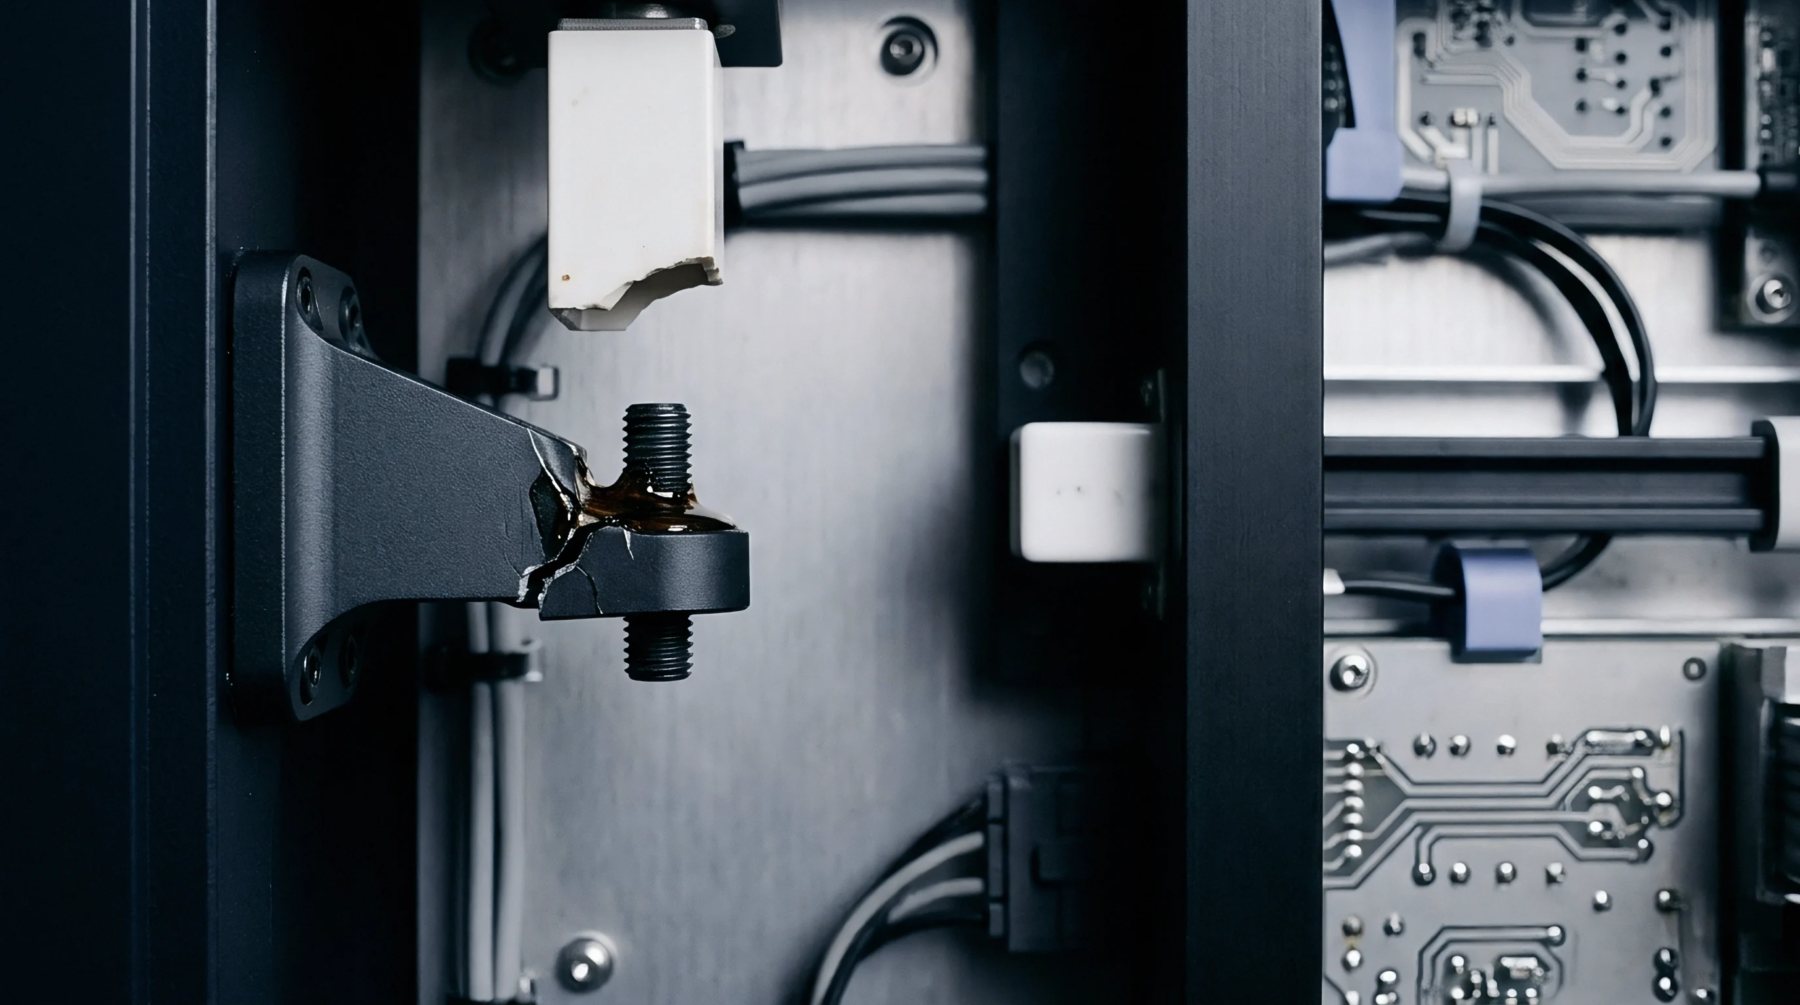
Structural Correlation
Geometric configuration mapping provides the physical basis for predicting component performance under load. Structure function analysis quantifies these spatial arrangements to determine how mechanical integrity responds to external force. Engineers derive these values from raw thermal transient data to map the internal architecture of a semiconductor package.
Discontinuities in the thermal path correspond to physical interfaces or material junctions within the assembly.
Calibration Precision
Measurement accuracy depends on the conversion of transient thermal resistance into a spatial map of heat capacitance and thermal resistance. Instrumentation requires high sampling rates to capture early time data points where the heat flux resides closest to the silicon die. Any noise at the start of the recording produces significant distortion in the calculated structural geometry.
Technicians minimize these errors by utilizing high-bandwidth sensors that detect sub-microsecond variations during cooling or heating cycles. External thermal resistance from the heat sink environment acts as a parasitic signal that mask findings if the reference cooling conditions remain unstable.
Performance Verification
Standards for this method rely on consistent boundary conditions during the test interval. Repeatable outcomes emerge when the ambient air temperature and air velocity stay within narrow limits during the measurement sequence. A thermal path with low thermal resistance allows heat to move efficiently from the source to the sink.
Higher resistance values indicate potential failures like delamination or air voids within a bonding layer. Proper verification confirms the device architecture matches the intended design specifications without requiring invasive physical cross-sectioning of the component.
Interface Sensitivity
Sensitivity of the thermal path depends on the temperature difference between the active junction and the exterior case. Signal processing algorithms calculate the derivative of the thermal response to locate each transition between dissimilar materials. Small variations in material density show as distinct peaks or valleys in the final plot.
This technique identifies subtle deviations in heat path composition that standard electrical testing fails to detect. Quantitative accuracy remains limited by the thermal model applied to the specific layer sequence. Analysis of the thermal impedance curve delivers a non-destructive estimate of the internal physical state of the device.