Thermal Coefficient Mapping for Vacuum Encapsulated MEMS Resonators
Vacuum-encapsulated MEMS resonators require high-order polynomial thermal mapping to correct intrinsic silicon softening and anchor-induced packaging stress.

Shift
Anchor Behavior in Variable Temperature Environments
A single-crystal silicon resonator sealed in an ultra-high vacuum cavity exhibits an intrinsic uncompensated temperature coefficient of frequency between negative twenty-eight and negative thirty-two parts per million per Kelvin. The temperature coefficient of Young’s modulus in pristine silicon dictates this negative drift across the industrial operating span of negative forty to positive eighty-five degrees Celsius. Testing an ovenized crystal or a calibrated MEMS reference on an automated bench highlights the gap between datasheet specifications and true system behavior: thermal hysteresis, package-induced stress gradients, and cavity gas desorbed during bake-out pull the expected cubic polynomial of silicon resonance into an uncorrected curve that defeats ten-bit digital compensation networks.
Thermal mapping isolates raw lattice elasticity changes from boundary condition shifts. In an electrostatically driven double-ended tuning fork or breathing-ring resonator, the electrostatic spring softening effect alters effective stiffness through the bias voltage and transducer gap. Because the transducer gap contracts or expands with the thermal movement of the anchor points, the electrostatic softening parameter carries its own temperature coefficient.
The raw resonant frequency follows a composite relation governed by silicon elasticity, device geometry, anchor stress relaxation, and electrostatic tuning:
f(T) = f0 (1 + TCF1 (T – T0) + TCF2 (T – T0)^2 + TCF3 (T – T0)^3)
The first-order term TCF1 dominates baseline drift, operating around negative thirty parts per million per Kelvin in p-type silicon doped below 10^16 atoms per cubic centimeter. The second-order term TCF2 contributes negative twenty to negative forty parts per billion per Kelvin squared, while TCF3 introduces higher-order curvature across wide military ranges from negative fifty-five to positive one hundred twenty-five degrees Celsius. Left uncompensated, an unmapped resonator drifts by more than three thousand seven hundred parts per million over a standard industrial sweep, instantly breaking synchronous clocking tolerances in downstream communication interfaces.
Thermal coefficient mapping establishes the deterministic polynomial coefficients of the mechanical resonator alongside its co-integrated temperature sensor before packaging stress disrupts the boundary conditions.
Package stress from die-attach adhesives and ceramic leadless chip carrier headers induces an extrinsic mechanical strain across the anchoring footings. When eutectic gold-silicon or copper-copper bonding seals the vacuum cap at temperatures exceeding three hundred degrees Celsius, the post-cooling residual stress distribution is asymmetric. Distinguishing the intrinsic silicon temperature coefficient of frequency from package deformation vectors requires an initial low-power drive sweep inside a variable-temperature liquid nitrogen or Peltier thermal chamber.
That initial characterization run identifies three primary stress points: die-attach curing contraction, cavity cap thermal expansion mismatch, and wire-bond pad mechanical shear. Single central anchor designs isolate extrinsic thermal strain cleanly from the resonant beams. Dual-anchor geometries, by contrast, force packaging stress directly through the beam axis, shifting TCF1 by as much as three to five parts per million per Kelvin across different production lots.
Skipping this extraction step leaves downstream application firmware unable to correct for batch-level assembly variations.

Cavity
Molecular Flow and Viscous Damping Regimes
Vacuum encapsulation preserves high mechanical quality factors by eliminating viscous air damping. A micromachined beam operating at atmospheric pressure experiences squeeze-film damping that collapses its quality factor below two hundred. Evacuating the encapsulation chamber shifts the acoustic dissipation regime from viscous fluid flow, through the transition zone, down into the free molecular regime where the mean free path of residual gas molecules exceeds critical mechanical clearances by ten times or more.
The boundary between these regimes is governed by the Knudsen number, defined as the ratio of the gas molecular mean free path to the capacitor gap distance. For a capacitive transducer gap of one micrometer, molecular flow establishes itself at internal pressures below one Pascal, which corresponds to approximately ten microbars. Inside a clean, fully baked hermetic cavity, production specifications target an internal baseline pressure between 0.001 and 0.1 Pascal, maintaining mechanical quality factors between eighty thousand and one hundred twenty thousand for forty-megahertz shear-mode resonators, or twenty thousand to fifty thousand for tuning forks operating below one hundred kilohertz.
| Operating Pressure Range (Pa) | Knudsen Number (g = 1 um) | Damping Regime | Resonator Quality Factor (typ.) | Dominant Energy Dissipation Mechanism |
|---|---|---|---|---|
| 100000 to 1000 | 0.000067 to 0.0067 | Viscous Continuum | 50 to 500 | Poiseuille air flow and acoustic drag |
| 1000 to 10 | 0.0067 to 0.67 | Transition Flow | 500 to 8000 | Squeeze-film slip damping |
| 10 to 0.1 | 0.67 to 67 | Molecular Diffusion | 8000 to 45000 | Individual molecular momentum transfer |
| 0.1 to 0.0001 | 67 to 67000 | Free Molecular Vacuum | 45000 to 180000 | Thermoelastic dissipation and anchor loss |
Internal pressure within the microcavity does not stay static over thermal cycles. Higher temperatures inside an environmental chamber cause outgassing of water vapor, hydrogen, and volatile hydrocarbons from cavity interior sidewalls, die-attach polymers, and capping seal glass frits. Even in metal-eutectic sealed devices, hydrogen permeates through passivation layers, degrading cavity vacuum levels from 0.01 Pascal to more than two Pascal over accelerated lifetime testing at one hundred twenty-five degrees Celsius.
This vacuum degradation directly alters the thermal damping profile.
Quality factor dissipation follows the inverse summation of internal loss mechanisms, expressed as:
1 / Q_total = 1 / Q_gas + 1 / Q_ted + 1 / Q_anchor + 1 / Q_surface
Thermoelastic damping, labeled as Q_ted, sets the physical dissipation ceiling in silicon flexural resonators across industrial operating temperatures. When a flexural beam bends, one side undergoes compressive strain and warms while the opposite side undergoes tensile strain and cools. The resulting cross-beam heat flux dissipates mechanical energy directly into the thermal domain.
The characteristic thermoelastic relaxation frequency depends on beam width and the thermal diffusivity of silicon, creating an operational loss peak at specific temperatures.
If microcavity pressure rises due to seal microcracking or seal-ring void migration, gas damping re-emerges as the principal energy sink. As the chamber heats from twenty-five to eighty-five degrees Celsius, the kinetic velocity of residual gas molecules increases in proportion to the square root of absolute temperature. Gas damping in the free molecular regime therefore carries a positive temperature coefficient, introducing non-linear mechanical impedance shifts into the mapping matrix that electronic compensation loops cannot separate from anchor losses.
Sourcing engineers face direct yield fallout when unbaked microcavities enter production. Wafer-level encapsulation using non-evaporable getter thin films, such as titanium-zirconium-vanadium matrices, absorbs outgassed diatomic gases during post-seal thermal activation. If getter activation time falls below forty-five minutes at four hundred degrees Celsius, the microcavity outgasses during thermal cycle validation, dropping the mechanical quality factor below design thresholds and shifting resonant loop phase margins toward zero.

Chamber
Automated Matrix Characterization and Thermal Gradient Extraction
Accurate thermal mapping requires an environmental test cell constructed to isolate the device under test from external thermal gradients and electrical phase delays. Mounting twenty to fifty packaged parts on a high-frequency polyimide test carrier inside a thermal chamber introduces parasitic lead capacitances and board leakage currents. Chamber airflow directed across component packages creates board temperature differentials of two to five degrees Celsius unless an isolated copper thermal soaking shroud surrounds the fixtures.
Data acquisition architectures link network analyzers, high-speed multi-channel frequency counters, and precision source-measure units over automated GPIB or high-throughput PXI backplanes. The frequency mapping procedure steps through a programmed temperature profile, dwelling at each plateau until internal package thermal equilibrium stabilizes:
- Soak cycle dwell requires fifteen minutes per five-degree increment to eliminate temperature offsets between the external ceramic package case, the internal microcavity atmosphere, and the co-integrated silicon diode temperature sensor.
- Drive level characterization tracks device linearity across five drive voltages from two hundred millivolts to two volts peak-to-peak to prevent non-linear Duffing bifurcation from skewing the extraction of natural resonance.
- Bias sweep matrix steps electrostatic bias potentials across the split-comb electrodes from five volts to thirty volts direct current, mapping the electrostatic spring softening rate against ambient cavity temperature.
- Hysteresis validation profile runs consecutive ascending and descending thermal runs between negative forty and positive one hundred twenty-five degrees Celsius to expose physical stress relaxation in packaging elastomers.
During automated sweeping, the measurement engine must calculate resonant frequency, equivalent motional resistance, and parallel parasitic capacitance for every device. Motional resistance, designated as R1, scales inversely with the product of the quality factor and the square of the electrostatic coupling coefficient. As temperature rises, silicon Young’s modulus softens and internal thermoelastic damping climbs, driving R1 upward.
If motional resistance exceeds fifty kilohms, standard transimpedance sustaining amplifiers drop out of Barkhausen oscillation criteria, terminating the continuous track.
The standard test specification IEC 60122-1 restricts environmental chamber thermal ramping rates to less than one degree Celsius per minute during mapping to suppress spatial gradients across the silicon die.
A primary source of systematic mapping error stems from spatial thermal lags between the MEMS resonator element and its tracking temperature sensor. In split-die configurations, where the resonator die mounts beside an application-specific integrated circuit inside a shared cavity, a dynamic temperature transient causes the on-chip bandgap sensor to report a reading that lags or leads the true resonator core by several seconds. Even in single-die monolithic architectures, placing the junction diode five hundred micrometers away from the anchor footings creates a dynamic offset during rapid thermal slewing.
Thermal mapping algorithms run steady-state calibration sweeps to bypass this transient lag. Ramping the chamber slower than zero point five degrees Celsius per minute maintains die-level spatial isothermality within zero point zero two degrees Celsius. High-throughput production lines cannot tolerate six-hour soak profiles per part.
Fast-mapping techniques instead drive high thermal gradients across the package while simultaneously monitoring the differential frequency response of two orthogonal vibration modes, extracting temperature directly from the frequency ratio without relying on external temperature sensing diodes.
Ignoring parasitic path delays between the environmental chamber and external test instruments degrades high-frequency phase measurements. A two-meter coaxial line running through an oven port wall contributes roughly ten nanoseconds of propagation delay, introducing a phase shift that rotates by several degrees as chamber temperatures drift. Calibration vectors must establish real-time de-embedding planes at the socket interface using dedicated open, short, and load calibration standards baked inside the chamber fixture.

Lattice
Doping Mechanics and Modulus Compensation Strategies
The primary physical driver behind silicon thermal instability resides in the electronic contribution to the elastic constants. Pure intrinsic silicon features negative temperature coefficients for the shear elastic moduli c11, c12, and c44 across the entire engineering temperature envelope. Degenerate semiconductor doping alters this trajectory by shifting the Fermi level deep into the conduction band for n-type silicon or down into the valence band for p-type silicon, creating an electronic strain-energy mechanism that directly counteracts lattice thermal softening.
Degenerate doping with phosphorus or arsenic at concentrations exceeding 10^19 atoms per cubic centimeter introduces free electrons that redistribute among conduction band valleys under applied mechanical shear strain. This valley redistribution energy offsets the natural decrease of the elastic constant c11 minus c12 divided by two. Boron doping provides comparable compensation across p-type crystals by populating heavy and light hole valence sub-bands, though it yields higher room-temperature motional resistance due to lower carrier mobilities.
| Dopant Species | Doping Concentration (cm^-3) | Primary Resonant Mode | Uncompensated TCF1 (ppm/K) | Turnover Temperature (deg C) |
|---|---|---|---|---|
| Intrinsic / Light Boron | 1.0 10^15 | Flexural Tuning Fork | -31.5 | None (monotonic decline) |
| Phosphorus (n-type) | 2.5 10^19 | Lamé Bulk Acoustic | -12.8 | -45 |
| Phosphorus (n-type) | 8.5 10^19 | Extensional Lamé Mode | +1.2 | +25 |
| Boron (p-type) | 6.0 10^19 | Width-Extensional Mode | -4.5 | +60 |
| Phosphorus (n-type) | 1.2 10^20 | Face-Shear Mode | +14.6 | +105 |
Degenerate doping allows designers to synthesize a parabolic frequency-temperature curve featuring a turnover point where the first-order temperature coefficient vanishes entirely. Adjusting phosphorus concentration from 7.0 10^19 to 9.5 10^19 atoms per cubic centimeter shifts this turnover temperature from zero degrees Celsius up to eighty-five degrees Celsius. In the immediate vicinity of this turnover point, frequency stability matches standard AT-cut quartz crystals, leaving digital calibration logic to correct only the remaining second-order curvature.
Lattice compensation introduces trade-offs during epitaxial growth and chemical dry etching. Deep reactive-ion etching of degenerately doped silicon wafers displays marked micro-loading effects and modified etch rates. Highly doped silicon exhibits accelerated lateral sidewall scalloping under standard Bosch fluorine chemistry, resulting in critical dimension variations across transducer gaps.
A five-nanometer variance in capacitor spacing alters electrostatic spring softening enough to displace the turnover temperature by six to ten degrees Celsius across adjacent die positions.
Degenerate doping shifts the zero-crossing turnover temperature across the wafer radius when epitaxial dopant incorporation gradients exceed three percent.
A second passive compensation path bonds thin films of amorphous silicon dioxide onto the resonant beams. Silicon dioxide displays an anomalous positive temperature coefficient of Young’s modulus, running at approximately positive eighty-five parts per million per Kelvin. Depositing a silicon dioxide layer of appropriate thickness over a structural silicon beam forces the oxide’s positive thermal coefficient to balance the negative coefficient of the silicon core.
The main drawback involves interfacial stress and quality factor loss: silicon dioxide layers introduce structural damping that drops total resonator Q by sixty to eighty percent.
Silicon dioxide composite beams also introduce long-term frequency aging phenomena. High-temperature thermal cycling drives oxygen atom migration across the silicon-oxide interface, accompanied by structural relaxation of trapped charges within the amorphous layer. As these charges move under applied electrostatic bias fields, they generate slow electrostatic field shifts that mimic thermal drift.
Sourcing teams specifying oxide-compensated MEMS resonators require extensive burn-in verification data spanning one thousand hours at one hundred twenty-five degrees Celsius to ensure nominal thermal turnover points do not migrate over operational deployment lifespans.

Anchor
Stress Concentration and Substrate Dynamic Coupling
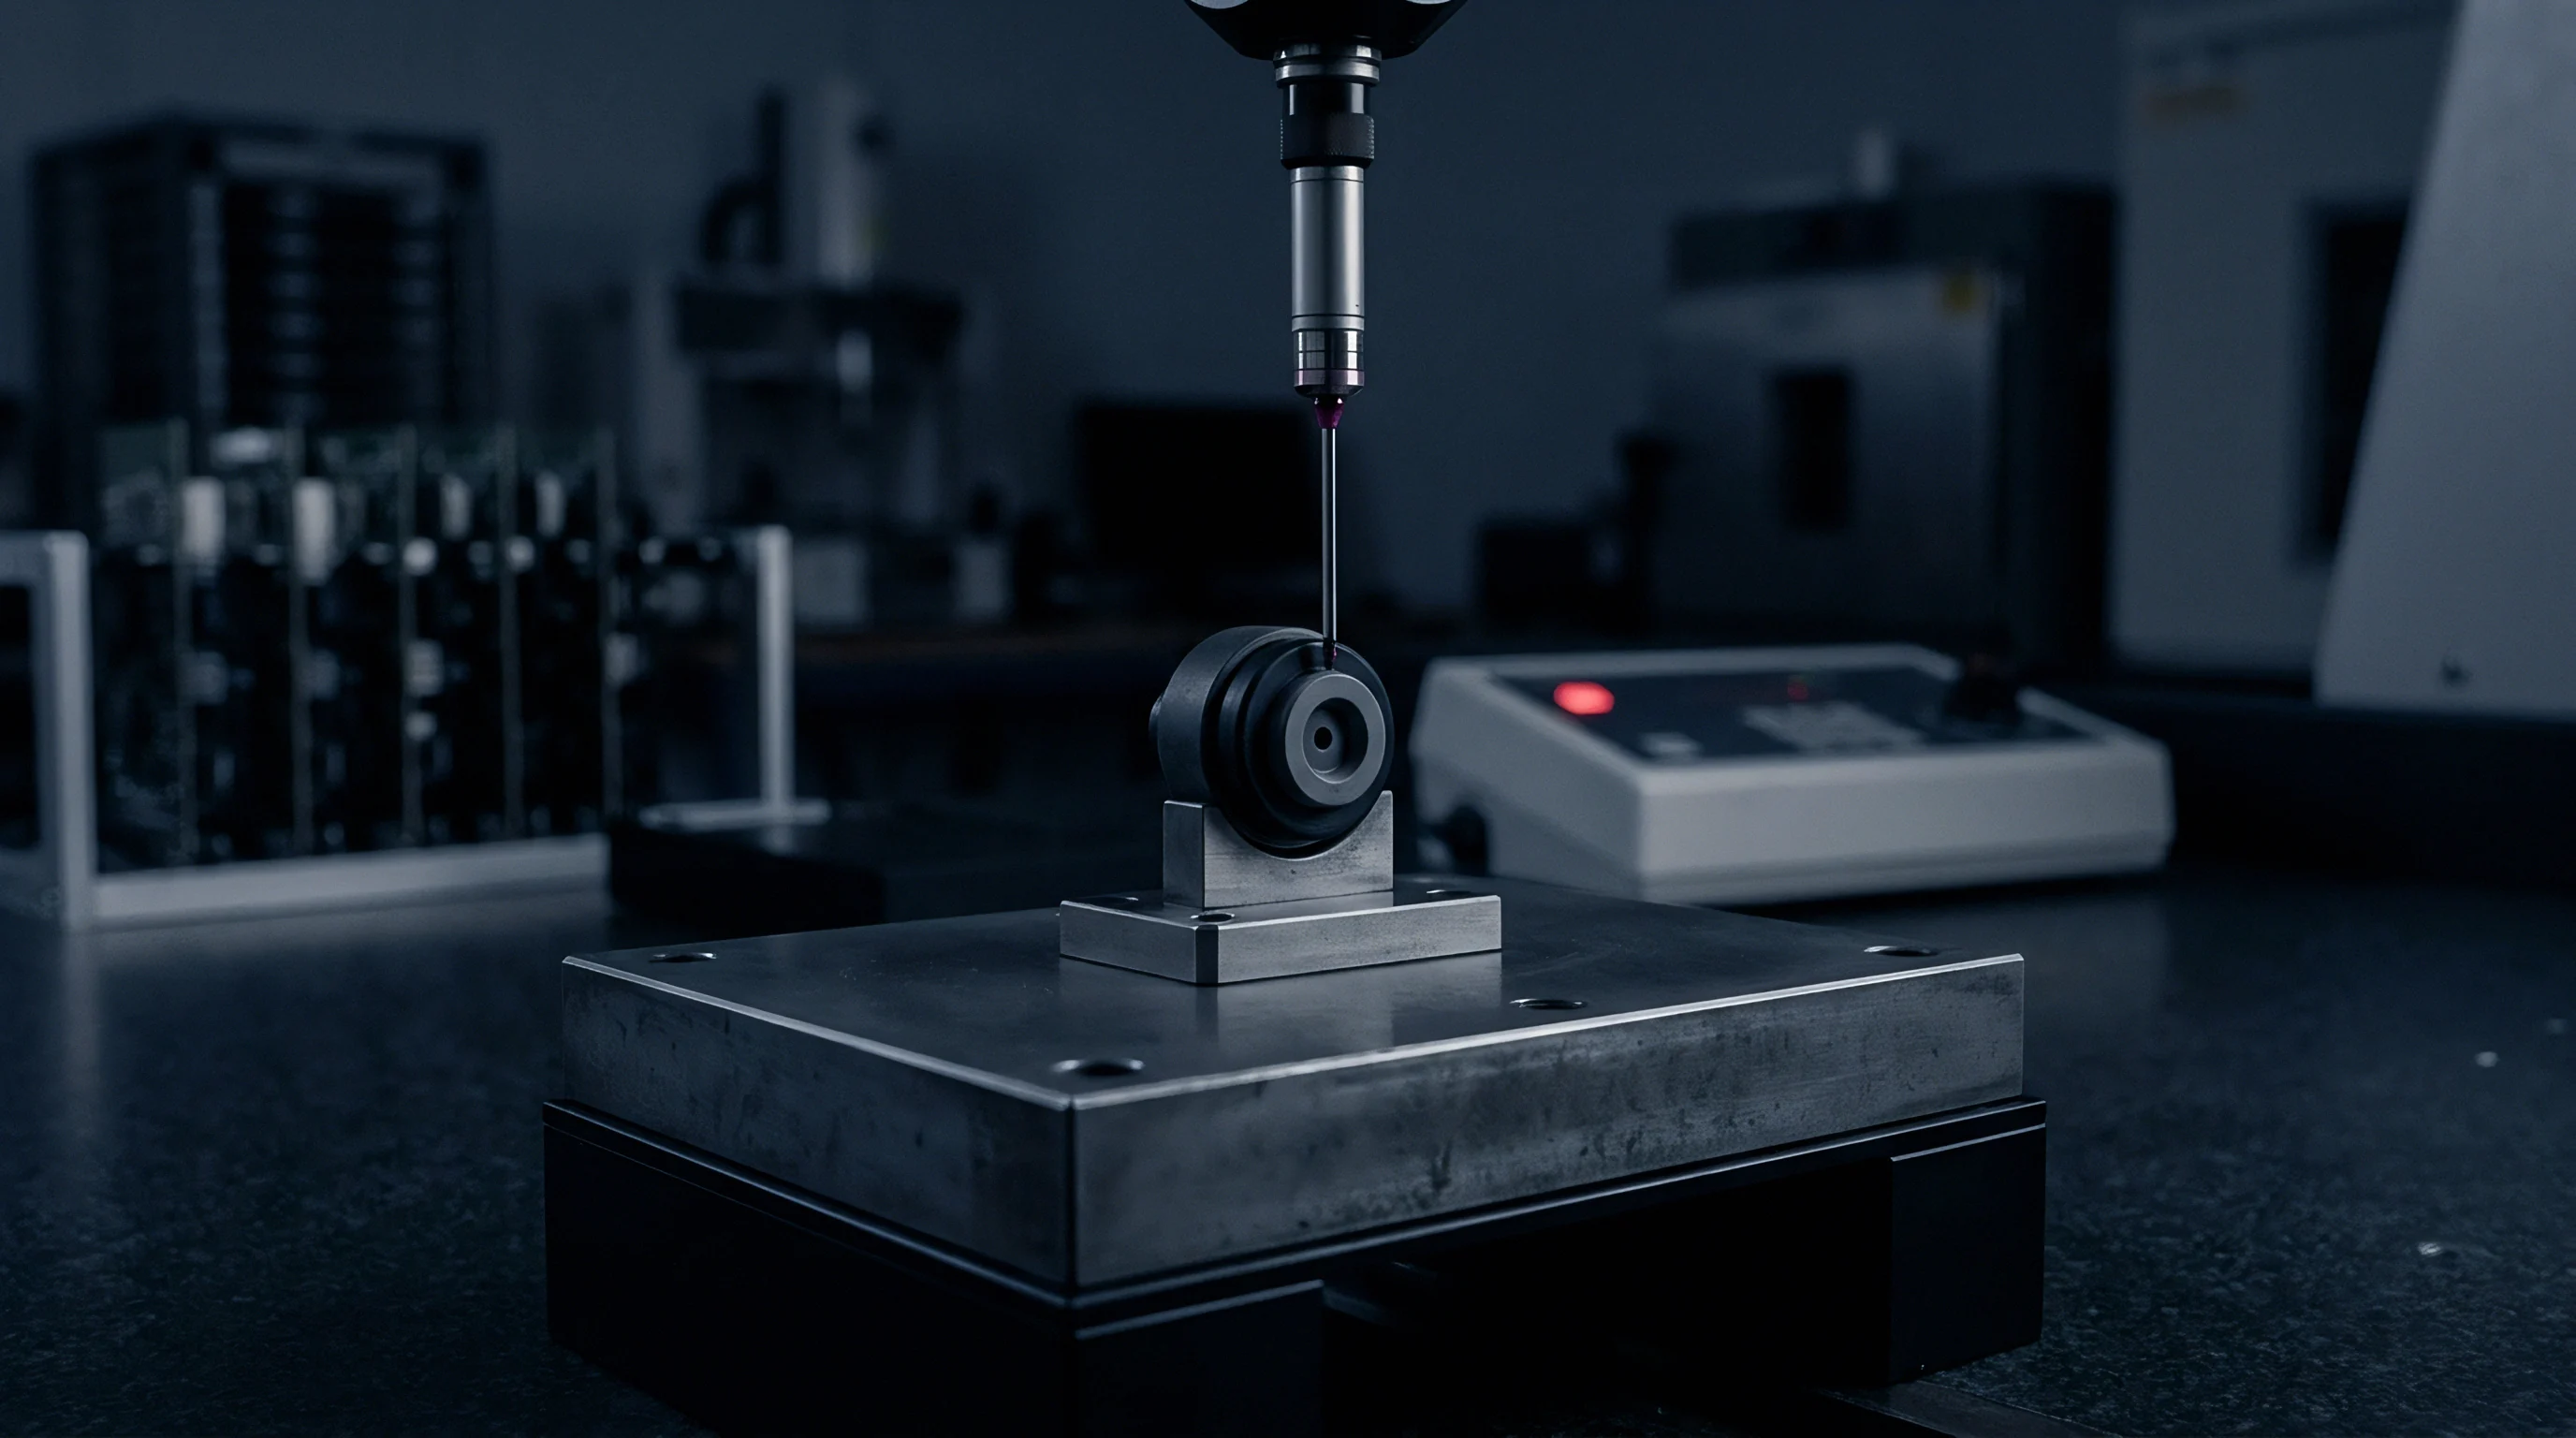
Anchor geometries define the physical interface connecting the oscillating mechanical proof mass to the static handle substrate. Ideal resonator designs assume an infinitely rigid anchor reflecting one hundred percent of incident acoustic energy back into the resonant cavity. In real micromachined structures, cyclic elastic stresses within the anchor pads launch acoustic bulk and surface waves into the underlying silicon substrate, creating an extrinsic energy loss channel that alters mechanical quality factor and shifts temperature response.
Anchor-induced frequency shifts link to package stress through the piezoresistive and photoelastic behavior of silicon. When ambient temperatures change, thermal expansion mismatches between the silicon die, the solder alloy or silver-glass die attach, and the alumina ceramic substrate exert strong in-plane shear forces across the anchor footings. These forces propagate directly into the suspension tethers, changing their effective mechanical tension much like tuning a guitar string:
delta_f / f0 = 0.5 (sigma_xx + sigma_yy) pi_stress
The term pi_stress represents the mode-dependent stress sensitivity coefficient of the structural suspension. In standard folded-beam resonators, this sensitivity can be minimized by orienting tethers along specific crystallographic axes. Aligning suspension beams parallel to the silicon <110> direction subjects them to peak piezoresistive coupling, whereas alignment along the <100> direction reduces packaging stress sensitivity at the cost of lower mechanical fracture margins.
Balanced anchor designs eliminate net reaction forces and moments at the footing interface. In a balanced double-ended tuning fork, two identical tines oscillate in anti-phase opposition. The outward mechanical momentum of the left tine precisely cancels that of the right tine, reducing dynamic reaction forces at the shared anchor base to near zero.
If wafer fabrication tolerances introduce a two percent mass imbalance between the tines, dynamic balance collapses, driving cyclic shear forces into the substrate and coupling package thermal expansion directly into the active frequency track.
Single-anchor central pivot architectures offer the highest isolation from external package mounting strain. Anchoring the structure through a singular central post allows the surrounding die substrate to expand and contract symmetrically around the core without imparting axial tensile stress to the resonant arms. Center-anchored disk and breathing-ring resonators maintain stable TCF1 values across aggressive thermal shock tests, though they remain vulnerable to out-of-plane tilting modes under dynamic board-level mechanical vibration.
Dual-anchor and four-point frame suspensions provide robust resistance against external shock and drop events, yet they lock the resonator structure into the substrate strain field. When these devices undergo wide thermal sweeps, non-linear stress relaxation within the die-attach material generates pronounced frequency hysteresis. A thermal cycle ascending from negative forty to positive eighty-five degrees Celsius produces a different frequency-versus-temperature curve than the descending sweep, introducing an uncorrectable deadband into memory-based lookup calibration algorithms.

Arithmetic

Calibration Algorithms and Thermal Lookup Architectures
Active compensation architectures replace passive material balancing with closed-loop digital corrections. The system continuously measures die temperature, processes that reading through a polynomial evaluation engine or lookup table, and adjusts an output fractional-N phase-locked loop or varactor array to stabilize reported frequency. The ultimate frequency stability of the clock source is limited by temperature sensor precision, the quantization depth of the analog-to-digital converter, and the polynomial order of the compensation algorithm.
Consider a typical commercial deployment requiring a temperature-compensated MEMS oscillator to maintain plus or minus zero point five parts per million stability across the industrial temperature band from negative forty to positive eighty-five degrees Celsius. The raw silicon resonator exhibits an uncompensated frequency excursion of negative thirty parts per million per Kelvin. Across the full one-hundred-twenty-five-degree span, total uncompensated frequency drift amounts to three thousand seven hundred fifty parts per million.
The compensation subsystem must attenuate this drift by a factor of seven thousand five hundred.
The temperature measurement path represents the primary error source in this arithmetic chain. If the on-chip temperature sensor demonstrates a measurement resolution of zero point zero one degrees Celsius, that thermal uncertainty translates directly into uncorrected frequency jitter:
Frequency_Uncertainty = abs(TCF1) delta_T = 30 ppm/K 0.01 K = 0.3 ppm
This single uncertainty term consumes sixty percent of the zero point five parts per million error budget, leaving minimal headroom for packaging hysteresis, aging drift, and phase-locked loop fractional division quantization noise. Digital compensation systems require temperature conversion resolution better than zero point zero zero two degrees Celsius (two millikelvins) to keep the temperature engine’s error contribution below zero point zero six parts per million.
Evaluating the required compensation polynomial demonstrates the necessity of tracking higher-order non-linear terms. The following worked calculation establishes the residual frequency error when truncating calibration polynomial order across an industrial thermal sweep:
- Assume baseline conditions ~ Operating range T = -40 to +85 deg C; reference temperature T0 = +25 deg C; raw TCF1 = -30.0 ppm/K; raw TCF2 = -25.0 ppb/K^2; raw TCF3 = -15.0 ppt/K^3. Maximum excursion delta_T occurs at the cold limit, where delta_T = -65 K.
- First-order correction performance ~ Applying an ideal linear calibration canceling TCF1 leaves residual errors driven entirely by TCF2 and TCF3. At delta_T = -65 K, the uncorrected second-order drift reaches TCF2 (delta_T)^2 = (-25.0 10^-3 ppm/K^2) (-65 K)^2 = -105.6 ppm. Linear compensation fails the zero point five parts per million specification by more than two orders of magnitude.
- Second-order correction performance ~ Implementing a quadratic engine cancels TCF1 and TCF2, leaving the cubic term TCF3 uncorrected. At delta_T = -65 K, the residual error equals TCF3 (delta_T)^3 = (-15.0 10^-6 ppm/K^3) (-65 K)^3 = +4.11 ppm. A second-order polynomial remains insufficient to secure sub-ppm precision over an industrial temperature profile.
- Third-order correction performance ~ Expanding the polynomial engine to third order cancels TCF1, TCF2, and TCF3, leaving fourth-order lattice terms and packaging stress residuals. Assuming a fourth-order coefficient TCF4 of 0.05 ppt/K^4, the residual drift evaluates to TCF4 (delta_T)^4 = (0.05 10^-6 ppm/K^4) (-65 K)^4 = 0.00089 ppm. Third-order compensation comfortably complies with the zero point five parts per million envelope, provided packaging stress hysteresis remains below zero point one parts per million.
The digital engine evaluates these polynomials through an application-specific integrated circuit co-packaged with the MEMS die. Calibration coefficients are written into on-chip electrically erasable programmable read-only memory or one-time programmable fuse arrays during automated wafer-level or final package testing. Storing four 16-bit polynomial coefficients requires minimal memory, yet mathematical evaluation generates computational latency that compromises dynamic tracking under high thermal slew rates.
High-performance systems adopt dual-mode self-temperature sensing to bypass physical thermal sensors entirely. By driving the MEMS resonator simultaneously in its fundamental flexural mode and an overtone or orthogonal bulk mode, the system extracts two distinct frequencies exhibiting divergent temperature coefficients. Because both modes share the identical physical silicon volume, the ratio between the two frequencies yields an instantaneous, zero-lag measure of die temperature, eliminating thermal gradient errors during rapid environmental transients.
Yield

Automated Mapping Throughput and Packaging Economics
Thermal mapping dominates the back-end manufacturing cost structure of precision MEMS timing devices. Unlike consumer inertial measurement units that tolerate coarse two-point factory calibration, a vacuum-encapsulated resonator targeting telecommunications or automotive synchronization requires precise multi-point thermal characterization. Total test time spent inside temperature chambers dictates factory floor throughput, automated test equipment capital depreciation, and final packaged component costs.
Wafer-level mapping represents the most aggressive approach to reducing back-end calibration expenses. Using specialized wafer probers equipped with thermal chucks operating from negative forty to positive one hundred twenty-five degrees Celsius, test engineers extract resonant frequencies across sixty-four sites in parallel before dicing. The bottleneck lies in wafer chuck ramp rates: a thermal chuck requires ten to twelve minutes to settle within zero point one degrees Celsius of a target setpoint.
Sweeping eight calibration temperatures consumes nearly two hours per wafer, limiting prober throughput to twelve wafers per day per test cell.
| Calibration Architecture | Test Insertion Point | Thermal Points Acquired | Test Time per Part (sec) | Packaged Unit Test Cost (USD) | Yield Fallout Post-Assembly |
|---|---|---|---|---|---|
| Wafer-Level Full Map | Pre-dicing wafer chuck | 7 to 9 points | 12.5 | 0.08 to 0.12 | 8.5% to 14.0% |
| Wafer-Level Sample Extract | Pre-dicing wafer chuck | 2 points | 2.1 | 0.02 to 0.04 | 18.0% to 26.0% |
| Package Strip-Level Map | Leadframe strip socket | 5 to 7 points | 45.0 | 0.22 to 0.35 | 2.1% to 4.5% |
| Final Single-Package Test | Automated gravity feed | 5 points | 110.0 | 0.55 to 0.85 | 0.5% to 1.2% |
| Dual-Mode Fast Transient | Strip-level RF chamber | Continuous slew | 4.0 | 0.05 to 0.09 | 1.5% to 3.0% |
The strategic hazard of pure wafer-level mapping stems from packaging assembly yield fallout. Dicing, leadframe die-attach, and epoxy transfer molding apply mechanical stresses that shift extracted polynomial coefficients. A die mapped to a zero point one part per million residual profile at wafer level routinely displays a one to two parts per million offset after transfer molding curing shrinkage.
Device makers targeting ultra-stable stratum-level performance are forced to perform an additional final package-level trim insertion, nullifying initial wafer-level test savings.
To balance test time against finished precision, production facilities split the calibration burden. The wafer prober executes a high-speed multi-site screen at twenty-five degrees Celsius and eighty-five degrees Celsius to extract baseline frequency and TCF1, sorting dies into matched coefficient bins. After final packaging, automated strip-level handlers execute an abbreviated thermal verification to trim the offset and program final polynomial coefficients into the ASIC memory array.
This hybrid methodology preserves sub-ppm performance while maintaining line throughput above twenty thousand units per hour.
Procurement teams auditing MEMS oscillator foundries must verify test methodology claims against delivered stability distributions. When a vendor quotes low unit costs on high-stability oscillators, the savings typically trace back to truncated thermal soak times during final test. If soak times drop below sixty seconds per temperature step to compress test cycles, internal die thermal equilibrium remains unestablished during coefficient extraction, introducing latent frequency offsets that surface as field failures under sustained environmental extremes.
Sourcing strategies mandate explicit contractual language specifying whether temperature coefficients are mapped individually per serial number or applied as a generic lot-average polynomial. Generic lot-average compensation drops testing costs to pennies per unit but degrades frequency stability to plus or minus five parts per million over temperature due to wafer-level doping gradients. Demanding serialized individual-die mapping delivers sub-ppm stability across industrial profiles, though the buyer absorbs the amortized capital costs of automated multi-chamber test cells.