Silicon Piezoresistive Element Thermal Coefficients in Transducer Selection
Silicon piezoresistive element selection requires matching doping concentration to signal chain compensation capabilities to handle resistance and sensitivity thermal shifts.

Doping
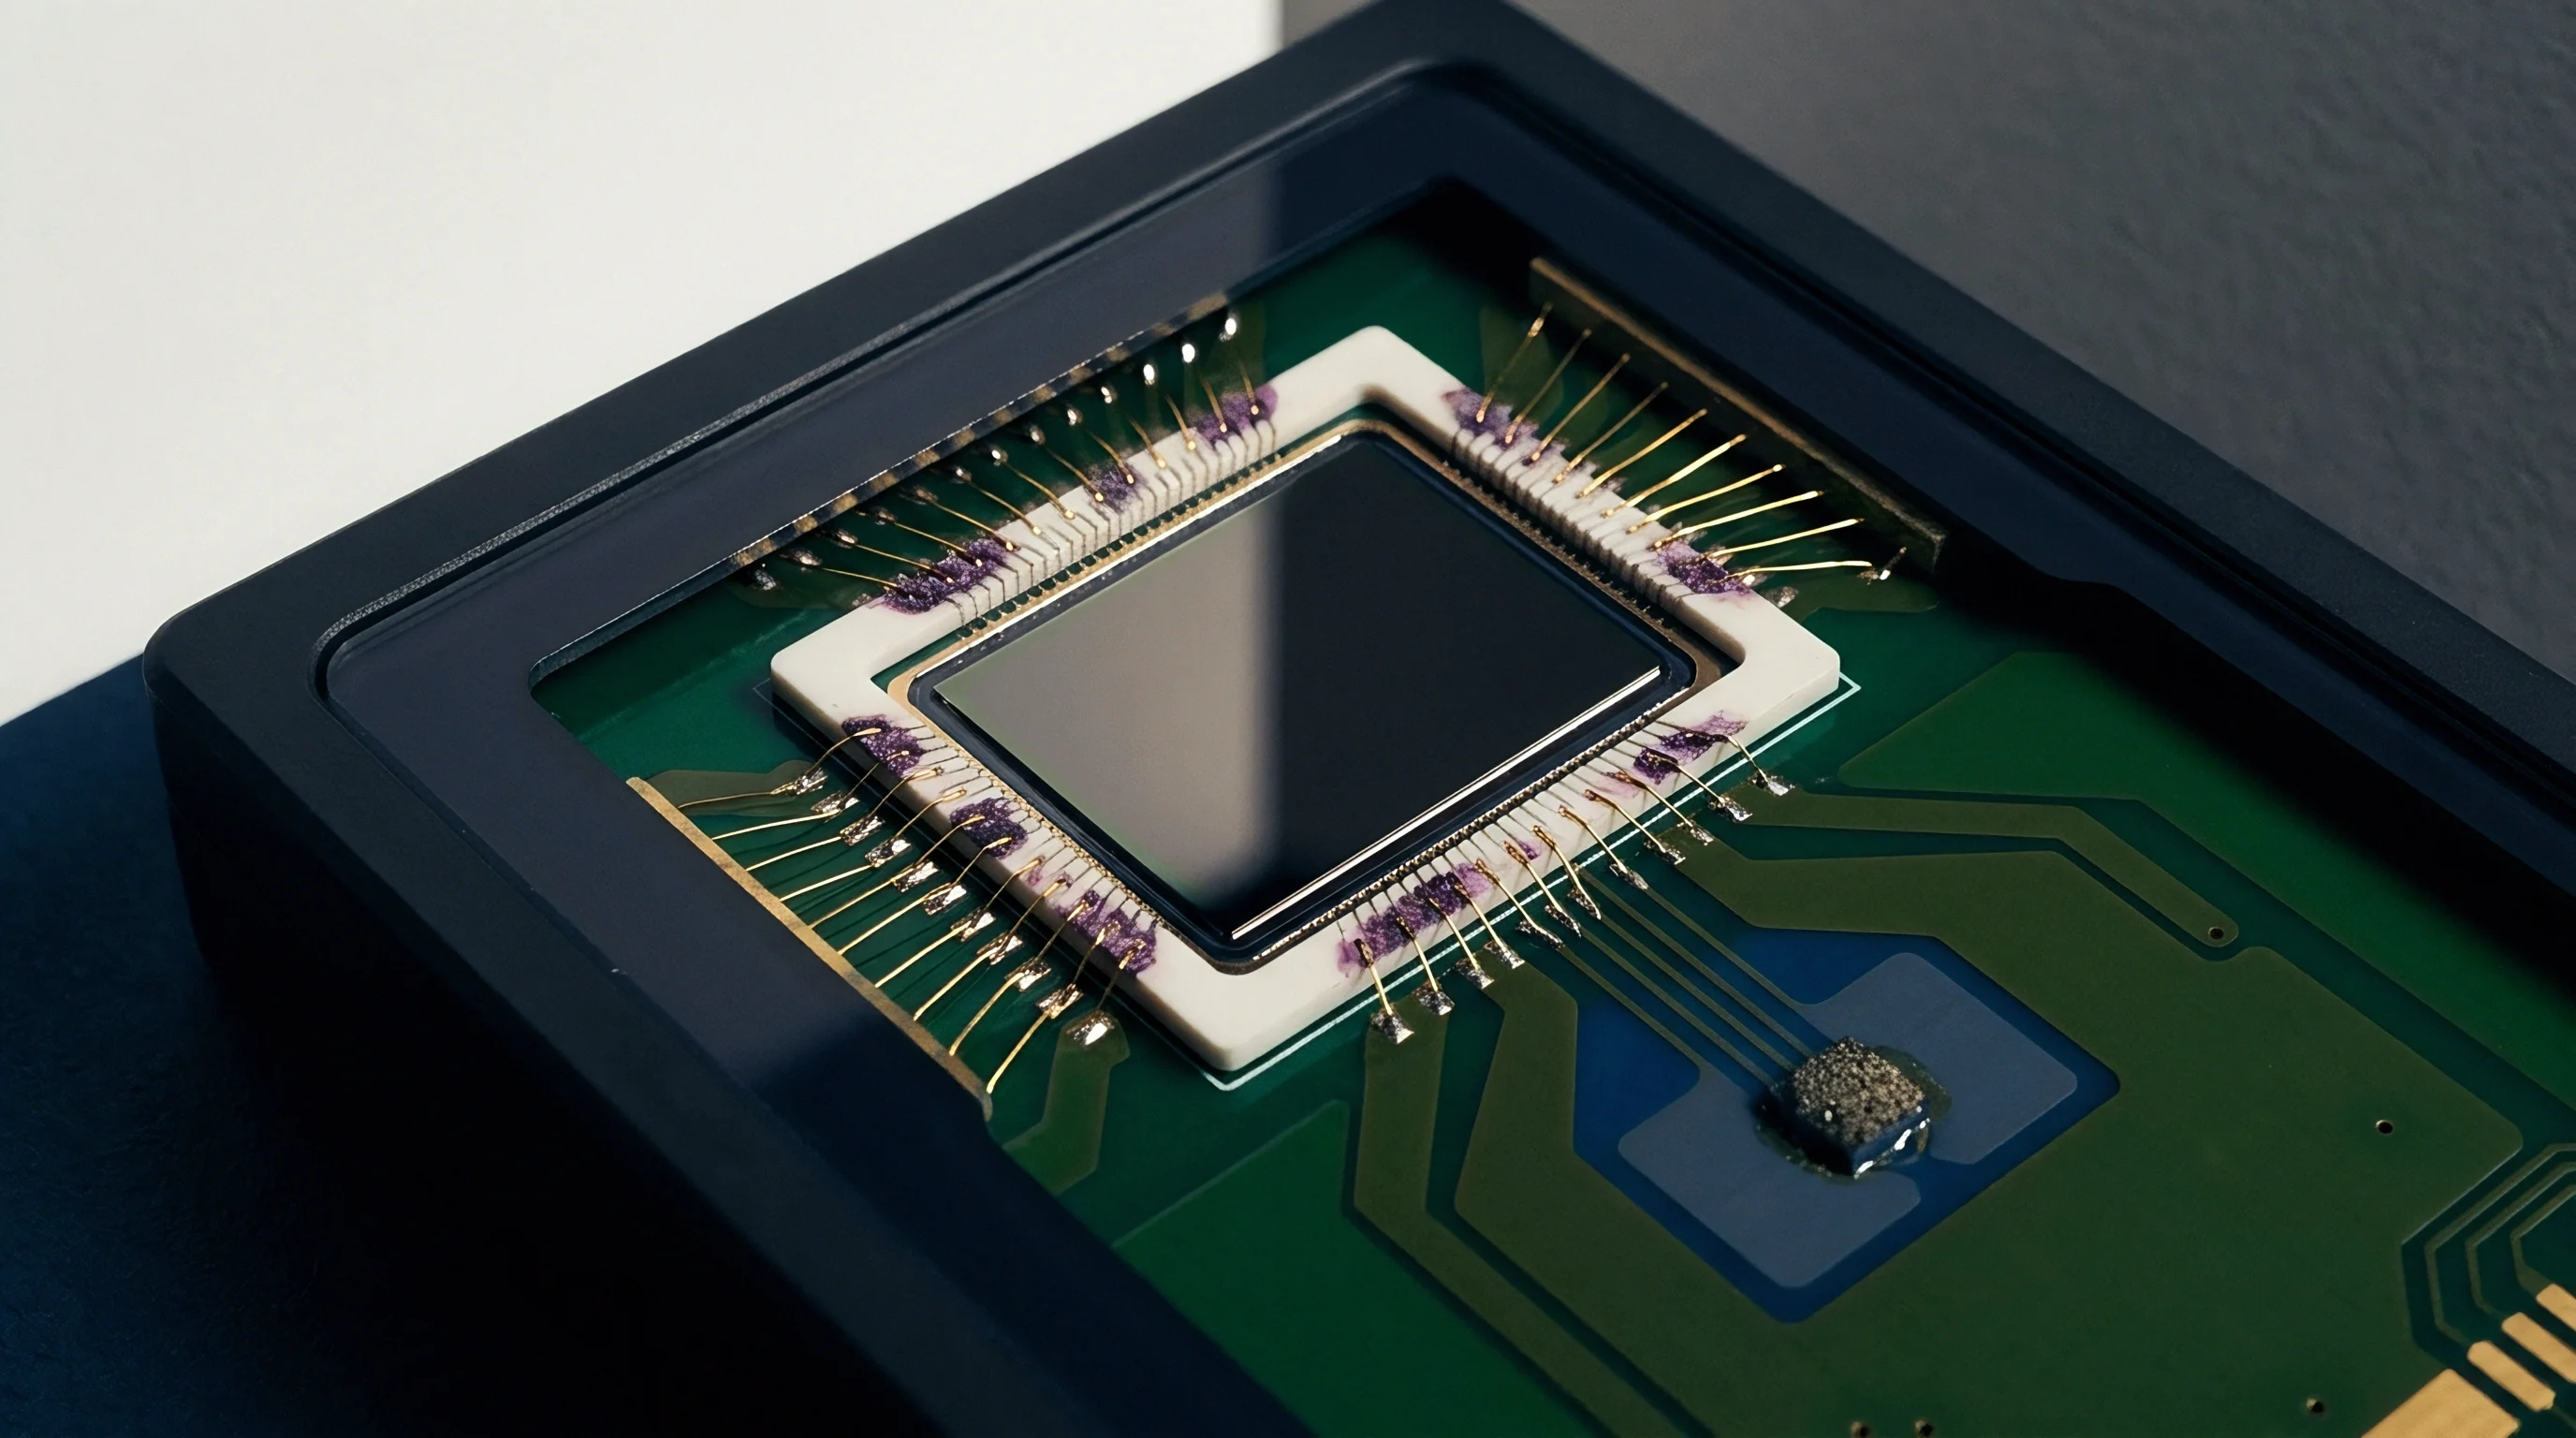
Boron concentration within a p-type piezoresistive silicon element sets both the baseline sheet resistance and the thermal behavior of the piezoresistive coefficient. Monocrystalline silicon pressure and strain diaphragms rely on ion implantation or thermochemical diffusion to create resistor tracks along specific crystallographic directions, typically the 110 orientation on a 100 wafer surface. At low doping concentrations near 10 to the 17th power atoms per cubic centimeter, the piezoresistive coefficient pi-44 reaches high initial values, yielding significant mechanical sensitivity per unit strain.
This regime exhibits steep temperature dependence. Thermal excitation scatters charge carriers through lattice vibrations, causing carrier mobility to drop rapidly as temperature rises. The sensitivity coefficient falls by approximately 0.25 percent per Kelvin, generating a pronounced negative Thermal Coefficient of Sensitivity.
Increasing the boron impurity concentration into the degenerate regime above 10 to the 19th power atoms per cubic centimeter stabilizes carrier mobility against thermal scattering. Impurity scattering dominates lattice scattering at these high carrier densities. The piezoresistive coefficient loses its steep thermal degradation, dropping its thermal sensitivity coefficient to less than 0.08 percent per Kelvin.
High impurity density lowers the absolute piezoresistive response, requiring higher mechanical deformation to produce a target output signal. Impurity concentration governs piezoresistive behavior.
| Boron Concentration (cm^-3) | Sheet Resistance (Ohm/sq) | Piezoresistive Coefficient pi_44 (10^-11 Pa^-1) | Thermal Coefficient of Resistance (%/K) | Thermal Coefficient of Sensitivity (%/K) |
|---|---|---|---|---|
| 1.0 x 10^18 | 210 | 125 | +0.08 | -0.27 |
| 5.0 x 10^18 | 110 | 102 | +0.14 | -0.21 |
| 1.0 x 10^19 | 65 | 80 | +0.18 | -0.16 |
| 5.0 x 10^19 | 22 | 48 | +0.24 | -0.09 |
| 1.0 x 10^20 | 12 | 28 | +0.12 | -0.04 |
Silicon piezoresistors exhibit marked thermal sensitivity. The resistance of the element itself changes with temperature alongside its piezoresistive coefficient. The Thermal Coefficient of Resistance remains positive across standard industrial operating ranges.
Moderately doped tracks display resistance increases of 0.15 to 0.22 percent per Kelvin. The positive resistance coefficient and negative sensitivity coefficient stem from distinct quantum mechanical mechanisms within the valance band structure. Heavy doping flattens both coefficients at the direct expense of bridge output swing.
The thermal coefficient of sensitivity for p-type silicon piezoresistors ranges from -0.15 percent to -0.25 percent per Kelvin across the industrial temperature band from -40 to +125 degrees Celsius.
Designers selecting bare piezoresistive die must balance the raw voltage sensitivity against the burden placed on downstream signal conditioning circuits. A element optimized for high output voltage forces the signal chain to correct wide temperature swings in both offset and span. A heavily doped die provides inherent thermal stability but pushes the signal closer to the system noise floor, demanding lower noise amplifiers and higher analog-to-digital converter resolution.

Crystal Orientation and Tensor Coefficients
Piezoresistivity in silicon is an anisotropic physical property described by a fourth-rank tensor connecting mechanical stress to electrical resistivity changes. Longitudinal and transverse piezoresistive coefficients vary according to the crystallographic vector of the diffused resistor track. In p-type silicon diaphragms, placing four bridge resistors along the orthogonal 110 crystal directions maximizes the shear piezoresistive coefficient pi-44 while minimizing longitudinal pi-11 and transverse pi-12 contributions.
Temperature changes alter carrier mobility rapidly.
Thermal variations affect each tensor component through identical mobility degradation functions, maintaining the geometric symmetry of the piezoresistive response. Geometric symmetry holds only when boron doping levels remain strictly uniform across all four arms of the Wheatstone bridge layout. Microscopic mask alignment errors or local gradient variations in furnace drive-in depth create local resistance imbalances.

Thermal Coefficient Degradation Dynamics
When high operating temperatures combine with sustained mechanical strain, thermal degradation mechanics alter the baseline parameters of piezoresistive elements.
- Dopant Migration Driven by high local thermal gradients, slow boron redistribution alters the local resistivity profile across the piezoresistive bridge arms.
- Contact Silicide Instability Metallization interfaces at the resistor terminations form aluminum-silicon or titanium-silicide alloys that develop micro-voids during thermal cycling, elevating contact resistance unpredictably.
- Passivation Charge Trapping Thermally activated charge carriers injection into the surface silicon dioxide layer alters the underlying depletion layer width, shifting the effective cross-sectional area of shallow diffused resistors.
- Substrate Leakage Drift Junction isolation between p-type resistors and the n-type silicon substrate breaks down at elevated temperatures as thermal carrier generation overcomes the reverse bias junction barrier.
Foundries frequently claim that tight diffusion processing eliminates thermal span drift, neglecting the secondary junction leakage currents that bypass the piezoresistive bridge above 135 degrees Celsius.
Compensation
Thermal compensation schemes neutralize the physical temperature coefficients of silicon elements before or during signal conversion. Bridge resistance increases with temperature while piezoresistive strain sensitivity decreases over the same operating range. Exploiting the sign opposition between the resistance coefficient and sensitivity coefficient allows passive compensation through specific excitation methods.
Bridge balance depends on resistor matching.
Constant current bias provides natural first-order compensation for span drift when the positive resistance coefficient matches the absolute value of the negative sensitivity coefficient. Supplying a fixed current through a bridge whose total resistance increases with temperature elevates the differential bridge excitation voltage. This automated increase in bridge voltage compensates for the diminished piezoresistive coefficient, stabilizing the full-scale span output over a wide thermal band.

Excitation Topologies and Passive Resistance Trim
Constant current excitation operates effectively only when the mathematical magnitude of the resistance coefficient closely equals the sensitivity coefficient. Piezoresistive die fabricated with moderate doping densities achieve this matching condition near room temperature. As operating temperatures drift toward extreme industrial boundaries, non-linear terms in both coefficients cause span tracking to diverge.
Current excitation provides natural span compensation.
Passive compensation networks introduce fixed series and parallel nickel-chromium or thin-film tantalum-nitride resistors into the bridge drive paths. A series span compensation resistor reduces the voltage applied to the bridge at low temperatures while allowing a larger fraction of the drive voltage to drop across the bridge as bridge resistance rises with heat. Adding parallel shunts across selected bridge arms offsets differential thermal zero shifts caused by manufacturing mismatches in individual resistor thermal coefficients.
- Evaluate uncompensated bridge offset voltage and full-scale span output across three discrete test temperatures including minimum, ambient, and maximum operating points.
- Calculate the total bridge resistance change to extract the actual thermal coefficient of resistance for the specific wafer lot.
- Determine the required series span resistance value using the ratio of the thermal sensitivity coefficient to the thermal resistance coefficient.
- Select zero-shift compensation resistors to insert into appropriate bridge legs to cancel differential thermal resistance drift.
- Laser trim thin-film resistor networks directly on the ceramic hybrid substrate while monitoring bridge output in an automated environmental chamber.
Active Analog and Digital Signal Conditioning
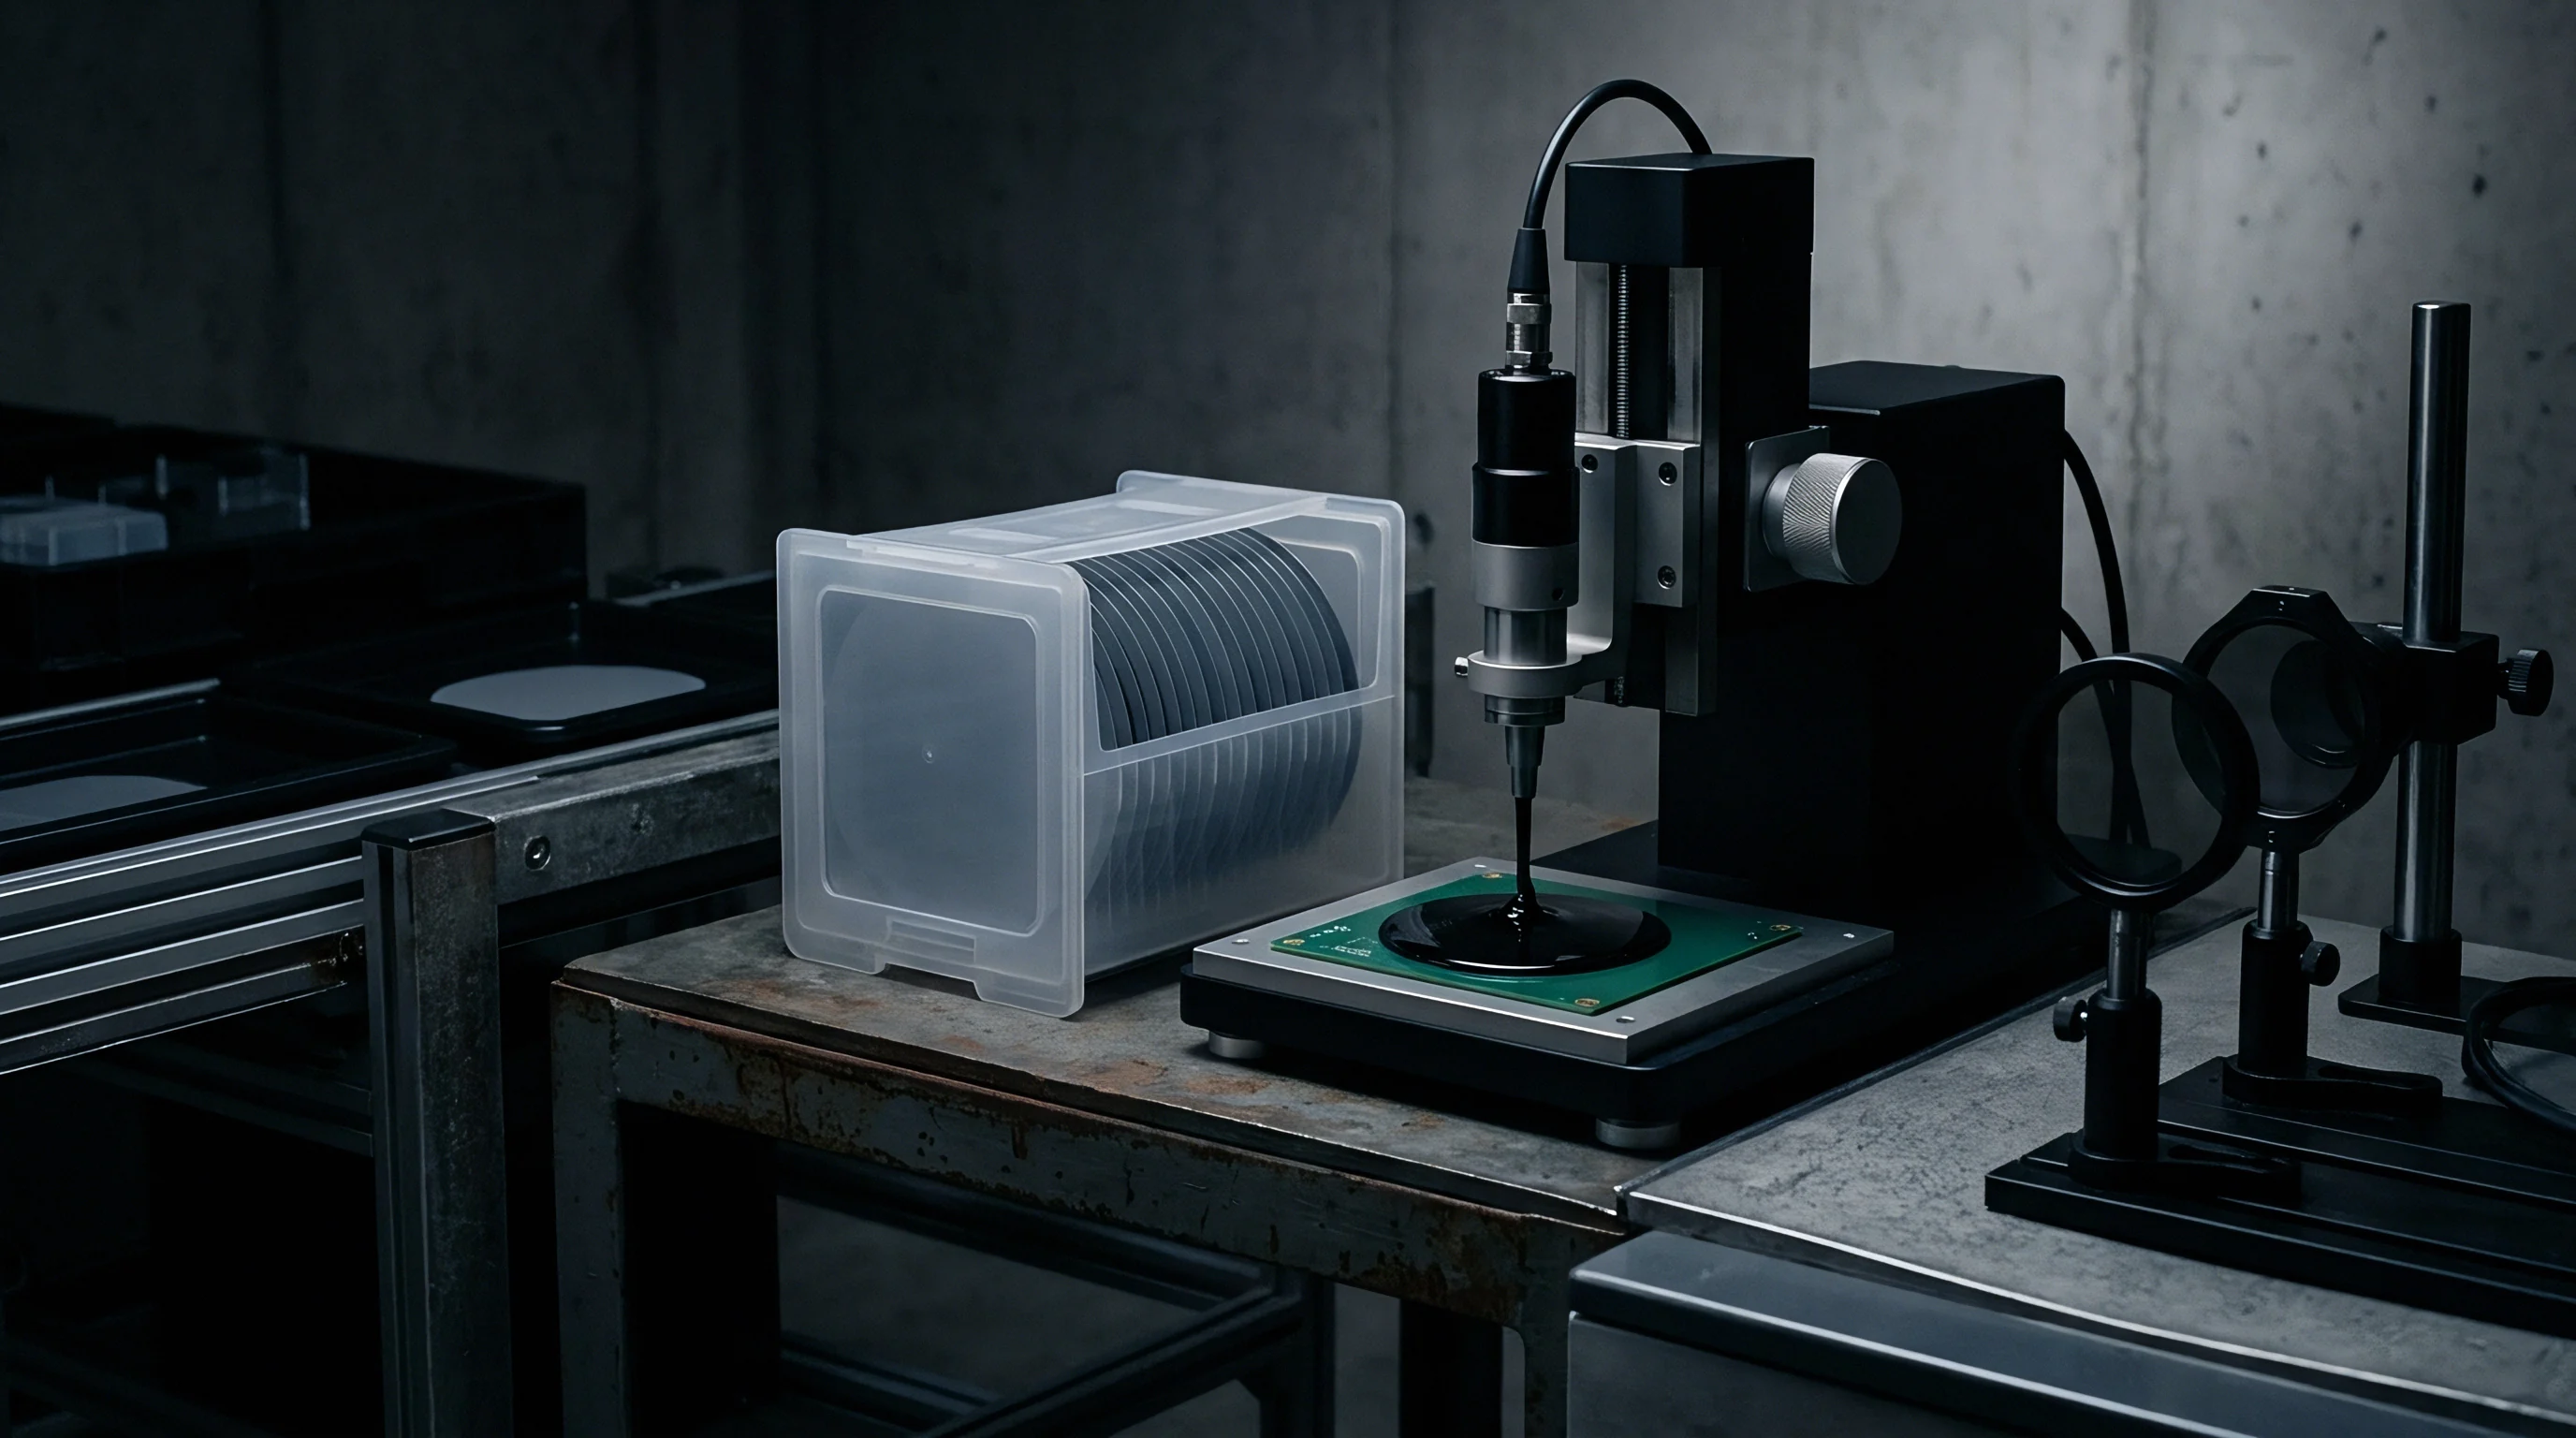
Active conditioning architectures replace passive trim networks with programmable gain amplifiers, digital-to-analog converters, and integrated temperature sensors. Analog signal conditioning integrated circuits measure the die temperature through an on-chip diode or dedicated thermal resistor. Internal logic uses this reading to dynamically adjust the sensor bridge excitation current or the amplifier gain through calibrated lookup tables.
| Architecture Type | Component Count | Span Drift Correction (% FS/100K) | Offset Drift Correction (% FS/100K) | Power Consumption (mW) |
|---|---|---|---|---|
| Passive Series Resistor Trim | 2 – 4 Passive Parts | 0.35 to 0.50 | 0.20 to 0.40 | 15.0 to 25.0 |
| Constant Current Drive | 1 Active Source | 0.15 to 0.25 | 0.15 to 0.30 | 5.0 to 12.0 |
| Analog ASIC Trim DAC | 1 Integrated Circuit | 0.05 to 0.10 | 0.03 to 0.08 | 2.0 to 6.0 |
| Digital Signal Processor (DSP) | 1 Microcontroller + ADC | 0.005 to 0.02 | 0.002 to 0.01 | 10.0 to 35.0 |
Digital signal conditioning converts the unamplified bridge output and the temperature sensor output directly into raw digital counts using a high-resolution sigma-delta converter. A digital processor applies polynomial correction algorithms, calculating corrected pressure values based on pre-stored calibration coefficients. Digital calibration eliminates residual analog errors.
A digital signal conditioning ASIC applying a third-order surface-fit model reduces combined thermal offset and span error to under 0.05 percent of full-scale across -40 to +125 degrees Celsius.
High-precision digital signal conditioning requires elevated power budgets to maintain continuous analog-to-digital conversion and numeric processing. Battery-powered field transmitters must carefully manage duty cycles, powering down the excitation voltage and converter stages between measurement bursts to extend operating life.
Matching the drive topology to the physical element coefficient sum minimizes downstream calibration complexity.

Drift
Zero offset shift under varying temperature presents a persistent challenge in piezoresistive transducer design. Unlike span shift, which scales proportionally with applied pressure, zero shift occurs independently of mechanical load. Thermal zero shift originates from structural, chemical, and electrical asymmetries within the piezoresistive Wheatstone bridge assembly.
A differential variation of just 0.01 percent in the resistance of one bridge arm relative to the others shifts the zero output by several millivolts.
Mechanical stress transferred from packaging materials represents a major source of thermal zero drift. Piezoresistive silicon dies possess a low coefficient of thermal expansion near 2.6 x 10 to the negative sixth power per Kelvin. Transducer housings constructed from stainless steel, brass, or aluminum exhibit thermal expansion coefficients three to eight times higher.
As ambient temperature changes, differential expansion between the silicon die, the die-attach adhesive, and the metallic housing generates mechanical stress gradients across the diaphragm. Package stresses induce spurious offset shifts.

Package Stress Coupling Mechanics
Silicon piezoresistors cannot distinguish between mechanical stress caused by media pressure and stress induced by package thermal expansion mismatch. When a silicon die is bonded to a header using epoxy or glass frit, thermal cycling introduces bending moments across the substrate. Die attach adhesives expand under heat.
Hard bonding materials such as gold-tin eutectic preforms transmit housing strain directly into the silicon lattice, yielding high offset sensitivity to package temperature changes. Soft elastomer die-attach materials isolate the die from housing strain but suffer from viscoelastic creep and thermal hysteresis over time. Polymer curing leaves permanent residual stress.
| Substrate Material | Coefficient of Thermal Expansion (10^-6 / K) | Young’s Modulus (GPa) | Induced Zero Shift (% FS / 50K) | Thermal Hysteresis (% FS) |
|---|---|---|---|---|
| Monocrystalline Silicon Die | 2.6 | 130 – 169 | Baseline | Baseline |
| Borosilicate Glass (Pyrex 7740) | 3.25 | 64 | 0.08 | 0.02 |
| Alumina Ceramic (96% Al2O3) | 6.5 | 300 | 0.25 | 0.05 |
| Kovar Alloy | 5.9 | 138 | 0.18 | 0.03 |
| 316L Stainless Steel | 16.0 | 193 | 0.85 | 0.18 |

How Does Die Attach Stress Accelerate Thermal Offset Drift?
Viscoelastic relaxation within organic die-attach adhesives changes the internal mechanical stress state of the piezoresistive die over extended high-temperature exposure. At elevated temperatures, polymer chains reorient under the influence of residual assembly stresses. This structural relaxation shifts the baseline mechanical strain applied to the piezoresistive bridge, manifesting as an unrecoverable zero offset drift.
The transducer fails to return to its original room-temperature output when cooled, creating thermal hysteresis that degrades long-term measurement repeatability.
Ignoring packaging-induced strain dynamics during sensor die selection leads directly to field failures where transducers pass initial room-temperature screening but fail specification tolerances after short thermal exposure in operational environments. Selecting an improper bonding formulation invalidates high-order digital thermal compensation algorithms, as the physical hysteresis violates the assumption of deterministic, repeatable thermal behavior.

Calibration
Correction of non-linear thermal coefficients requires multi-point thermal characterization during manufacturing. Automated test systems transport transducer assemblies into controlled environmental chambers while driving stable pressure references across the full operating range. Temperature stabilization must occur at every test point to eliminate thermal gradients across the sensor body that could distort characterization data.
The characterization process constructs a multi-dimensional matrix of raw bridge output counts against known pressure inputs and die temperature readings. Matrix dimensions depend on the target transducer accuracy class. High-accuracy instruments utilize grid matrices spanning at least five temperatures and five pressure levels, providing twenty-five calibration points to model complex coefficient interactions.

Polynomial Surface Fitting Models
A second-order or third-order bivariate polynomial models the relationship between raw sensor counts, temperature, and corrected output values. The mathematical surface equation accounts for zero shift, span shift, primary pressure non-linearity, and thermal cross-sensitivity terms.
EEPROM registers hold the polynomial terms. A third-order bivariate model uses a set of coefficients computed through least-squares regression optimization:
P_corrected = C00 + C10 S + C01 T + C20 S^2 + C11 S T + C02 T^2 + C30 S^3 + C21 S^2 T + C12 S T^2 + C03 T^3
S represents the uncorrected pressure bridge digital reading, while T represents the raw temperature sensor reading. The C01 coefficient corrects the linear thermal zero shift, C11 corrects the linear thermal span shift, and C02 accounts for non-linear temperature curvature. High-order cross-terms like C21 resolve the temperature dependence of pressure non-linearity.

Calibration Protocol Execution
- Soak the transducer batch inside the environmental chamber at the minimum specified operating temperature until internal thermal equilibrium is reached.
- Apply pressure points in incremental steps from zero to full-scale, recording raw digital pressure and temperature counts at each step.
- Ramp the environmental chamber to ambient room temperature and repeat the full-scale pressure step sequence after thermal stabilization.
- Elevate the chamber temperature to the maximum operating boundary, recording the final pressure step sequence under high thermal conditions.
- Execute least-squares matrix inversion algorithms to calculate individual correction coefficients for each transducer.
- Program calculated correction coefficients into the non-volatile memory of the integrated signal conditioning processor.
- Perform a verification run across pressure and temperature extremes to confirm residual error remains within specified tolerance bands.
Standard ISO 17025 testing requires calibration reference uncertainty to remain below one-fourth of the total target error budget of the piezoresistive transducer under test.
Requirements defined in IEC 61298-2 mandate that thermal characterization procedure profiles evaluate full-scale span limits across the complete rated environmental range. This protocol ensures that non-linear sensitivity shifts remain within published error envelopes across operational ambient transitions.

Supply
Procuring silicon piezoresistive elements requires clear specification of acceptable thermal coefficient distributions across wafer lots. Semiconductor foundries produce piezoresistive wafers using batch ion implantation and drive-in diffusion furnaces. Variations in furnace thermal profiles, gas flow dynamics, and implant dose tolerances introduce measurable spread in sheet resistance and thermal coefficients across a single silicon wafer and between production lots.
Wafer lots exhibit measurable doping spread. Unscreened commercial piezoresistive die display resistance tolerances of plus or minus twenty percent from target nominal values. The corresponding Thermal Coefficient of Resistance typically varies by plus or minus ten percent across a production run.
Procuring un-screened die forces sensor manufacturers to implement wider compensation ranges in downstream signal conditioning electronics, increasing system power consumption and testing duration.

Wafer Screening and Lot Acceptance Criteria
High-reliability transducer manufacturers specify wafer-level acceptance screening parameters to constrain thermal coefficient dispersion before die packaging. Automated wafer probers test sample dies across temperature steps directly on the un-diced wafer, generating lot-specific wafer maps of resistance and thermal coefficient distributions.
| Parameter | Standard Commercial Grade | Precision Industrial Grade | Automotive Qualified Grade |
|---|---|---|---|
| Bridge Resistance Tolerance (%) | +/- 20.0 | +/- 10.0 | +/- 5.0 |
| TCR Distribution Spread (ppm/K) | +/- 300 | +/- 150 | +/- 75 |
| TCS Distribution Spread (ppm/K) | +/- 400 | +/- 200 | +/- 100 |
| Uncompensated Thermal Zero Shift (% FS) | 1.5 | 0.8 | 0.3 |
| Substrate Junction Leakage at 150C (nA) | < 500 | < 100 | < 10 |
Procurement contracts incorporating automotive qualification rules under AEC-Q103-002 establish strict statistical process control limits for piezoresistive element manufacturing lines. Foundries must demonstrate process capability index numbers above 1.33 for both resistance and thermal coefficient parameters before lot release.
Sourcing audits reveal wafer foundry limits. Supply security demands tracking foundry wafer fabrication capacity alongside second-source qualification for critical piezoresistive element designs. Alternate wafer foundries use different implantation equipment, annealing cycles, and passivation chemistry, yielding distinct thermal coefficient profiles even when working from identical photomask layouts.
A key unresolved operational variable centers on whether wafer-level thermal probing at room temperature and elevated boundaries can reliably predict long-term thermal drift under combined mechanical stress and continuous electrical bias across extended industrial service lifetimes.