Nonlinear Varactor Capacitance and Active Device Junction Charge Thermal Drift Modeling
Modeling temperature-dependent built-in potential and grading coefficients prevents uncompensated phase noise degradation and RF tuning frequency drift.

Charge
Semiconductor depletion boundaries shift under applied bias and thermal changes. In reverse-biased junctions, space charge layer dynamics set the effective capacitance seen by high-frequency and precision measurement circuits. This capacitance changes nonlinearly with reverse voltage according to the dopant density profile across the region.
When operating temperatures rise, shifts in junction physics alter small-signal capacitance and dynamic stored charge. Unmodeled, these shifts induce frequency drift and amplitude distortion in voltage-controlled oscillators, RF tuning networks, and capacitive displacement sensors.
Space Charge Formulations in Reverse Biased Junctions
Depletion layer physics dictates the variable capacitance of p-n and Schottky barrier diodes. Reversing bias pulls mobile carriers back from the metallurgical junction, exposing fixed ionized donors and acceptors. As reverse voltage rises, this depletion region widens, acting as a dielectric gap between the conductive bulk regions.
The resulting voltage-dependent capacitance is defined by the built-in potential, applied voltage, and junction grading coefficient.
Small-signal junction capacitance models both structural geometry and voltage scaling:
C(V, T) = C0(T) / (1 – V / φ(T))^γ
Here, C0 is the zero-bias capacitance at a reference thermal state, V is the applied bias (negative for reverse bias), φ is the built-in barrier potential, and γ is the grading coefficient. Hyperabrupt junctions use retrograded doping to reach grading coefficients between 1.0 and 2.0, while abrupt junctions sit near 0.5 and linearly graded junctions typically land around 0.33.
Total space charge is the integral of small-signal capacitance across the bias range from zero to the operating voltage:
Q(V, T) = (C0(T) · φ(T) / (1 – γ)) ·
Thermal shifts alter this nonlinear charge profile. As temperature climbs, thermal excitation modifies carrier distributions and weakens the internal electric field in the space charge layer, causing net thermal drift in junction charge even at constant bias voltage.

Active Device Junction Capacitance Components
Transistors contain several parasitic and functional junctions that act as nonlinear varactors. In BJTs, collector-base and emitter-base depletion capacitances dictate high-frequency phase response and input impedance. FETs show nonlinear capacitance across gate-source, gate-drain, and drain-substrate junctions; in power MOSFETs and RF LDMOS devices, gate-drain capacitance swings sharply during switching as charge redistributes in the drift region.
| Semiconductor Technology | Junction Type | Built-In Potential Drift (mV/°C) | Capacitance TempCo at 3V Bias (%/°C) | Typical Grading Coefficient (γ) |
|---|---|---|---|---|
| Silicon Abrupt | p-n Junction | -2.1 to -1.9 | +0.04 to +0.06 | 0.48 to 0.52 |
| Silicon Hyperabrupt | Ion-Implanted Retrograde | -2.3 to -2.0 | +0.08 to +0.14 | 1.05 to 1.75 |
| GaAs Schottky | Metal-Semiconductor | -1.6 to -1.3 | +0.02 to +0.04 | 0.45 to 0.50 |
| SiGe BiCMOS BJT | Collector-Base Junction | -1.9 to -1.7 | +0.05 to +0.08 | 0.33 to 0.42 |
Slight changes in reverse-bias depletion width cause pronounced frequency shifts in high-Q tank circuits. Front-end designs that ignore thermal drift in junction charge face gain instability, calibration drift, and elevated out-of-band phase noise.

Silicon
Lattice heating narrows the effective bandgap and alters internal barrier potentials. In silicon, thermal generation produces electron-hole pairs, raising the intrinsic carrier concentration and shifting the Fermi level toward mid-gap. At the circuit level, these microscopic changes appear mainly as thermal drift in the built-in potential.
Built-In Potential Drift Dynamics
Junction barrier voltages decay linearly across operating temperature. Built-in potential depends directly on thermal voltage and intrinsic carrier concentration:
φ(T) = (k_B · T / q) · ln(N_A · N_D / n_i(T)^2)
Here k_B is Boltzmann’s constant, T is absolute temperature in Kelvin, q is electron charge, N_A and N_D are doping concentrations, and n_i is the intrinsic carrier concentration. Because n_i increases exponentially with temperature, the logarithmic term shrinks as the junction warms. This gives the built-in potential a negative temperature coefficient between -1.5 mV/°C and -2.5 mV/°C in standard silicon p-n junctions.
A built-in voltage shift of negative two millivolts per degree Celsius induces a three percent shift in varactor capacitance at low reverse bias.
A drop in built-in potential shrinks the denominator in the capacitance equation, raising small-signal capacitance for a given reverse bias. Thermal sensitivity peaks at low reverse bias, where applied voltage is comparable to the built-in potential. At higher reverse voltages, applied bias dominates the denominator and dampens the impact of built-in potential drift.
Temperature Coefficients of Grading and Saturation Current
Dopant activation stays stable across standard industrial temperatures (-40°C to +125°C), leaving the grading coefficient γ nearly constant. Reverse saturation current, however, grows rapidly with temperature, doubling roughly every 8°C in silicon junctions:
I_s(T) = I_s0 · (T / T_ref)^3 · exp
Higher reverse leakage introduces parallel resistance that degrades varactor Q. Current flowing through the junction generates localized self-heating; as power dissipation raises junction temperature above ambient, depletion capacitance expands beyond equilibrium small-signal predictions.
Published datasheets present total junction capacitance within fixed thermal limits, but standard parameter extraction uses short pulsed measurements that bypass self-heating during test.

Curvature
Dynamic voltage tuning exhibits pronounced nonlinearity in RF bias paths. In VCOs and tunable filters, the slope of the C-V curve defines tuning sensitivity, K_vco (in radians per volt-second). When thermal drift shifts the C-V curve along both capacitance and voltage axes, tuning sensitivity varies across the bias window, distorting transfer functions, degrading loop stability, and producing phase jitter.
Thermal Impact on Dynamic C-V Non-Linearity
Differentiating capacitance with respect to applied voltage gives the local slope of the tuning characteristic:
dC / dV = – (γ · C0) /
Thermal drift alters both the magnitude and derivative of this function, changing modulation indices across temperature. At higher temperatures, a lower built-in potential φ steepens the slope at low reverse bias, raising local tuning sensitivity. At higher reverse voltages, the slope flattens and sensitivity drops, causing variable frequency shifts for fixed control-voltage steps.
Uncompensated thermal drift in junction charge leads directly to several signal-chain failure modes:
- Center Frequency Detuning Operating frequency drops as ambient temperature rises due to the net increase in total tank capacitance.
- Phase Noise Degradation Increased varactor conversion sensitivity converts thermal voltage noise on the bias line into phase jitter.
- Harmonic Distortion Expansion Nonlinear charge redistribution under large RF signal swings generates second and third-order intermodulation products.
- Control Loop Instability Thermally induced variations in tuning slope alter phase margin inside phase-locked control loops.
Intermodulation distortion in RF varactors scales with the second derivative of capacitance relative to bias voltage. As temperature moves the operating point along this nonlinear curve, third-order intermodulation products shift accordingly.
Large continuous RF signals displace localized charge, pushing mean junction temperature above lead-frame measurements.

Arithmetic
Thermal compensation requires evaluating voltage-dependent capacitance coefficients directly. Offsetting thermal frequency drift in a high-Q tank circuit means matching the temperature response of the LC network with an opposing voltage shift on the varactor bias line. The following derivation shows how built-in potential drift translates to frequency offset and calculates the required bias correction.
Worked Derivation of Thermal Frequency Drift
Consider an RF voltage-controlled oscillator operating at a target center frequency of 1.000 GHz at 25°C. The tank network uses a fixed inductor L = 10.00 nH and a hyperabrupt silicon varactor biased at V = -3.00 V. The diode has zero-bias capacitance C0 = 12.00 pF at 25°C, built-in potential φ(25°C) = 0.750 V, and grading coefficient γ = 1.20.
First, calculate varactor capacitance C(V, 25°C) at nominal bias:
1 – V / φ = 1 – (-3.00 / 0.750) = 1 + 4.00 = 5.00
C(-3V, 25°C) = 12.00 pF / (5.00)^1.20 = 12.00 pF / 6.8986 = 1.7395 pF
Assuming parallel PCB and package parasitics of C_par = 0.7900 pF, total tank capacitance at 25°C is:
C_total(25°C) = 1.7395 pF + 0.7900 pF = 2.5295 pF
Verifying nominal resonant frequency:
f_0(25°C) = 1 / = 1 / = 1.0000 GHz
Evaluating system performance at T = 125°C (ΔT = +100°C) with a linear thermal coefficient dφ/dT = -2.00 mV/°C gives the modified built-in potential at 125°C:
φ(125°C) = 0.750 V + (-0.00200 V/°C · 100°C) = 0.550 V
Assuming C0 expands by +0.03%/°C due to physical growth (yielding C0(125°C) = 12.36 pF), recalculate the voltage scaling term and capacitance at V = -3.00 V:
1 – V / φ = 1 – (-3.00 / 0.550) = 1 + 5.4545 = 6.4545
C(-3V, 125°C) = 12.36 pF / (6.4545)^1.20 = 12.36 pF / 9.3521 = 1.3216 pF
Adding the constant parasitic capacitance yields total tank capacitance at 125°C:
C_total(125°C) = 1.3216 pF + 0.7900 pF = 2.1116 pF
The resulting resonant frequency at 125°C is:
f_0(125°C) = 1 / = 1.0943 GHz
Without compensation, the frequency shifts upward by +94.3 MHz (+94,300 ppm). This offset occurs because higher V/φ increases the denominator, lowering varactor capacitance.
| Thermal State (°C) | Varactor Bias (V) | Built-in Potential (V) | Varactor Capacitance (pF) | Resonant Frequency (GHz) | Net Drift (ppm) |
|---|---|---|---|---|---|
| -40 | -3.00 | 0.880 | 2.1042 | 0.9421 | -57,900 |
| +25 | -3.00 | 0.750 | 1.7395 | 1.0000 | 0 (Reference) |
| +85 | -3.00 | 0.630 | 1.4651 | 1.0592 | +59,200 |
| +125 | -3.00 | 0.550 | 1.3216 | 1.0943 | +94,300 |
| +125 (Compensated) | -1.84 | 0.550 | 1.7395 | 1.0000 | 0 (Restored) |
Back-to-back varactor topologies cancel odd-order nonlinear distortion while doubling net series tuning voltage requirements.
To eliminate this shift, the bias controller must adjust applied voltage V(T) to keep varactor capacitance at 1.7395 pF across temperature. Setting C(-3V, 25°C) equal to C(V_comp, 125°C):
1.7395 pF = 12.36 pF / (1 – V_comp / 0.550)^1.20
(1 – V_comp / 0.550)^1.20 = 12.36 / 1.7395 = 7.1055
1 – V_comp / 0.550 = (7.1055)^(1 / 1.20) = 5.0886
-V_comp / 0.550 = 4.0886
V_comp = -2.2487 V
Reducing reverse bias from -3.00 V to -2.25 V compensates for the lower built-in potential, holding center frequency stable over temperature. In hardware, thermistors or DAC-driven lookup tables supply this compensating voltage shift.

Clamp
Bench measurements of voltage-dependent capacitance require clean protocols to isolate ambient thermal effects from die self-heating. Continuous AC signals from standard LCR meters drive internal resistive heating. Vector network analyzers used in thermal chambers need pulsed bias setups to measure dynamic small-signal response accurately.
Bench Protocols for Parameter Extraction
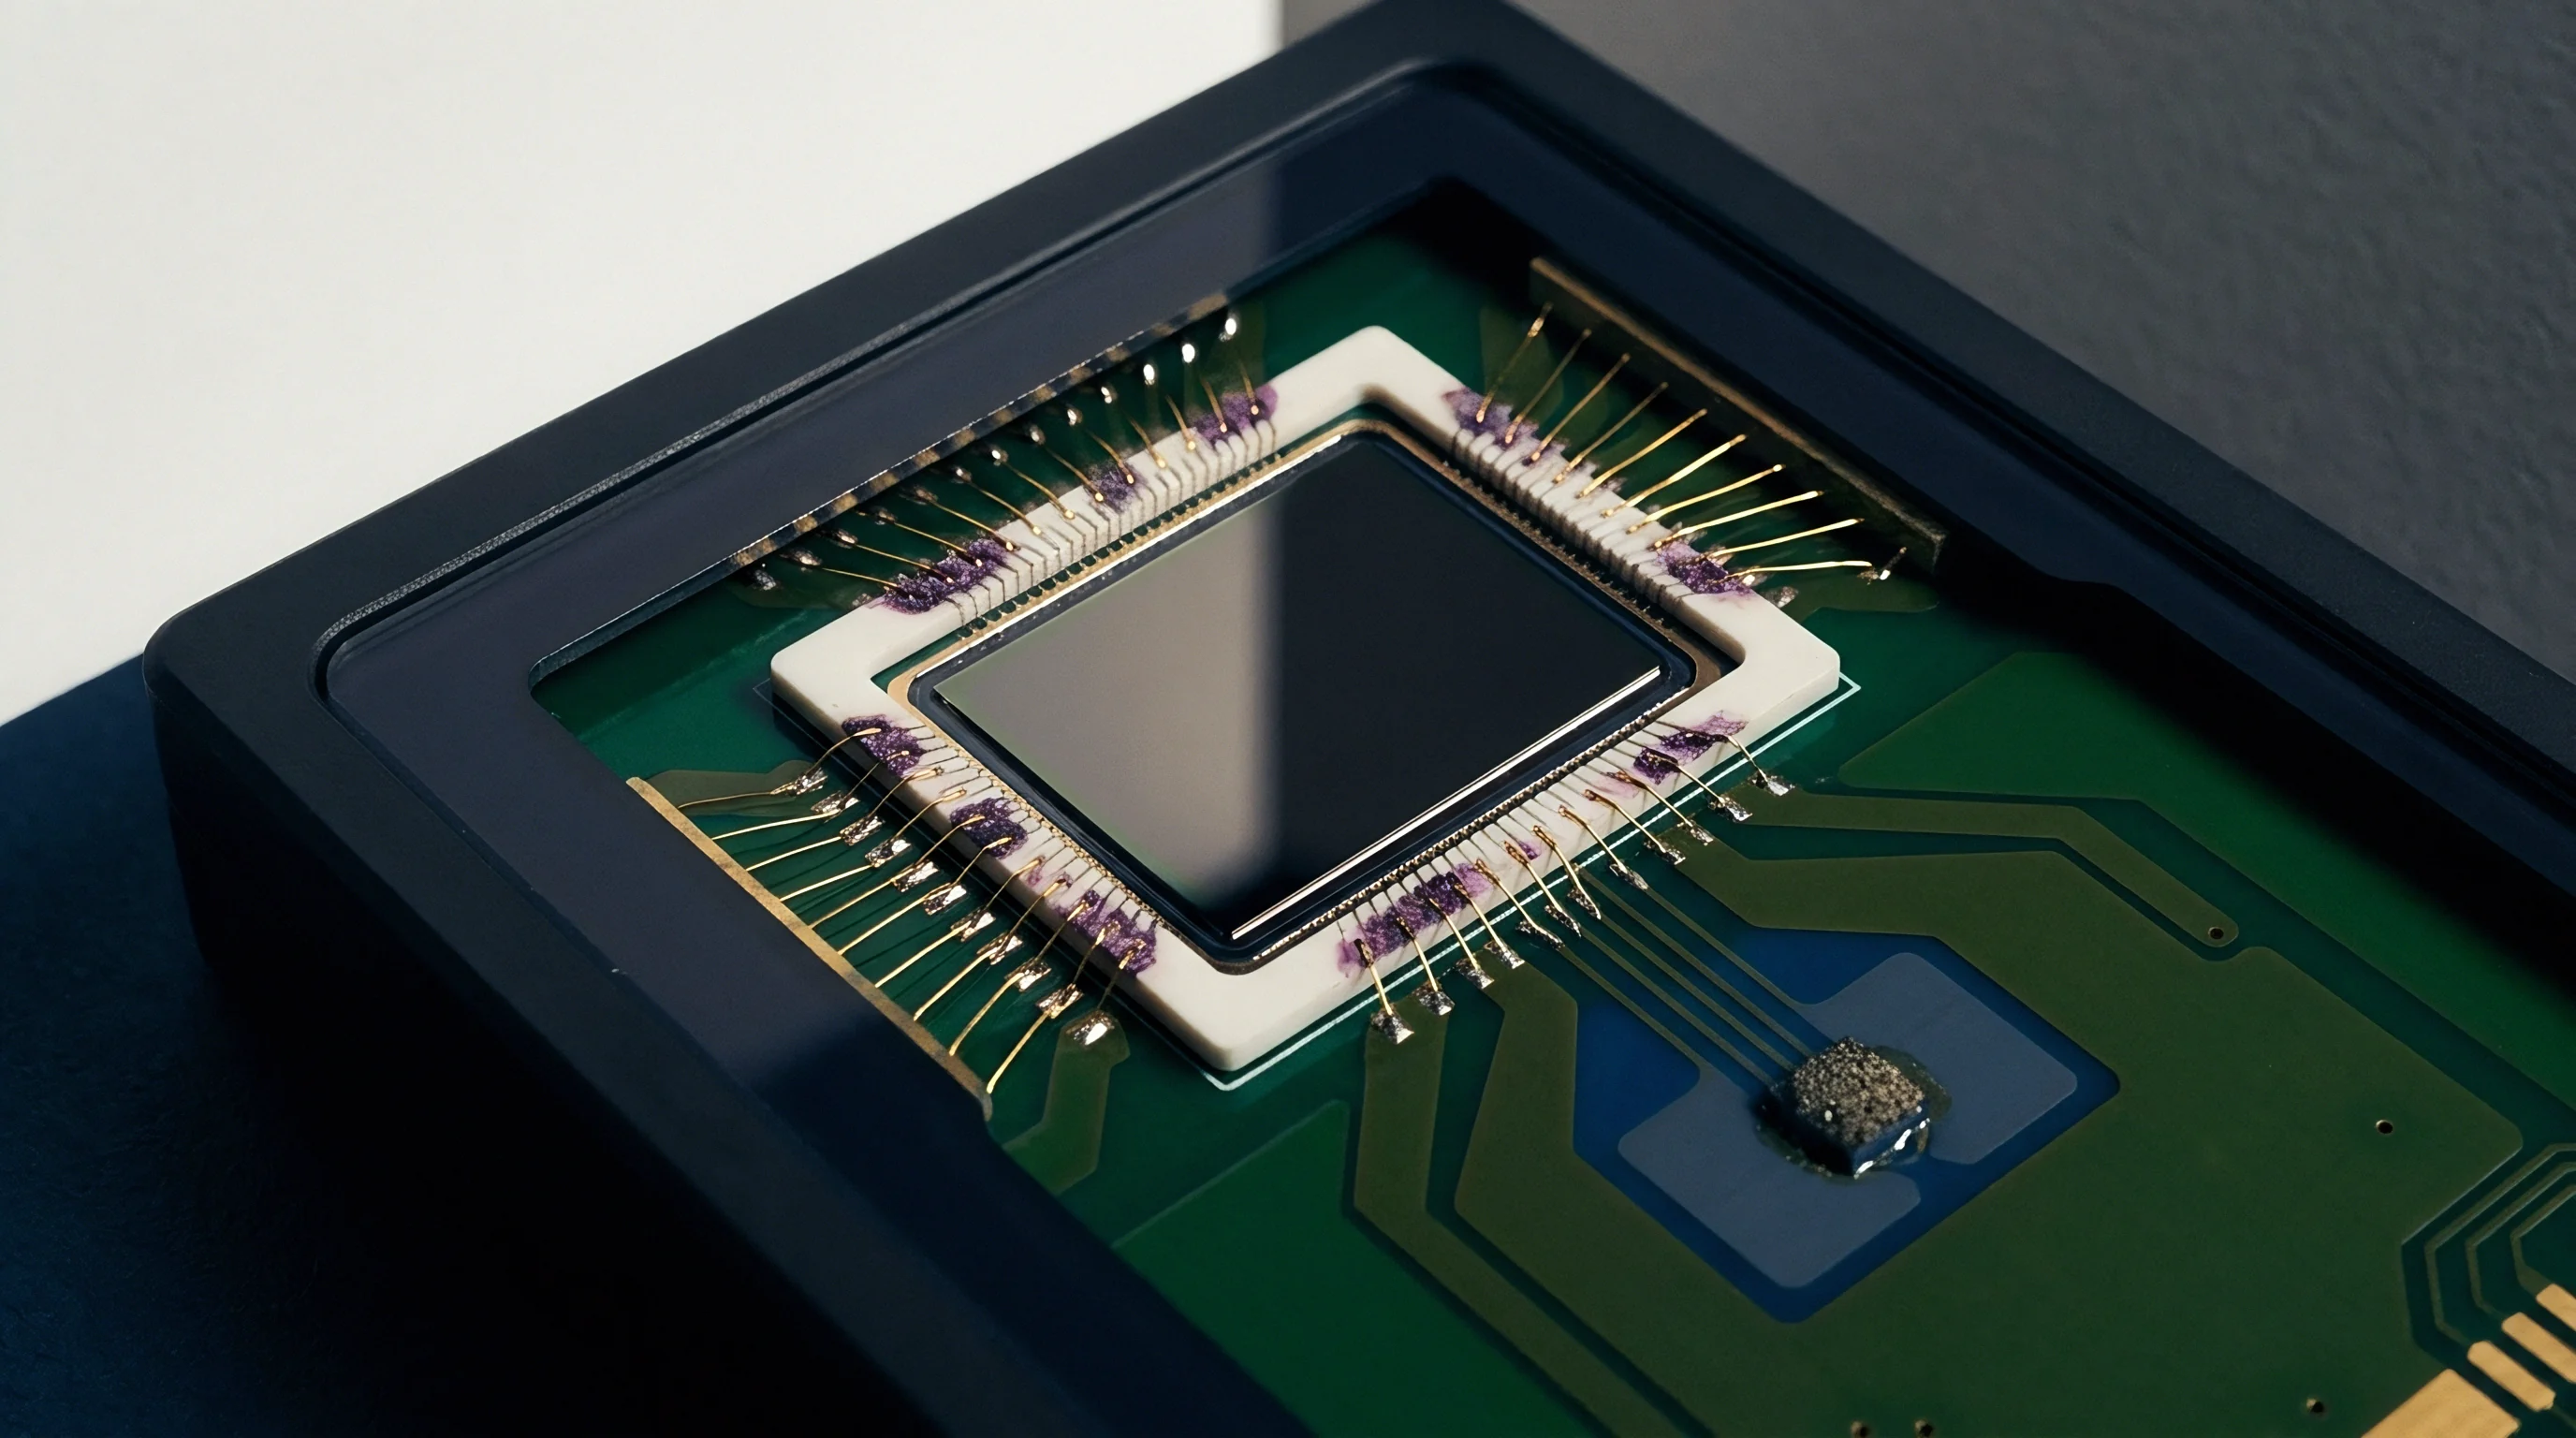
Extracting junction parameters over temperature requires controlled physical mounting and clamping. Fixtures must minimize stray capacitance while keeping thermal resistance to the device leads low.
- Mount the package on a temperature-controlled copper thermal chuck using high-density beryllium oxide isolation washers.
- Connect four-terminal Kelvin leads from a pulsed impedance analyzer directly to the package pins.
- Apply microsecond-scale bias pulses to limit self-heating under high reverse leakage.
- Measure real and imaginary admittance across RF frequencies from 10 MHz to 3 GHz.
- Extract built-in potential and grading coefficient by fitting 1/C^(1/γ) against applied bias with logarithmic regression.
Non-compliance with standardized thermal pulse extraction protocols invalidates nominal junction capacitance drift figures printed in commercial component documentation.
Automated extraction software fits measured C-V data to compact SPICE models like Gummel-Poon or BSIM varactor representations. Fixture parasitics are calibrated out using open-short-load standards rated across the full temperature range.
IEC 60747-3 compliance requires recording capacitance-voltage parameters under isothermal conditions, keeping die temperature within ±0.5°C of the ambient chuck.

Yield
Sourcing hyperabrupt varactors and low-noise active devices requires tracking fabrication tolerances. Lot-to-lot variation in wafer doping alters zero-bias capacitance C0 and grading coefficient γ. In temperature-critical RF front-ends, wide part tolerances compound thermal drift and force manual tuning during assembly if left unaddressed.
Commercial Qualification and Specification Audits
Procurement teams should verify that datasheets bound thermal parameters rather than listing them only as typical figures, which offer no guarantee across production volumes.
- Grading Coefficient Tolerance Verification Confirm wafer lot testing bounds gamma variance within ±5% to ensure consistent tuning sensitivity.
- Reverse Leakage Thermal Ceiling Specification Require maximum reverse current guarantees at elevated temperature limits to avoid runaway thermal loading.
- Automotive Qualification Dossier Review Verify AEC-Q101 testing data for discrete diodes or AEC-Q100 data for integrated active junction arrays.
- Second-Source Die Geometry Audit Compare physical die dimensions and doping mechanisms between primary and secondary suppliers to prevent unexpected phase noise shifts.
Procurement specifications for wide-temperature military or automotive systems often require factory binning, tightening C0 tolerance bands from nominal ±10% down to ±2%.
Because binning increases landed unit cost, system designers must weigh purchasing tightly binned, sole-sourced varactors against implementing active bias compensation directly on the host PCB.