Modeling Non-Linear Vibration Rectification Bias in Multi-Axis Dynamic Gravity Vector Estimation
Non-linear vibration rectification introduces false zero-frequency DC offsets in MEMS accelerometers that distort dynamic gravity vector estimation under multi-axis vibration.


Mechanism
Silicon capacitive accelerometers experience non-linear output distortion when high-frequency vibration pushes the proof mass beyond its linear displacement range. In multi-axis settings, continuous periodic motion along one axis can produce an unintended static force signal along an orthogonal axis. This effect, known as vibration rectification bias, introduces persistent DC acceleration errors into gravity vector calculations during dynamic operation.
When an inertial measurement unit sits on a vibrating platform ~ such as a helicopter airframe, an industrial compressor, or an off-highway vehicle engine ~ high-frequency kinetic energy translates directly into a false tilt offset. Host navigation systems interpret this artificial bias as an actual shift in orientation, corrupting attitude estimation algorithms and dynamic gravity tracking.
Vibration rectification bias stems primarily from the sensor element’s second-order non-linear coefficient, k2. An ideal linear accelerometer outputs a voltage proportional to physical acceleration a, following the equation y = S · a + B, where S is the scale factor and B is zero-g bias. In physical micromachined silicon structures, mechanical flexure non-linearities, electrostatic pickoff asymmetries, and squeeze-film gas damping shift the transfer function into a non-linear power series:
y(t) = S · left( a(t) + k2 · a2(t) + k3 · a3(t) + kxy · ax(t) ay(t) right) + B
Applying a purely sinusoidal vibration input a(t) = A sin(ω t) to this non-linear element yields a term proportional to A2 sin2(ω t). Trigonometric expansion reduces this squared term to 0.5 · A2 (1 – cos(2ω t)), giving a time-averaged mean of 0.5 · k2 · A2. High-frequency vibration well past the downstream attitude filter’s active bandwidth thus generates a stationary DC bias shift proportional to the square of vibration amplitude.
In effect, rectification acts as an envelope demodulator, shifting out-of-band oscillatory motion straight into the zero-frequency baseline.

Asymmetric Flexure Displacement and Squeeze Film Non-Linearity
Damping forces inside micromachined cavity gaps scale inversely with the cube of the distance between the proof mass and fixed electrode. When acceleration pushes moving comb fingers toward the stationary stator, air squeezed between the surfaces creates a resistive pressure that increases sharply at close range. On the return stroke, fluid resistance drops quickly as the mass retreats.
This spatial asymmetry in squeeze-film damping distorts the resistance profile over a full mechanical cycle; the proof mass spends slightly longer decelerating near the stator than returning to equilibrium, leaving a net directional bias across repeated vibration cycles.
Silicon flexure springs also vary in stiffness under large deflections. Hooke’s Law holds for small displacements, but high-amplitude acceleration drives silicon beam flexures into non-linear stress regimes. Beam stretching increases effective stiffness at extreme displacements, turning symmetric force inputs into asymmetric physical motion.
Electrostatic force gradients across capacitive pickoff gaps compound the problem: attractive forces between parallel plates vary inversely with the square of the gap distance, pulling the mass closer to an electrode as it approaches, opposing the mechanical restoring force and widening differential pickoff imbalance.
Vibration rectification bias converts out-of-band oscillatory motion directly into an unrecoverable DC bias shift before any digital filter can process the sensor signal.
Multi-axis dynamic interactions introduce cross-coupling rectification modes that do not exist under single-axis testing. Cross-axis rectification coefficients, designated kxy, kxz, and kyz, describe how acceleration along an orthogonal axis alters pickoff alignment on the primary axis. Physical motion along the X-axis induces micro-torsion or bending across Y-axis silicon support frames.
When X-axis sinusoidal vibration aligns in phase with Y-axis excitation, the product term ax(t) ay(t) generates a non-zero time-averaged product. Structural cross-talk transforms combined multi-axis vibration profiles into complex bias shifts across all three sensed dimensions simultaneously.

Mathematical Formulations of Quadratic and Higher Order Bias
Expanding the sensor output in a Taylor series relative to input physical acceleration highlights the harmonic components generating spurious DC offsets. Beyond second-order quadratic terms, third-order cubic terms k3 · a3(t) generate third-harmonic distortion without producing direct zero-frequency offsets under single-frequency excitation. When dual-tone or broadband random vibration drives the mechanical element, intermodulation between distinct frequency components creates difference frequencies that fall directly inside the active measurement bandwidth.
Broadband vibration profiles specified by power spectral densities generate continuous rectification spectrums across the low-frequency region.
Evaluating the expected bias shift under random Gaussian vibration involves integrating the second-order coefficient over the effective power spectrum of the excitation signal. Assuming a continuous vibration power spectral density Wa(f) in units of g2/Hz, passing through the sensor mechanical transfer function Hm(f), the total rectified zero-frequency offset Δ BDC obeys the integral equation:
Δ BDC = k2 int0infty Wa(f) · |Hm(f)|2 , df
When input vibration spectral content aligns with the mechanical resonant frequency of the sensor flexure system, the amplification factor Q multiplies displacement by an order of magnitude or more. Elevated mechanical response elevates the squared acceleration magnitude a2(t), multiplying the rectified bias by Q2. Sensor designs operating with low mechanical damping factors demonstrate extreme susceptibility to high-frequency structural excitation, even when excitation frequencies sit far above the electrical sample rate of the processing system.
Failure to account for non-linear vibration rectification during transducer selection introduces systematic, uncorrectable errors into downstream gravity vector state estimators.
- Asymmetric Mechanical Saturation occurs when peak acceleration drives the proof mass into physical contact with mechanical stops, clipping half of the oscillatory waveform and generating massive DC bias shifts.
- Squeeze-Film Pressure Imbalance arises within narrow air gaps where fluid resistance during compressive stroke exceeds fluid resistance during rarefaction stroke.
- Cross-Axis Structural Deformation develops when high-g excitation along one axis twists or tilts orthogonal support beams, altering capacitive sensing gaps on adjacent axes.
- Harmonic Intermodulation Distortion emerges under multi-tone vibration profiles, mixing discrete spectral lines into low-frequency beat patterns that corrupt baseline bias readings.
- Electrostatic Force Non-Linearity grows as capacitive plate separation decreases, creating an asymmetric attraction gradient that opposes mechanical restoring spring forces.
Ignoring these physical transduction mechanisms during initial system architecture design leads directly to persistent orientation drift in dynamic environments. Hardware changes, structural isolator additions, and sensor re-evaluations become necessary after field deployment reveals unacceptable heading and tilt errors.


Kinematics
Triaxial sensor clusters couple translational vibration along orthogonal physical axes through cross-axis sensitivity matrices and structural deformation. Estimating a stable gravity vector from an array of accelerometers requires isolating true low-frequency tilt components from high-frequency motion vectors. During multi-axis vibration, non-linear rectification skews the output array, introducing artificial acceleration components that project directly into tilt calculation equations.
In an Attitude and Heading Reference System (AHRS) or Strapdown Inertial Navigation System (SINS), these false acceleration signals mix with true gravity vector projections, inducing steady-state orientation errors that accumulate inside velocity and position integration loops.
Mathematical projection of the gravity vector g in the body frame relies on instantaneous readings from X, Y, and Z accelerometer channels. In a static frame, the measured vector magnitude equals 1.0 , g, and the vector orientation defines pitch and roll angles relative to local horizon coordinates. When the sensor frame experiences continuous broadband angular and translational vibration, rectified zero-frequency biases Δ Bx, Δ By, and Δ Bz distort the sensed vector balance.
The corrupted gravity vector estimate hatgb reads:
hatgb = beginbmatrix gx + Δ Bx \ gy + Δ By \ gz + Δ Bz endbmatrix = beginbmatrix -g sinthη + 0.5 k2,x Ax2 \ g costhη sinφ + 0.5 k2,y Ay2 \ g costhη cosφ + 0.5 k2,z Az2 endbmatrix
These additive bias terms shift both the calculated magnitude and direction of the reference gravity vector. Calculated roll angle φ and pitch angle thη deviate from true physical orientation by quantities proportional to the differential bias spread across axes. Unbalanced rectification coefficients across orthogonal axes transform symmetric vibration fields into asymmetric tilt offsets, misleading orientation filter states even when overall translational motion remains strictly zero on average.
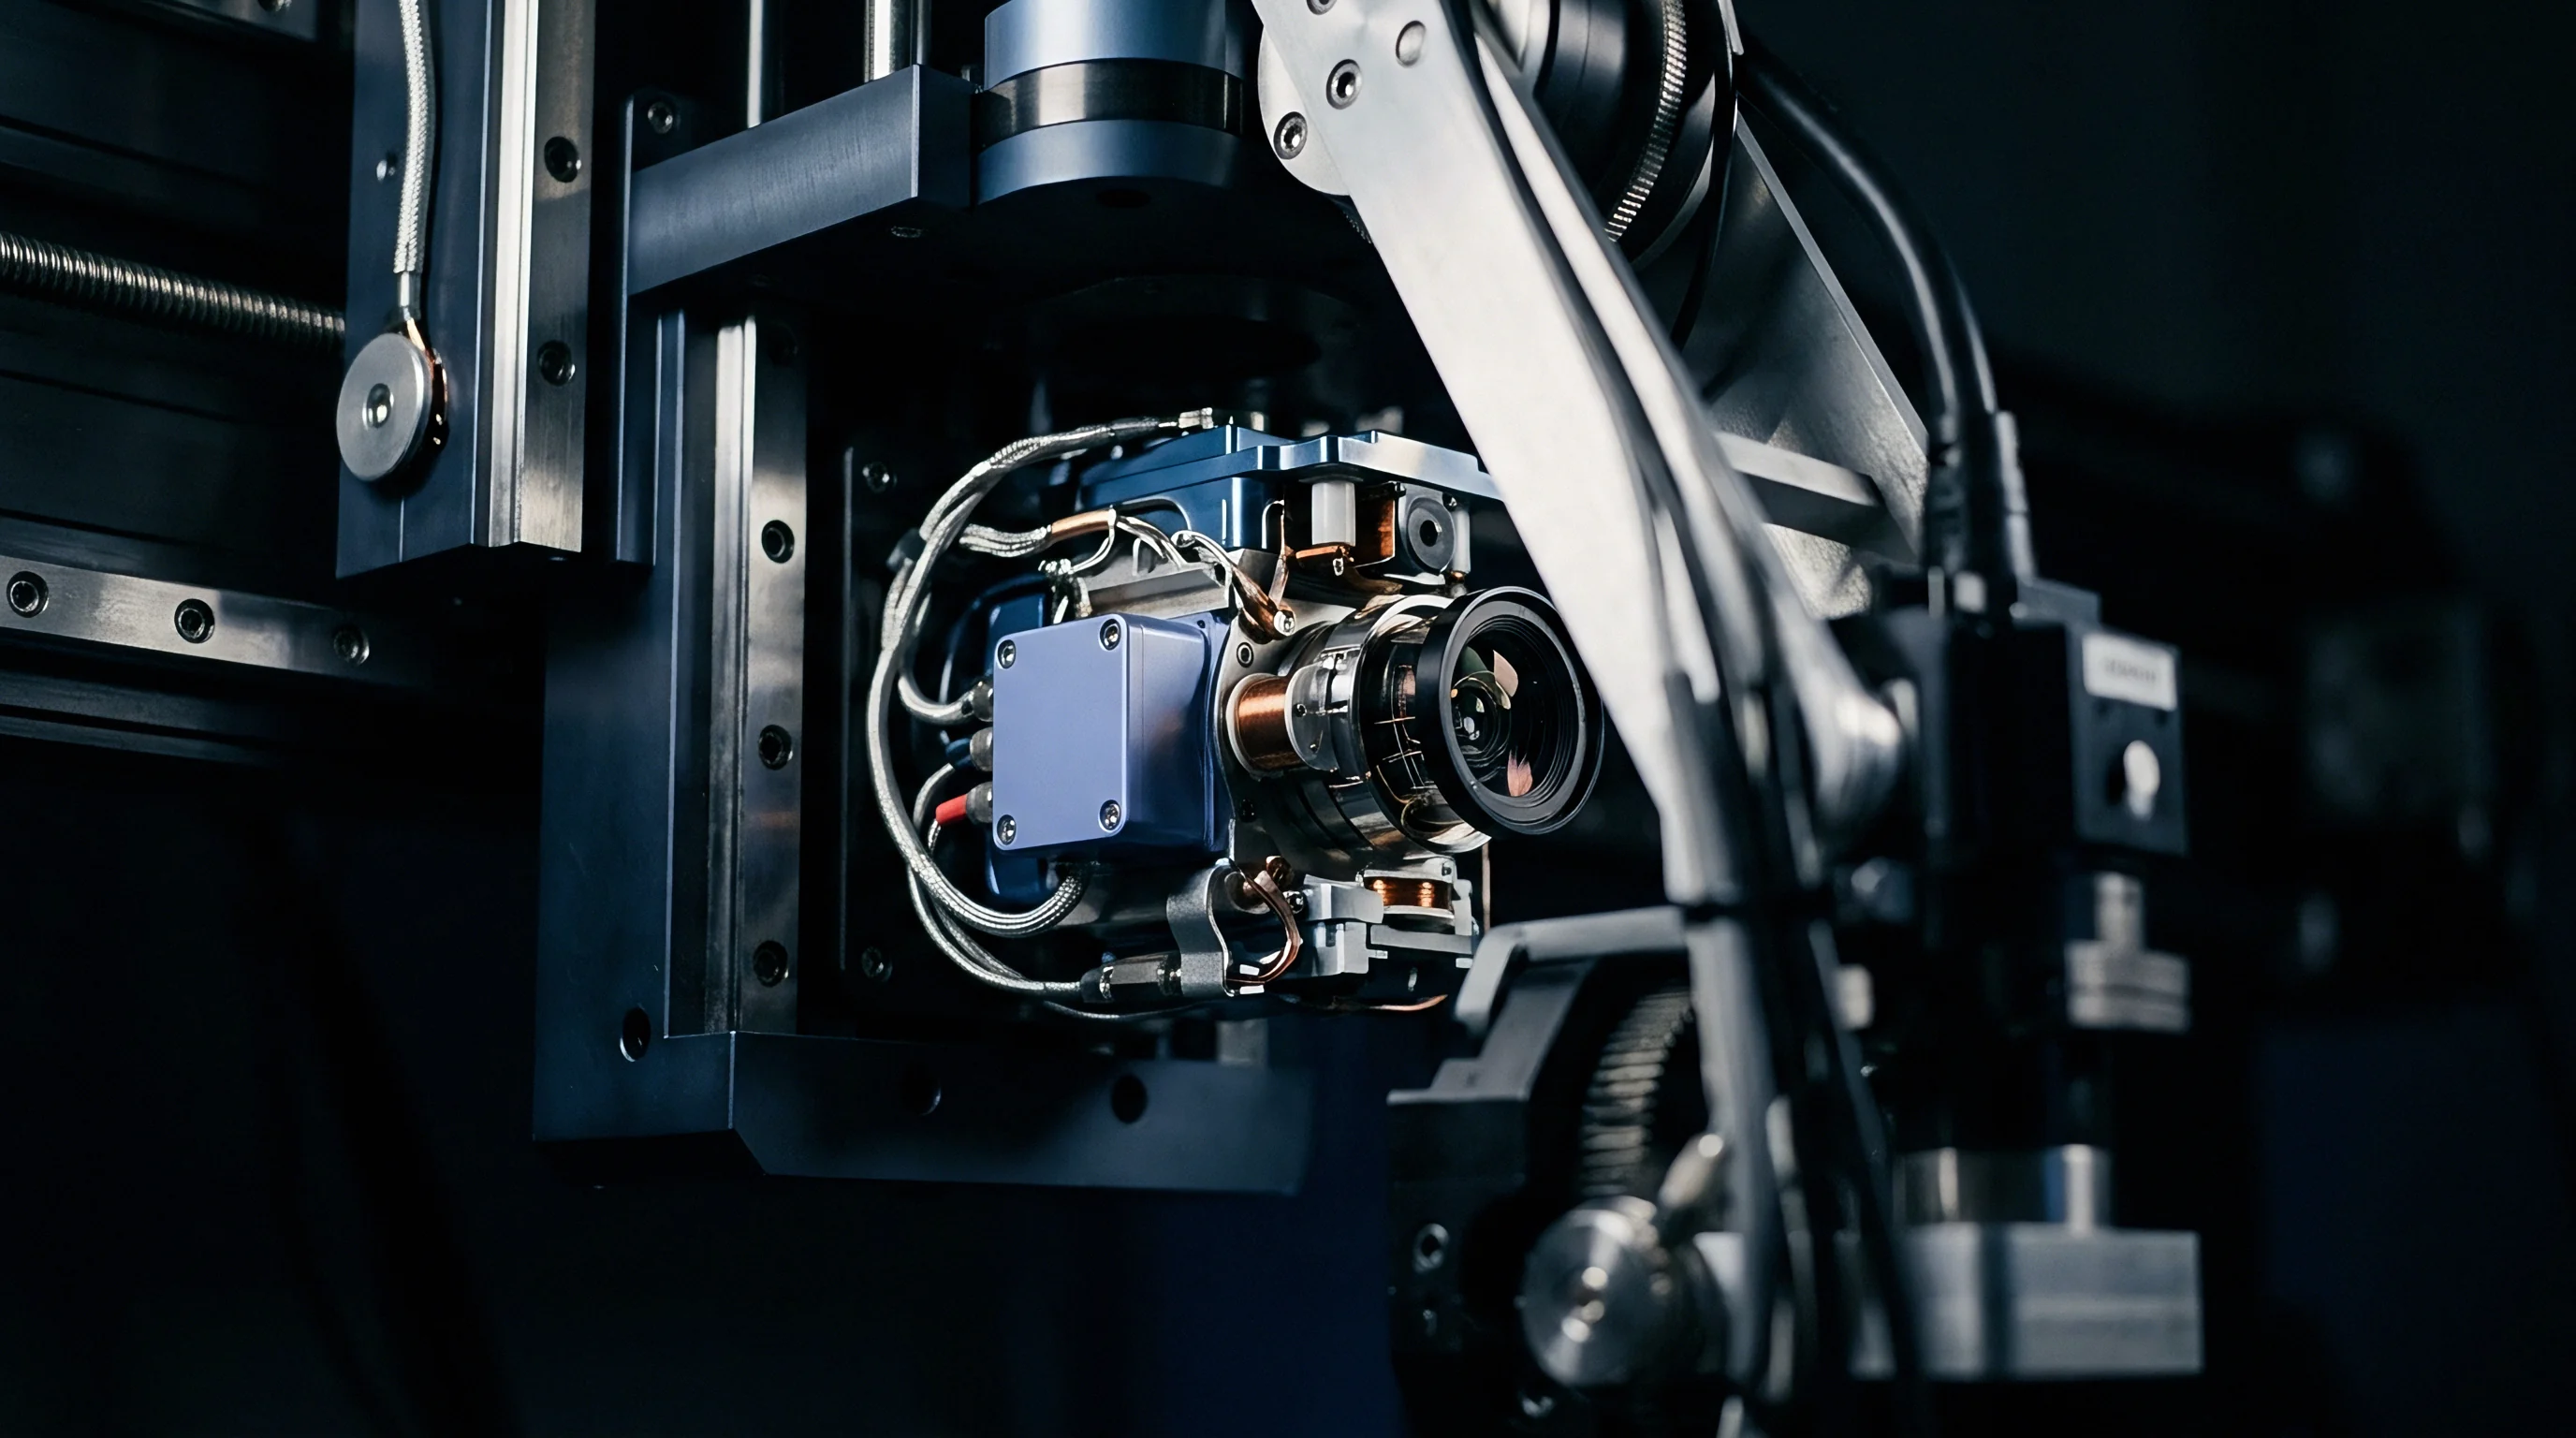
Phase Dependent Multi Axis Interaction Dynamics
Coordinated multi-axis vibration introduces phase-dependent cross-rectification effects that depend directly on the relative phase angle between orthogonal vibration components. When an accelerometer cluster experiences circular or elliptical motion in two dimensions, acceleration along the X-axis correlates tightly with acceleration along the Y-axis, shifted by a phase angle φxy. Cross-axis coupling coefficients kxy produce continuous zero-frequency offsets whose magnitude scales with cos(φxy).
Quad-rotor drone frames, engine blocks, and marine hull structures generate correlated multi-axis vibration fields where phase alignment remains fixed over extended operational periods.
Bench measurements of triaxial capacitive dies under 10 g RMS vibration show cross-axis coupling generating a 1.2 millig false tilt shift. Symmetrical single-axis vibration testing entirely fails to reveal this mode, as phase-correlated cross-coupling terms demand simultaneous multi-axis drive inputs to manifest. Structural twisting across the sensor substrate during multi-axis excitation modifies orthogonal pickoff gap widths in real time, altering sensor scale factors synchronously with acceleration cycles.
The resulting bias shift combines single-axis k2 effects with cross-coupling coefficients in a complex non-linear tensor equation.
| Vibration Profile | Frequency Band | Axis Acceleration (g RMS) | Theoretical k2 Shift (mg) | Observed Vector Drift (deg) |
|---|---|---|---|---|
| 100 Hz to 300 Hz | 5.0 g (X-axis only) | 0.375 | 0.021 | |
| 200 Hz Harmonic | 5.0 g (X-axis), 5.0 g (Y-axis) | 0.950 | 0.054 | |
| 200 Hz Harmonic | 5.0 g (X-axis), 5.0 g (Y-axis) | 0.380 | 0.022 | |
| 20 Hz to 2000 Hz | 10.0 g RMS (All Axes) | 2.850 | 0.163 | |
| 1.2 kHz Structural Peak | 15.0 g RMS (All Axes) | 8.400 | 0.481 |
The vector drift observed in multi-axis setups scales non-linearly with total vibration energy. As total power spectral density increases, local micro-structures within the MEMS package flex, altering physical orthogonality angles between sensing axes. Non-orthogonality matrix terms mathbfTortho interact with rectified DC offsets, compounding alignment errors inside the attitude estimation filter.

Transformation of Rectified DC Bias into Filter State Pitch and Roll Errors
Attitude filters, such as Extended Kalman Filters (EKF) or complementary filter structures, fuse accelerometer readings with rate gyroscope data to maintain continuous platform orientation estimates. Gyroscopes offer low-drift short-term tracking, while accelerometers provide long-term absolute reference by sensing gravity. When vibration rectification introduces a persistent false DC offset into the accelerometer vector, the filter interprets this signal as continuous horizontal linear acceleration or physical tilt shift.
The Kalman filter update equations attempt to minimize residual innovations between gyro-propagated tilt and accelerometer-derived tilt.
Over time, the residual error forces the filter correction states to adjust velocity and orientation estimates to match the false gravity vector. If the filter covariance parameters assign high confidence to accelerometer observations, orientation estimates drift rapidly toward the corrupted vector baseline. Lowering accelerometer measurement gains reduces sensitivity to rectified bias, but degrades system ability to correct for long-term gyroscope bias drift.
Balancing filter tuning without addressing underlying mechanical sensor rectification creates an unresolvable trade-off between baseline orientation stability and vibration rejection capability.
What structural modifications inside multi-axis MEMS packages effectively isolate orthogonal sensing comb flexures from cross-axis resonance interactions under continuous multi-tone excitation?
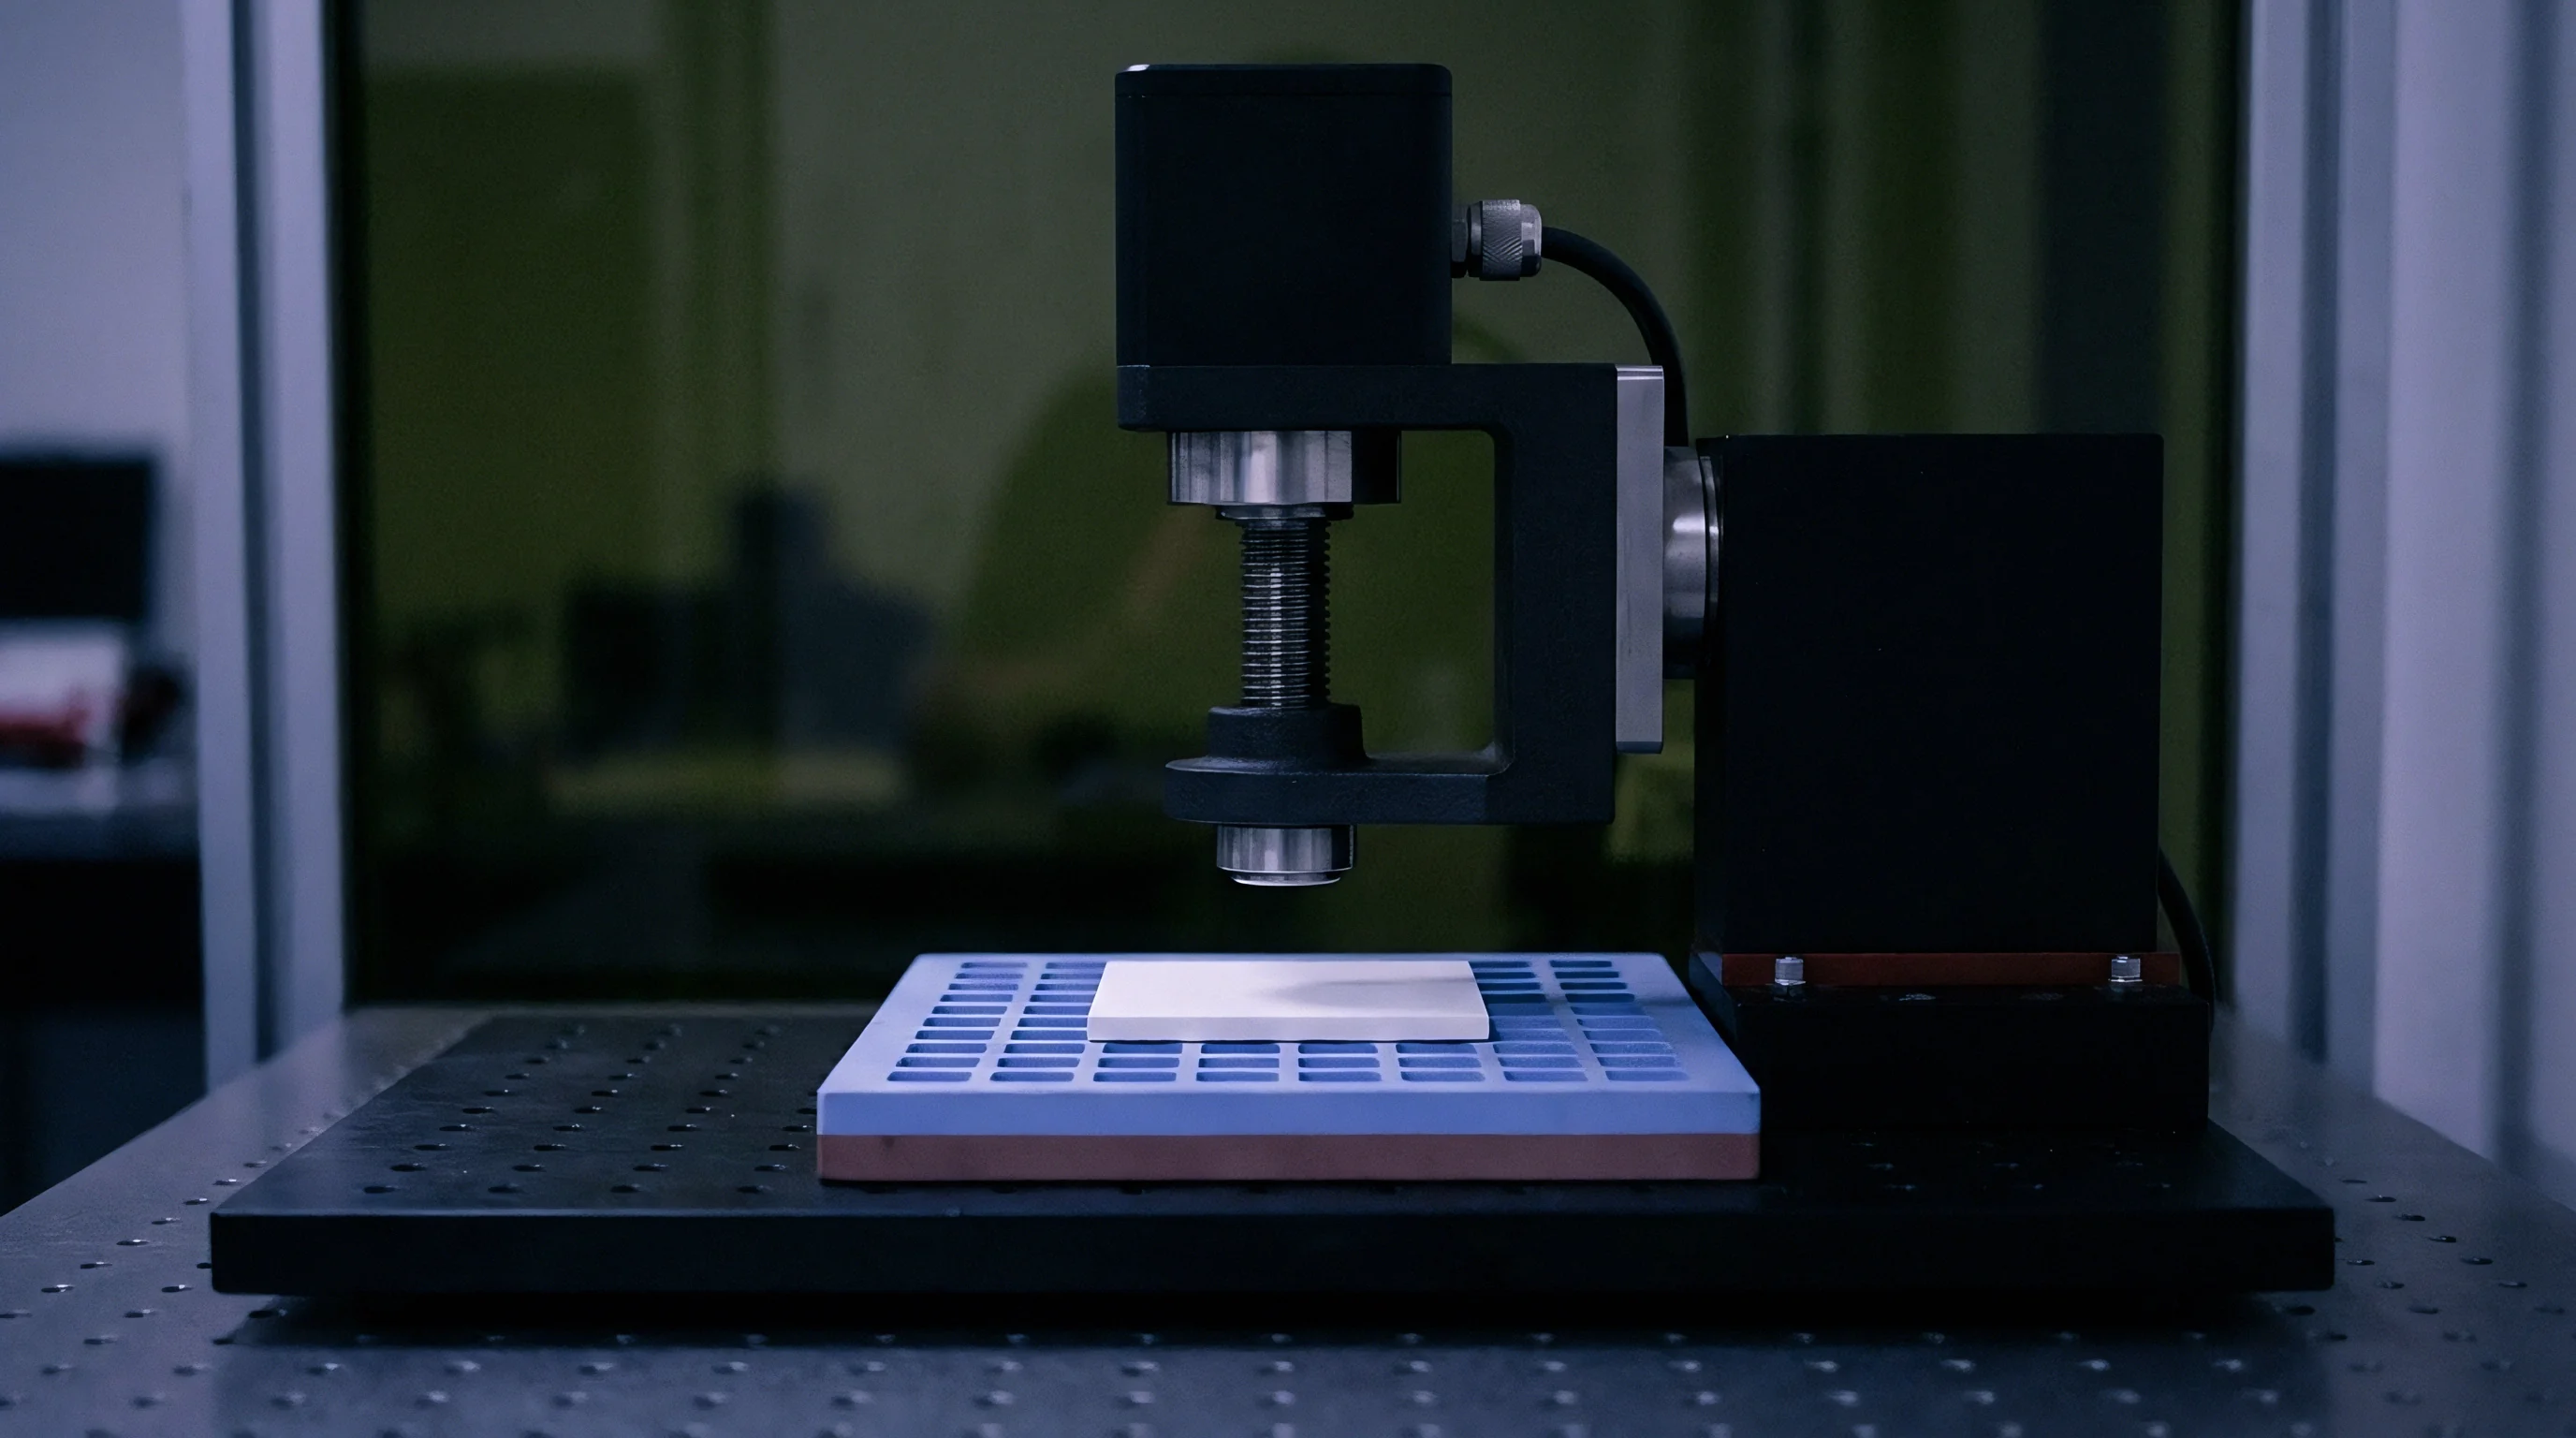

Extraction
Measuring second-order non-linear terms across three orthogonal axes demands high-g sinusoidal excitation combined with precise static tilt alignment. Standard static multi-position tumble tests determine zero-g offset and linear scale factor, but cannot isolate quadratic rectification coefficients k2. Characterizing vibration rectification requires subjecting the device under test to pure single-frequency or swept-frequency sinusoidal vibration while holding its physical position perfectly fixed relative to the local gravity field.
Comparing the un-vibrated static output baseline against the time-averaged output under continuous vibration isolates the rectified DC offset Δ BDC.
Single-axis characterization uses an electrodynamic shaker table equipped with an ultra-low distortion air-bearing armature. Standard flexure-guided shakers often introduce high cross-axis harmonic acceleration, which distorts k2 measurements by injecting unmeasured orthogonal vibration into the sensor structure. A reference control accelerometer possessing known low vibration rectification parameters, typically a quartz flexure design, sits mounted adjacent to the test device to measure exact input acceleration levels Ain(t).
The test protocol sweeps vibration excitation across a broad spectral range while recording long-term average output levels.
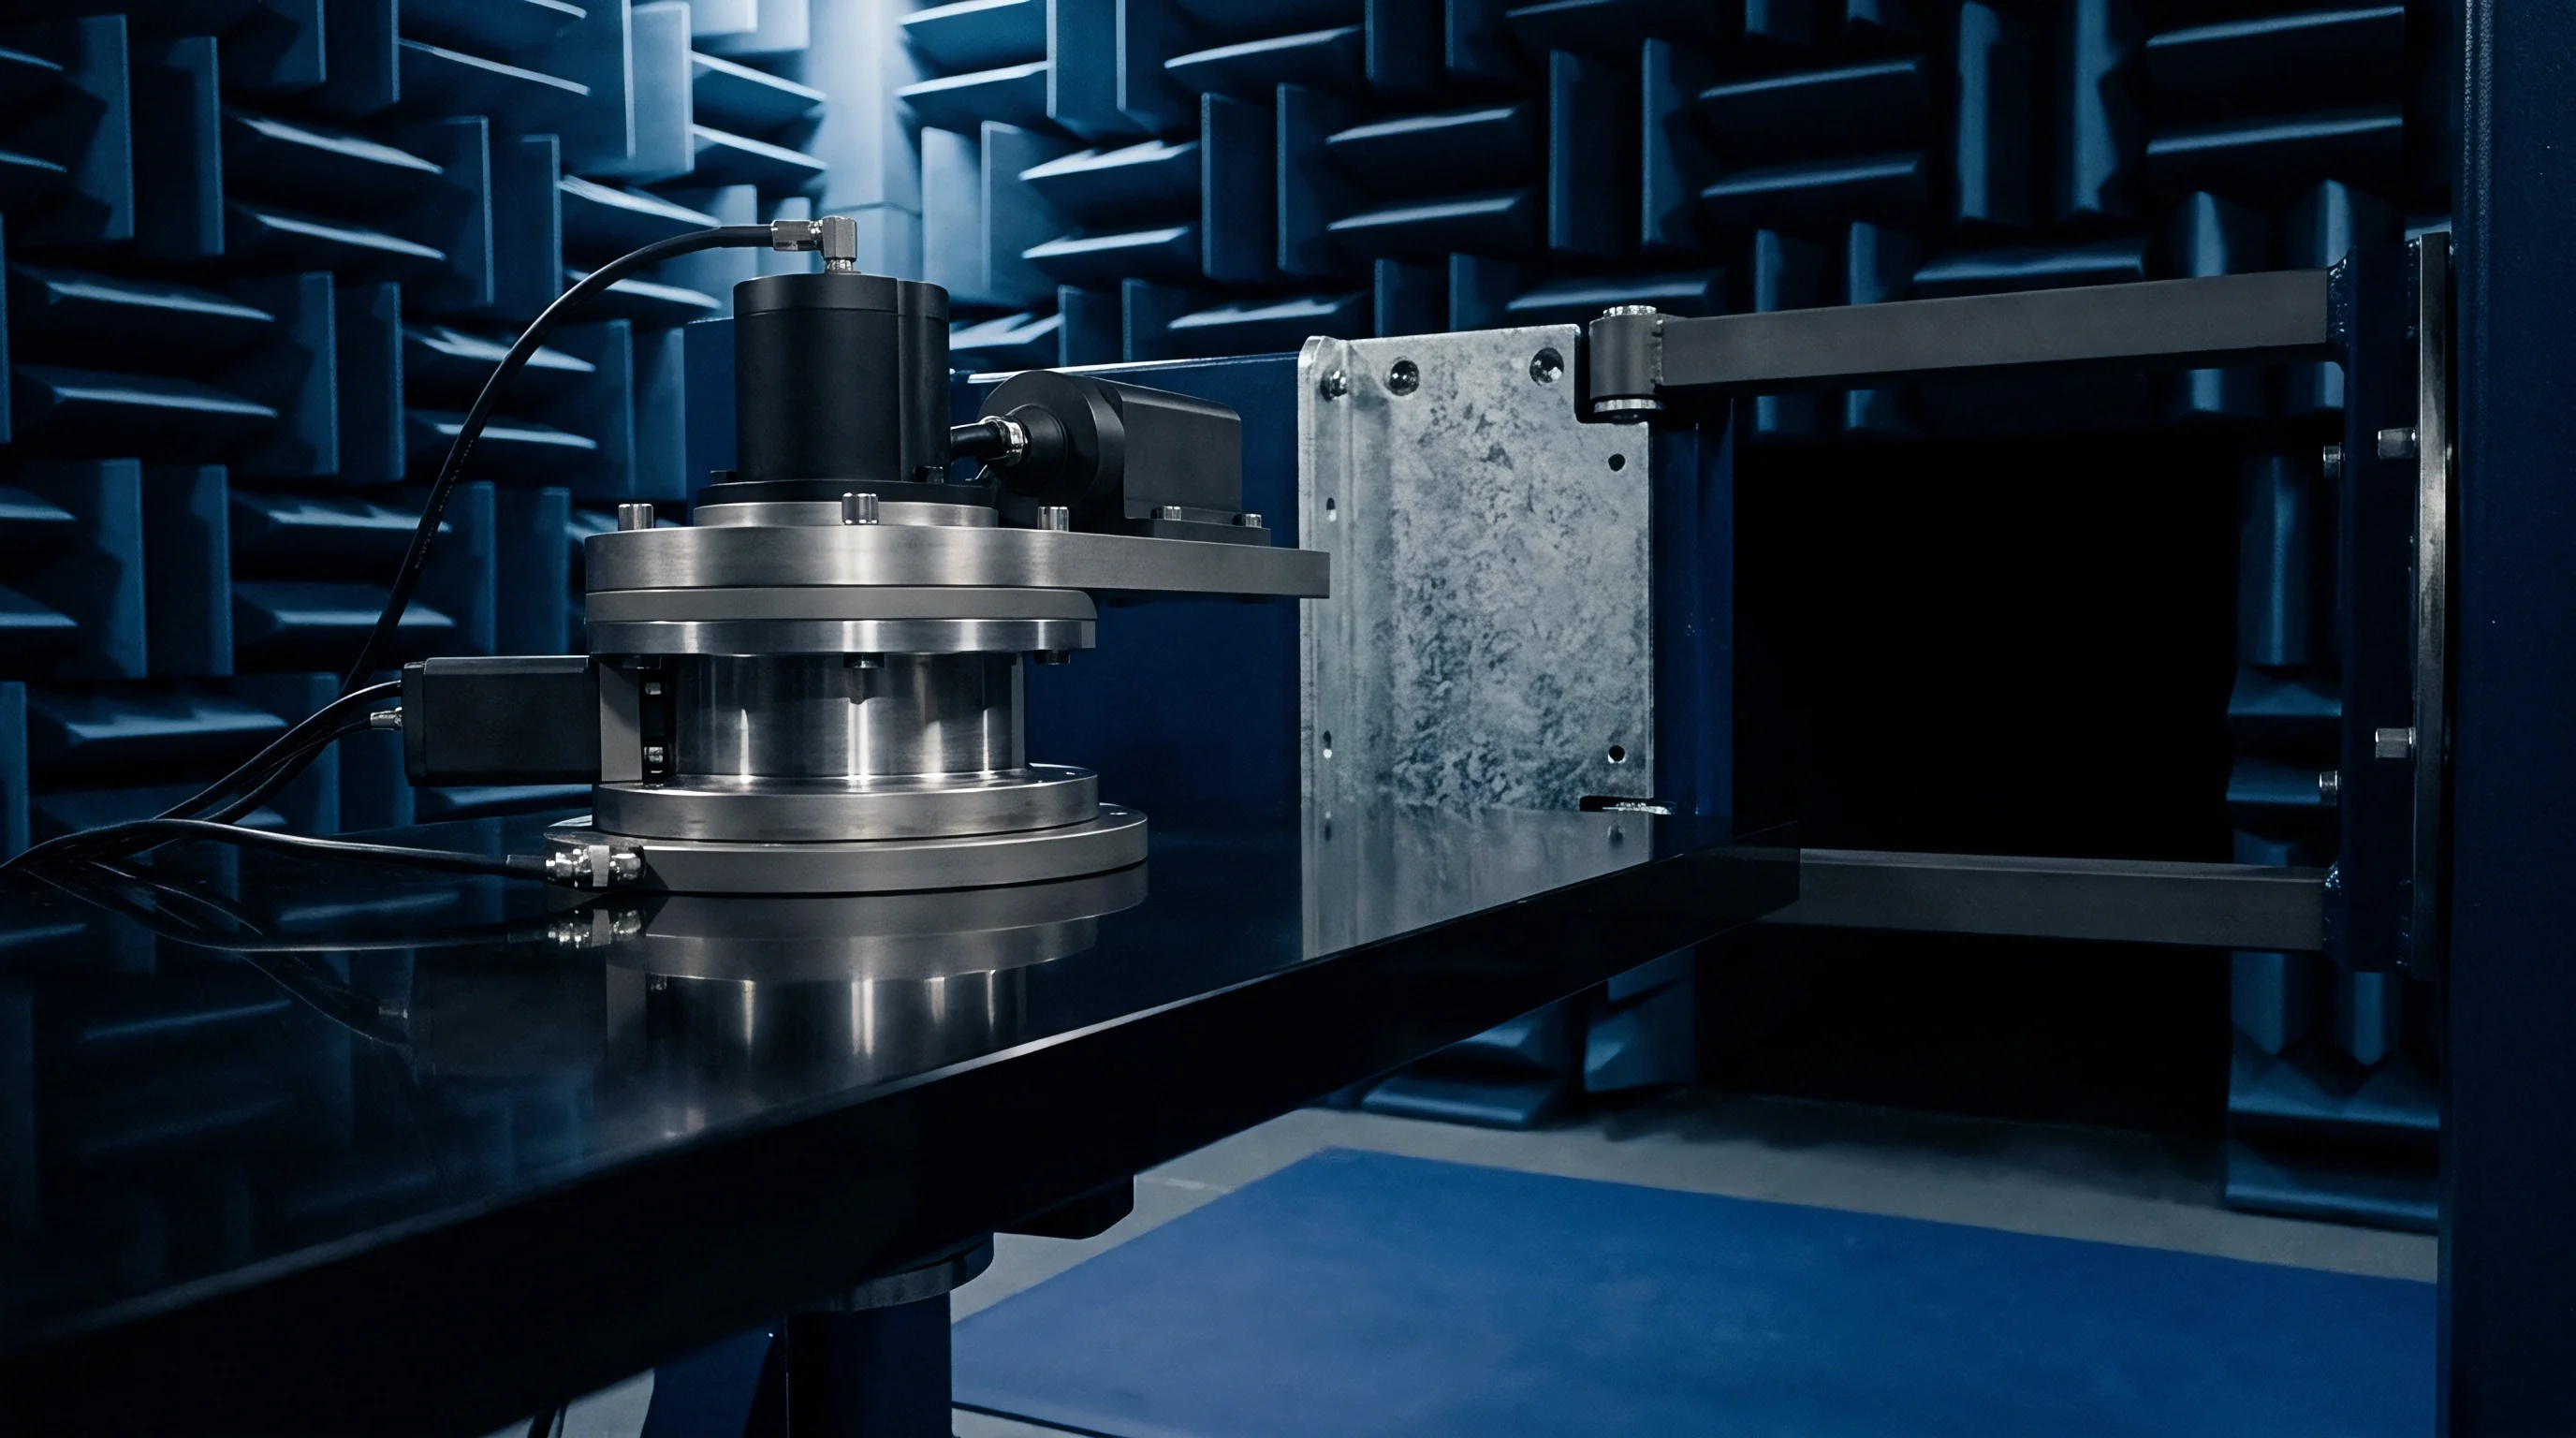
What Signal Conditions Trigger Severe Non-Linear Rectification?
High-frequency spectral content overlapping the structural resonance of the MEMS proof mass induces output distortion orders of magnitude above baseline specifications. Even low-amplitude continuous vibration matching the mechanical natural frequency fn forces high internal displacement amplitudes within the silicon structure. Operating near mechanical resonance drives proof mass comb fingers near their physical limits, maximizing squeeze-film damping asymmetry and non-linear spring stretching.
Excitation frequencies matching sub-harmonics of internal structural resonances can also trigger parametric resonance modes, causing unexpected non-linear amplification.
Broadband random vibration profiles featuring high peak-to-rms crest factors present severe operational challenges. Large peak accelerations momentarily drive the proof mass into extreme non-linear regimes or mechanical saturation stops, generating disproportionately high rectification spikes. Continuous random exposure causes integrated baseline shift as these intermittent non-linear events accumulate over time.
Operating accelerometers near their absolute full-scale measurement boundary compounds non-linear behavior, as electrostatic forces become extremely asymmetric near physical displacement limits.
Vibration rectification bias converts out-of-band oscillatory motion directly into an unrecoverable DC bias shift before any digital filter can process the sensor signal.
Characterizing the full non-linear tensor requires systematic multi-axis extraction protocols. Testing follows a controlled multi-step sequence designed to decouple primary k2 terms from cross-axis interaction coefficients kxy.
- Align the sensor primary axis parallel to the shaker motion vector inside a temperature-controlled environment to eliminate thermal drift interference.
- Record static DC output baseline Vstatic over a 60-second baseline window with zero shaker excitation applied.
- Apply single-frequency sinusoidal excitation at frequency f1 = 100 Hz with acceleration amplitude A1 = 2.0 g peak, allowing output to settle before logging 30 seconds of filtered DC data.
- Increase acceleration amplitude in step increments up to full scale, recording output shift Δ V = Vvibe – Vstatic at each acceleration level.
- Fit a second-order polynomial curve to the output shift dataset plotted against input acceleration squared A2 to derive the primary axis coefficient k2 = 2 · Δ V / (S · A2).
- Repeat the frequency sweep across discrete spectral bands up to 5000 Hz to generate a full frequency-dependent k2(f) transfer function.
- Rotate the sensor mounting fixture by exactly 90 degrees to align orthogonal physical axes with the shaker motion vector, measuring cross-axis rectification terms kxy and kxz.

Worked Example of Coefficient Derivation and Bias Estimation
Consider a dynamic orientation tracking application using a triaxial capacitive MEMS accelerometer with a nominal scale factor S = 1.000 V/g. The system undergoes operational qualification on an industrial shaker rig. Evaluating the X-axis sensor response under sinusoidal excitation at f = 400 Hz provides a clear example.
Static output baseline prior to test yields Vstatic = 0.000 V. Excitation applies a controlled acceleration amplitude A = 10.0 g peak along the X-axis. Observed average voltage output during continuous vibration shifts to Vvibe = 0.00075 V.
Subtracting baseline voltage isolates the rectified offset: Δ V = 0.00075 V – 0.00000 V = 0.00075 V. Converting voltage shift to acceleration bias yields Δ BDC = Δ V / S = 0.00075 g = 750 μg. Substituting input acceleration magnitude A = 10.0 g into the second-order rectification equation Δ BDC = 0.5 · k2 · A2 permits solving directly for the quadratic coefficient k2:
750 μg = 0.5 · k2 · (10.0 g)2 = 0.5 · k2 · 100 g2
k2 = frac750 μg50 g2 = 15 μg/g2
This discrepancy traces directly to squeeze-film damping non-linearities across the comb fingers. Evaluating the performance of this sensor when exposed to an operational vibration environment specified at 15.0 g RMS broadband random acceleration spanning 20 Hz to 2000 Hz illustrates the overall impact. Assuming uniform spectral density distribution without narrow-band mechanical amplification, the total integrated square acceleration input equals Arms2 = (15.0 g)2 = 225 g2.
The estimated zero-frequency rectified DC offset across the operational band yields:
Δ BDC,random = k2 · Arms2 = 15 μg/g2 · 225 g2 = 3375 μg = 3.375 mg
This 3.375 mg false acceleration vector acts directly on gravity calculations. Assuming the sensor sits horizontal in nominal position with the Z-axis aligned with vertical gravity (1.0 g), a false 3.375 mg bias along the horizontal X-axis induces an artificial pitch offset calculation:
thηerror = arcsinleft(frac3.375 mg1000 mgright) ≈ 0.193circ
A static tilt angle error of 0.193circ translates directly into systematic navigation location drift over uncorrected time horizons. Adding simultaneous Y-axis vibration introduces cross-coupling kxy = 4 μg/g2 with a relative phase angle φ = π/4, contributing an additional bias increment:
Δ Bcross = kxy · Ax Ay cos(φ) = 4 μg/g2 · 10 g · 10 g · cos(π/4) = 400 · 0.707 μg = 282.8 μg
The total accumulated rectified bias reaches 3.658 mg, driving the pitch orientation tracking error to 0.210circ. High-accuracy applications require systematic compensation protocols or mechanical isolation measures to mitigate this error magnitude.
Empirical shaker testing across full operating temperature ranges confirms that vibration rectification coefficients increase at high ambient temperatures due to air viscosity reduction inside the MEMS cavity.


Filtering
Analog signal conditioning before the analog-to-digital converter determines whether high-frequency kinetic energy reaches the non-linear element intact. Once mechanical or electrical rectification occurs inside the physical element, the non-linear transformation creates an artificial zero-frequency DC component. Digital anti-aliasing filters, finite impulse response low-pass filters, and Kalman filter smoothing algorithms operate entirely in the digital domain downstream of the pickoff interface.
A low-pass digital filter set to a tight 5 Hz cutoff bandwidth strips away oscillatory AC noise, but passes the rectified zero-frequency DC bias shift unattenuated. Digital signal processing cannot distinguish between a real gravitational tilt change and an artificial DC offset generated by high-frequency vibration rectification.
Preventing vibration rectification bias mandates stopping high-frequency kinetic energy before it forces the mechanical proof mass into non-linear displacement limits. Analog anti-aliasing filters situated downstream of an un-shielded, high- Q mechanical element fail because rectification takes place inside the silicon mechanical domain prior to capacitive voltage transduction. Electrical filtering situated in the signal chain protects the analog-to-digital converter from voltage clipping and high-frequency aliasing, but offers zero attenuation against mechanical non-linear bias shifts already generated within the micromechanical cavity.
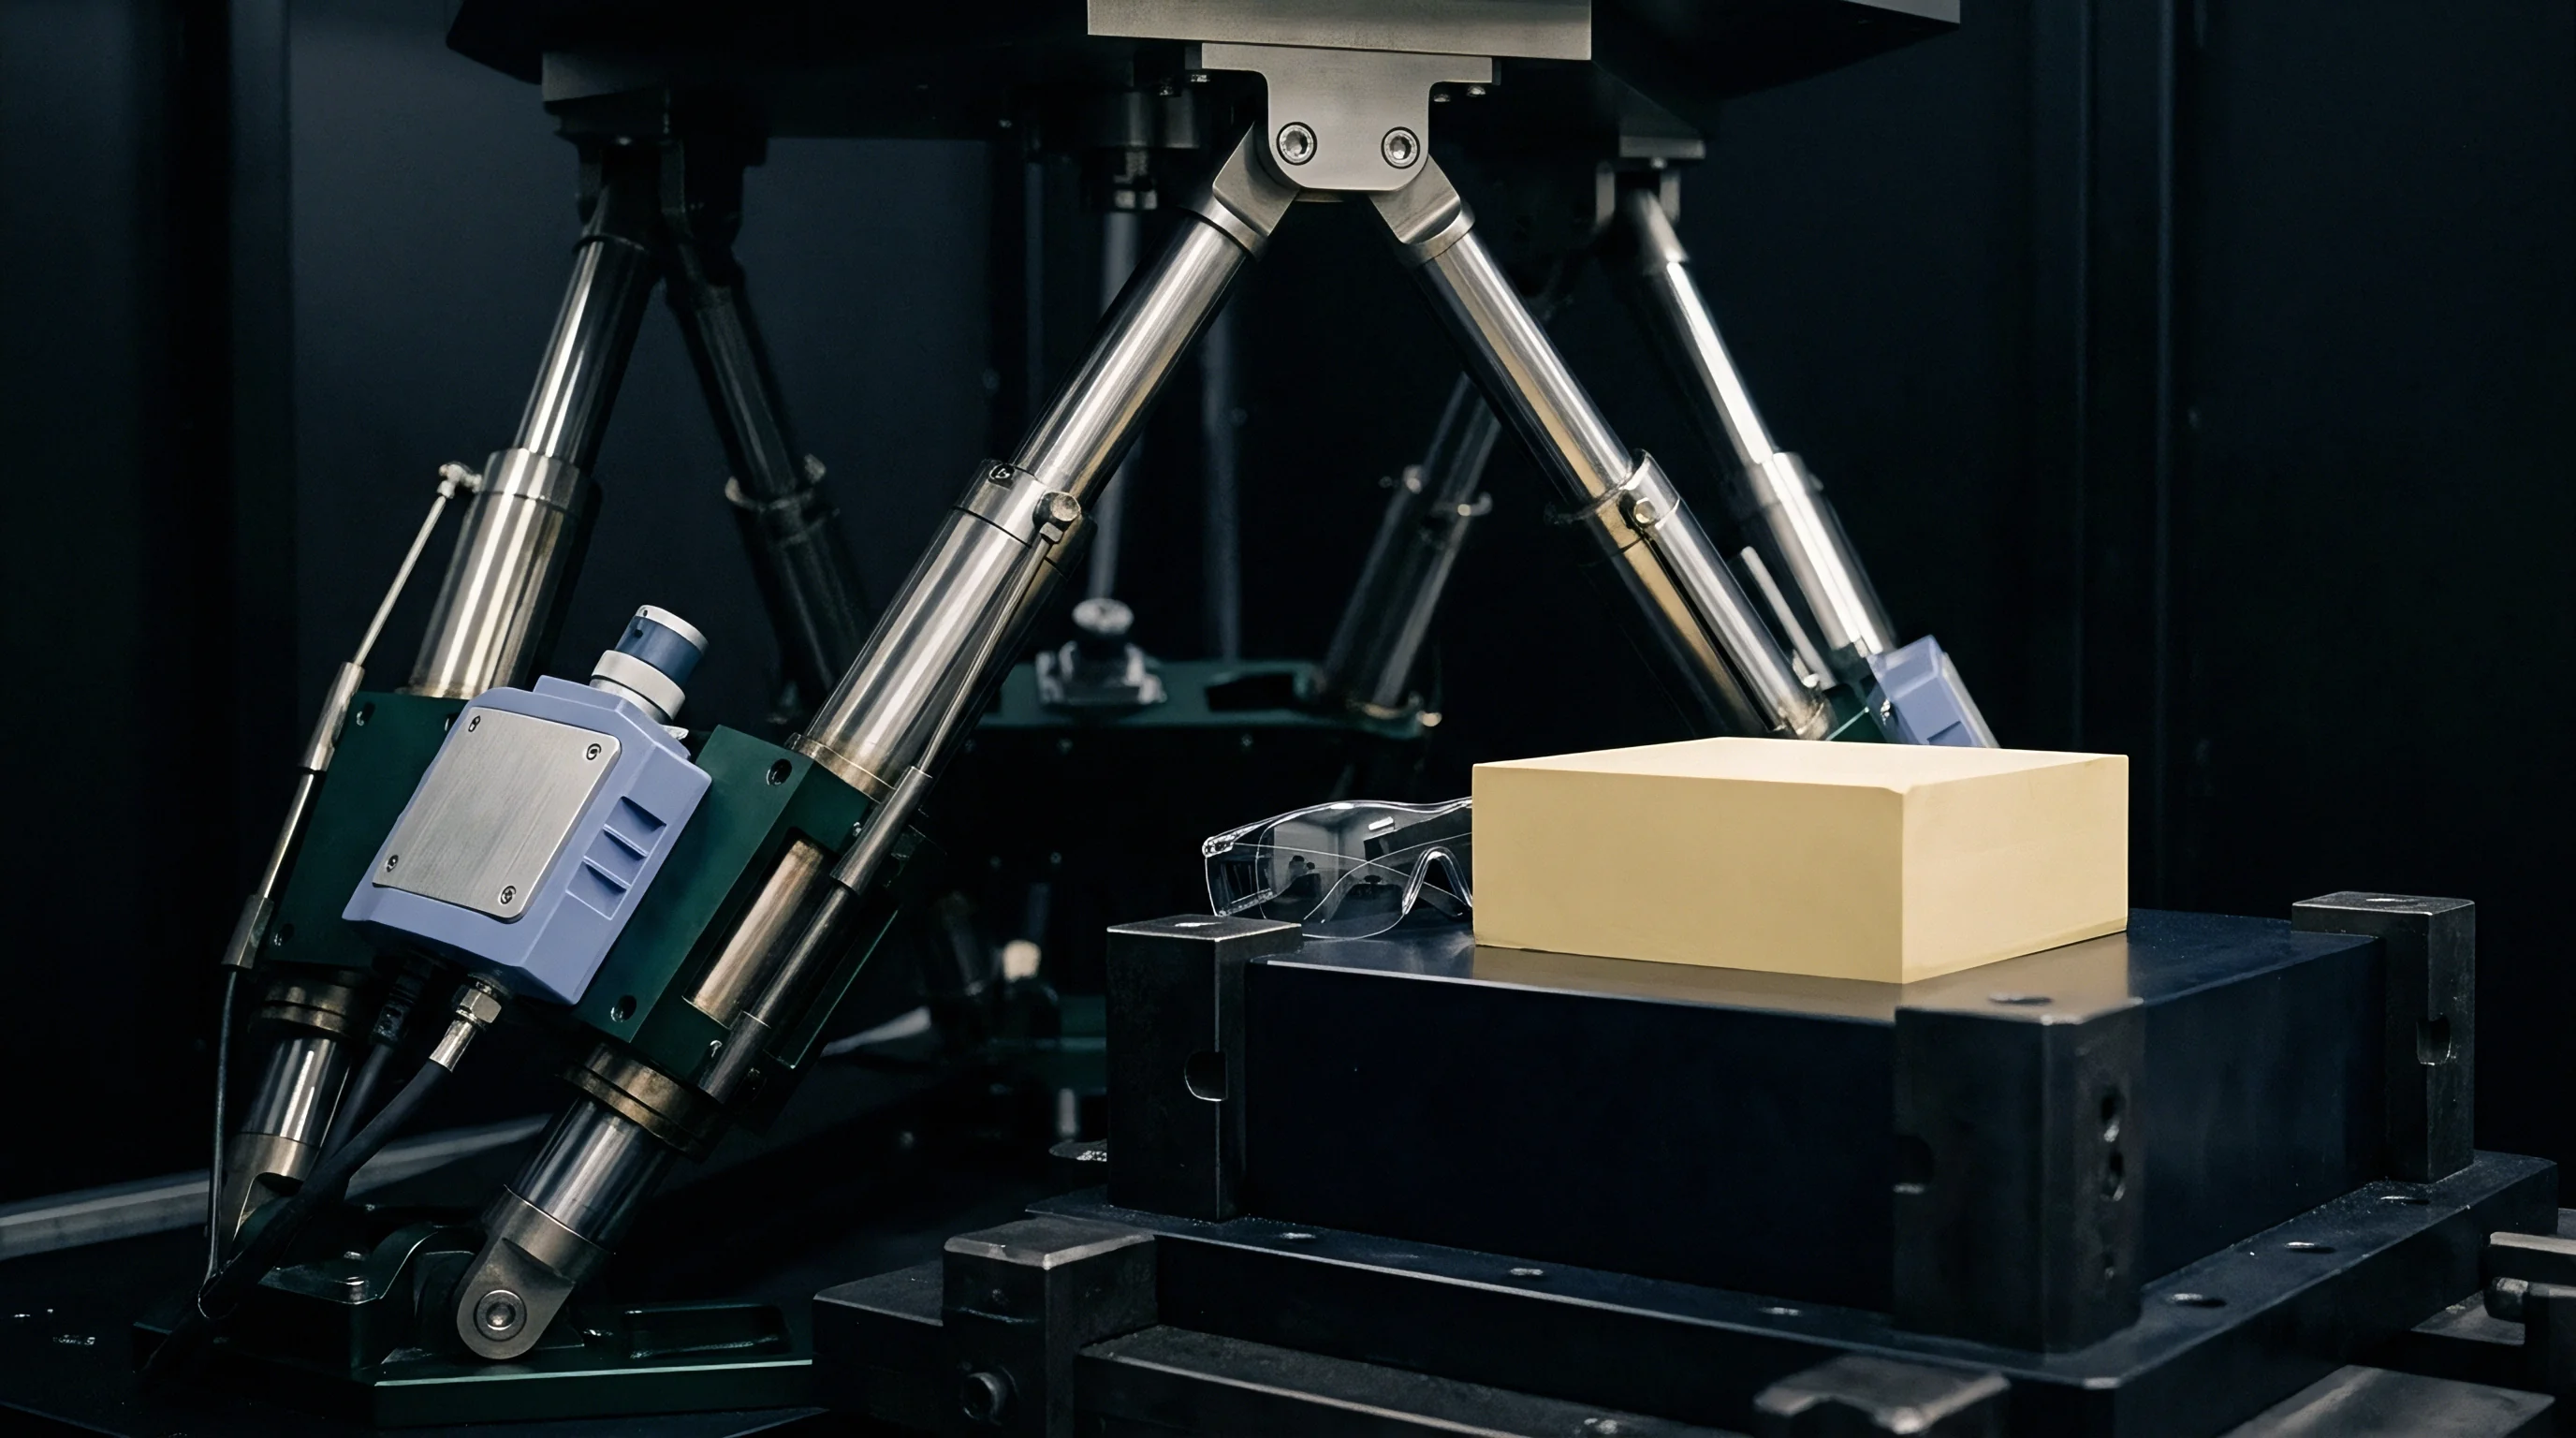
Mechanical Isolation and Passive Damping Interfaces
Mechanical low-pass filtering provides the primary physical defense against vibration rectification bias. Interposing elastomer isolation mounts, silicone gel dampeners, or custom spring-damper assemblies between the vibrating platform chassis and the sensor printed circuit board attenuates high-frequency acceleration before kinetic forces reach the silicon die. A second-order mechanical isolation system acts as a mechanical low-pass filter characterized by natural frequency fn and damping ratio ζ.
Acceleration transmission Ta(f) follows the mechanical transfer function:
Ta(f) = sqrtfrac1 + left(2ζ fracffnright)2left(1 – left(fracffnright)2right)2 + left(2ζ fracffnright)2
Designing isolation systems with natural frequencies well below operational vibration spectrums attenuates high-frequency vibration by -40 dB/decade above resonance. Attenuating input vibration amplitude A by a factor of 10 reduces second-order rectified DC bias 0.5 · k2 · A2 by a factor of 100. Effective isolation design requires maintaining uniform damping across ambient operating temperature boundaries, as elastomer stiffness increases significantly at low temperatures, shifting fn higher and degrading isolation performance.
Vibration rectification bias converts out-of-band oscillatory motion directly into an unrecoverable DC bias shift before any digital filter can process the sensor signal.
High-bandwidth, high-sampling-rate signal chains mitigate electrical clipping and differential pickoff demodulation. Utilizing oversampling delta-sigma analog-to-digital converters running at megahertz sampling frequencies prevents high-frequency capacitive voltage harmonics from aliasing into the passband. Combining oversampled conversion with high differential amplifier headroom ensures that transient high-g peaks pass through processing stages without causing electrical saturation.
| Signal Chain Strategy | Analog Bandwidth | ADC Sample Rate | Mechanical Isolation | Residual VRE Floor |
|---|---|---|---|---|
| 1000 Hz | 2 kHz Standard ADC | None (Rigid Mount) | 3.50 mg to 12.0 mg | |
| 100 Hz | 2 kHz Standard ADC | None (Rigid Mount) | 3.20 mg to 11.5 mg | |
| 5000 Hz | 100 kHz Delta-Sigma | None (Rigid Mount) | 1.10 mg to 4.5 mg | |
| 1000 Hz | 2 kHz Standard ADC | 150 Hz Elastomer Pad | 0.12 mg to 0.45 mg | |
| 5000 Hz | 100 kHz Delta-Sigma | 40 Hz Gel Suspension | 0.01 mg to 0.05 mg |
Combining tuned mechanical gel suspension with high-frequency oversampled delta-sigma conversion lowers residual vibration rectification bias below the noise floor of standard MEMS tactical grade units.

Firmware Estimation and Real Time Bias Correction Strategies
When physical space limitations forbid installing bulky mechanical damping isolators, real-time algorithmic software compensation strategies offer an alternate mitigation pathway. Algorithmic correction relies on continuous measurement of high-frequency vibration energy using supplementary wide-bandwidth ac-coupled auxiliary accelerometers or high-rate primary sensor channels. Computing real-time mean square acceleration values Arms2(t) over sliding temporal windows provides the mathematical input needed for instantaneous bias prediction formulas.
The onboard processor applies pre-calibrated frequency-dependent k2(f) lookup tables or polynomial state models to calculate predicted rectified bias Δ hatBDC(t) = k2 · Arms2(t). Subtracting this predicted bias estimate from primary acceleration channels prior to gravity vector orientation calculations removes predictable rectification components. Effectiveness depends heavily on calibration stability across manufacturing lots, as un-calibrated sensor-to-sensor k2 variations exceed 50 percent, causing generalized lookup tables to under-compensate or over-compensate individual units.
Internal ASIC low-pass filters do not eliminate all vibration sensitivity, because mechanical displacement non-linearities generate DC offsets before signals ever reach the ASIC interface.


Validation
Quantifying sensor resilience against operational vibration relies on multi-axis electrodynamic shakers operating inside climate-controlled chambers. Validation screening ensures that dynamic gravity vector tracking accuracy meets system requirements across full thermal and mechanical shock environments. Standard laboratory testing protocols relying solely on un-vibrated static multi-position tumbles fail to qualify sensors intended for dynamic airframe, marine, or industrial applications.
Complete validation dossiers must demonstrate stable bias performance under simultaneous application of multi-axis random vibration, continuous thermal cycling, and supply voltage variation.
Environmental test profiles draw specifications from international standards such as MIL-STD-810H Method 514.8 (Vibration) and RTCA DO-160G Section 8. Test execution mounts the complete inertial measurement assembly onto a rigid magnesium vibration fixture, securing the test payload to the shaker table slip plate. Laser Doppler vibrometers monitor fixture rigidity, verifying that the test jig introduces no unwanted structural resonances or flexing modes across the test frequency spectrum.

Qualification Protocols and Automated Bench Procedures
Automated validation protocols automate sweep sequences across single-axis and multi-axis excitation vectors while recording raw sensor output streams. Testing begins with a full static tumble calibration to establish baseline linear scale factors, cross-axis alignment matrices, and zero-g bias parameters at ambient temperature. Following baseline calibration, the shaker platform initiates a continuous sine sweep from 20 Hz to 5000 Hz at a controlled constant acceleration amplitude, typically 2.0 g peak, to map internal mechanical resonances.
Real-time data acquisition hardware captures accelerometer readings alongside reference accelerometer spectrums. High-speed digital processors compute sliding time-averaged mean outputs over discrete 10-second spectral steps, stripping residual AC vibration oscillations to isolate true zero-frequency DC output shifts. Plotted output shifts reveal specific frequency bands where mechanical amplification exacerbates non-linear rectification terms.
Standard qualification procedures require documented evidence confirming that vibration rectification coefficients remain bounded across the operational life of the device.
Sensor qualification dossiers across tier-one suppliers rarely include measured k2 spectrums. A complete verification dossier must contain explicit environmental and mechanical data parameters to support dynamic deployment.
- Frequency Dependent Rectification Spectrums defining k2(f) values from 20 Hz to 5000 Hz taken at discrete 50 Hz increments under controlled sinusoidal excitation.
- Broadband Random Vibration Response Curves documenting integrated DC bias shifts under standard random vibration spectrums across operational temperature extremes.
- Cross-Axis Coupling Matrices detailing measured kxy, kxz, and kyz cross-rectification coefficients taken under phase-correlated dual-axis vibration testing.
- Mechanical Shock Drift Tolerances quantifying zero-g baseline offset retention before and after 500 g mechanical shock pulse exposure.
- Thermal Sensitivity Maps showing k2 coefficient temperature drift coefficients across -40circC to +85circC operating ranges.
Sourcing teams utilize these verified performance dossiers to establish incoming inspection acceptance limits and reject wafer batches exhibiting elevated mechanical non-linearity levels.
Environmental and Temperature Combined Stress Profiling
Thermal variations alter silicon mechanical properties, air viscosity inside MEMS cavities, and packaging stress profiles. Air viscosity decreases as ambient temperature rises, reducing squeeze-film damping coefficients and increasing mechanical quality factors Q. Elevated Q factors amplify proof mass displacement under high-frequency vibration, driving silicon flexures deeper into non-linear stress regimes. Testing vibration rectification bias strictly at room temperature underestimates operational bias shifts experienced at elevated working temperatures.
Combined stress screening places the electrodynamic shaker head inside a environmental chamber, subjecting the device under test to simultaneous vibration exposure and thermal ramping. Thermal profiles cycle ambient chamber temperatures between -40circC and +85circC at constant ramp rates of 3circC/miνte while applying continuous random vibration. Thermal expansion mismatches between the silicon die, adhesive mount, and ceramic package generate mechanical strain across sensor flexure anchors, shifting baseline non-linear coefficients dynamically during temperature transitions.
Verification standard ISO 16063-16 specifies methods for dynamic calibration of acceleration transducers under combined thermal and mechanical excitation, requiring explicit reporting of secondary transverse sensitivity and non-linear distortion limits.

Sourcing
Commercial spec sheets frequently list single-axis acceleration range and bias stability while masking second-order vibration sensitivity parameters entirely. Wafer fabrication vendors and module integrators market high-resolution low-noise performance measured exclusively under static lab bench conditions. High static performance metrics regularly mask severe vibration rectification vulnerabilities caused by ultra-compliant low-stiffness silicon flexure designs.
System buyers selecting accelerometers based on static noise spectral density often experience unacceptable dynamic performance once units encounter real-world structural vibration.
Evaluating competing physical transduction principles establishes the fundamental limits of vibration rectification susceptibility prior to selecting specific part numbers. Capacitive Silicon MEMS, Piezoresistive Silicon MEMS, and Servo-Mechanical Quartz Flexure technologies offer fundamentally distinct trade-offs across cost, power consumption, static accuracy, and vibration rectification resistance.

Transduction Modality Trade off Analysis
Capacitive Silicon MEMS sensors dominate high-volume industrial and automotive applications due to minimal unit cost and micro-ampere power consumption. Their small physical mass and narrow capacitive air gaps render them highly sensitive to squeeze-film damping non-linearities and electrostatic attractive forces. Piezoresistive MEMS devices utilize stiff silicon strain gauges mounted on heavy proof masses.
High mechanical stiffness elevates structural natural frequencies far above operational vibration bands, reducing physical displacement and lowering k2 coefficients by an order of magnitude. Higher operating power requirements and thermal bias drift represent the operational trade-offs of piezoresistive units.
Quartz Servo Flexure accelerometers utilize an active electromagnetic closed-loop torque balance system. Physical acceleration deflects a quartz flexure, altering pickoff optical or capacitive output. A servo amplifier drives current through a torque coil to restore the proof mass to zero displacement.
Maintaining zero physical proof mass displacement eliminates squeeze-film asymmetries and spring flexure non-linearities, yielding k2 parameters below 1.0 , μ g/g2. High manufacturing costs and single-source supplier bases restrict quartz flexure devices to defense, aerospace, and high-value energy exploration systems.
| Transduction Principle | Typical k2 Range (ug/g2) | Power Budget | Landed Unit Cost (USD) | Supplier Concentration |
|---|---|---|---|---|
| 10.0 to 50.0 | 0.5 mW to 5 mW | $2.50 to $15.00 | High (Multiple Wafer Fabs) | |
| 2.0 to 10.0 | 10 mW to 50 mW | $80.00 to $350.00 | Moderate (Tier 1 Foundries) | |
| 0.5 to 3.0 | 50 mW to 200 mW | $120.00 to $450.00 | Moderate (Specialty Fabs) | |
| 0.05 to 0.8 | 200 mW to 1000 mW | $120.00 to $4500.00 | Low (Sole-Source Risks) |
Commercial contract negotiations should mandate explicit k2 maximum limits and require screening documentation for critical orientation sensing components.

Supply Chain Risk and Alternate Sourcing Qualification Costs
Relying on custom-screened capacitive MEMS units to meet tight vibration rectification specifications introduces severe supply chain exposure. Wafer-level fabrication variations generate significant yield spreads in second-order non-linear coefficients across die lots. Etching depth variations of less than 100 nanometers across capacitive comb fingers alter squeeze-film gaps sufficiently to double k2 values on outer wafer margins.
When suppliers reject non-conforming wafers to maintain tight k2 distributions, delivered unit costs escalate, and delivery lead times expand during high-demand allocation cycles.
Qualifying secondary replacement sources for high-performance accelerometers requires extensive mechanical and thermal validation testing. Cross-qualifying an alternate component vendor demands re-running full multi-axis shaker sweeps, thermal cycling qualification, and Kalman filter tuning verification. Engineering time, chamber usage costs, and production re-qualification runs routinely represent substantial capital expenditures when swapping sensor suppliers during mid-program redesigns.
Sourcing teams must demand primary-source suppliers provide certified batch-level k2 screening reports prior to signing volume delivery agreements.
Procurement agreements specifying bare wafer delivery must incorporate explicit structural geometry tolerances, establishing clear quality boundaries before packaging assembly operations begin.