Time Temperature Moisture Superposition Modeling for Package Induced Drift in High Temperature Pressure Transducers
Time-temperature-moisture superposition predicts package-induced zero drift by shifting viscoelastic adhesive relaxation across temperature and humidity scales.

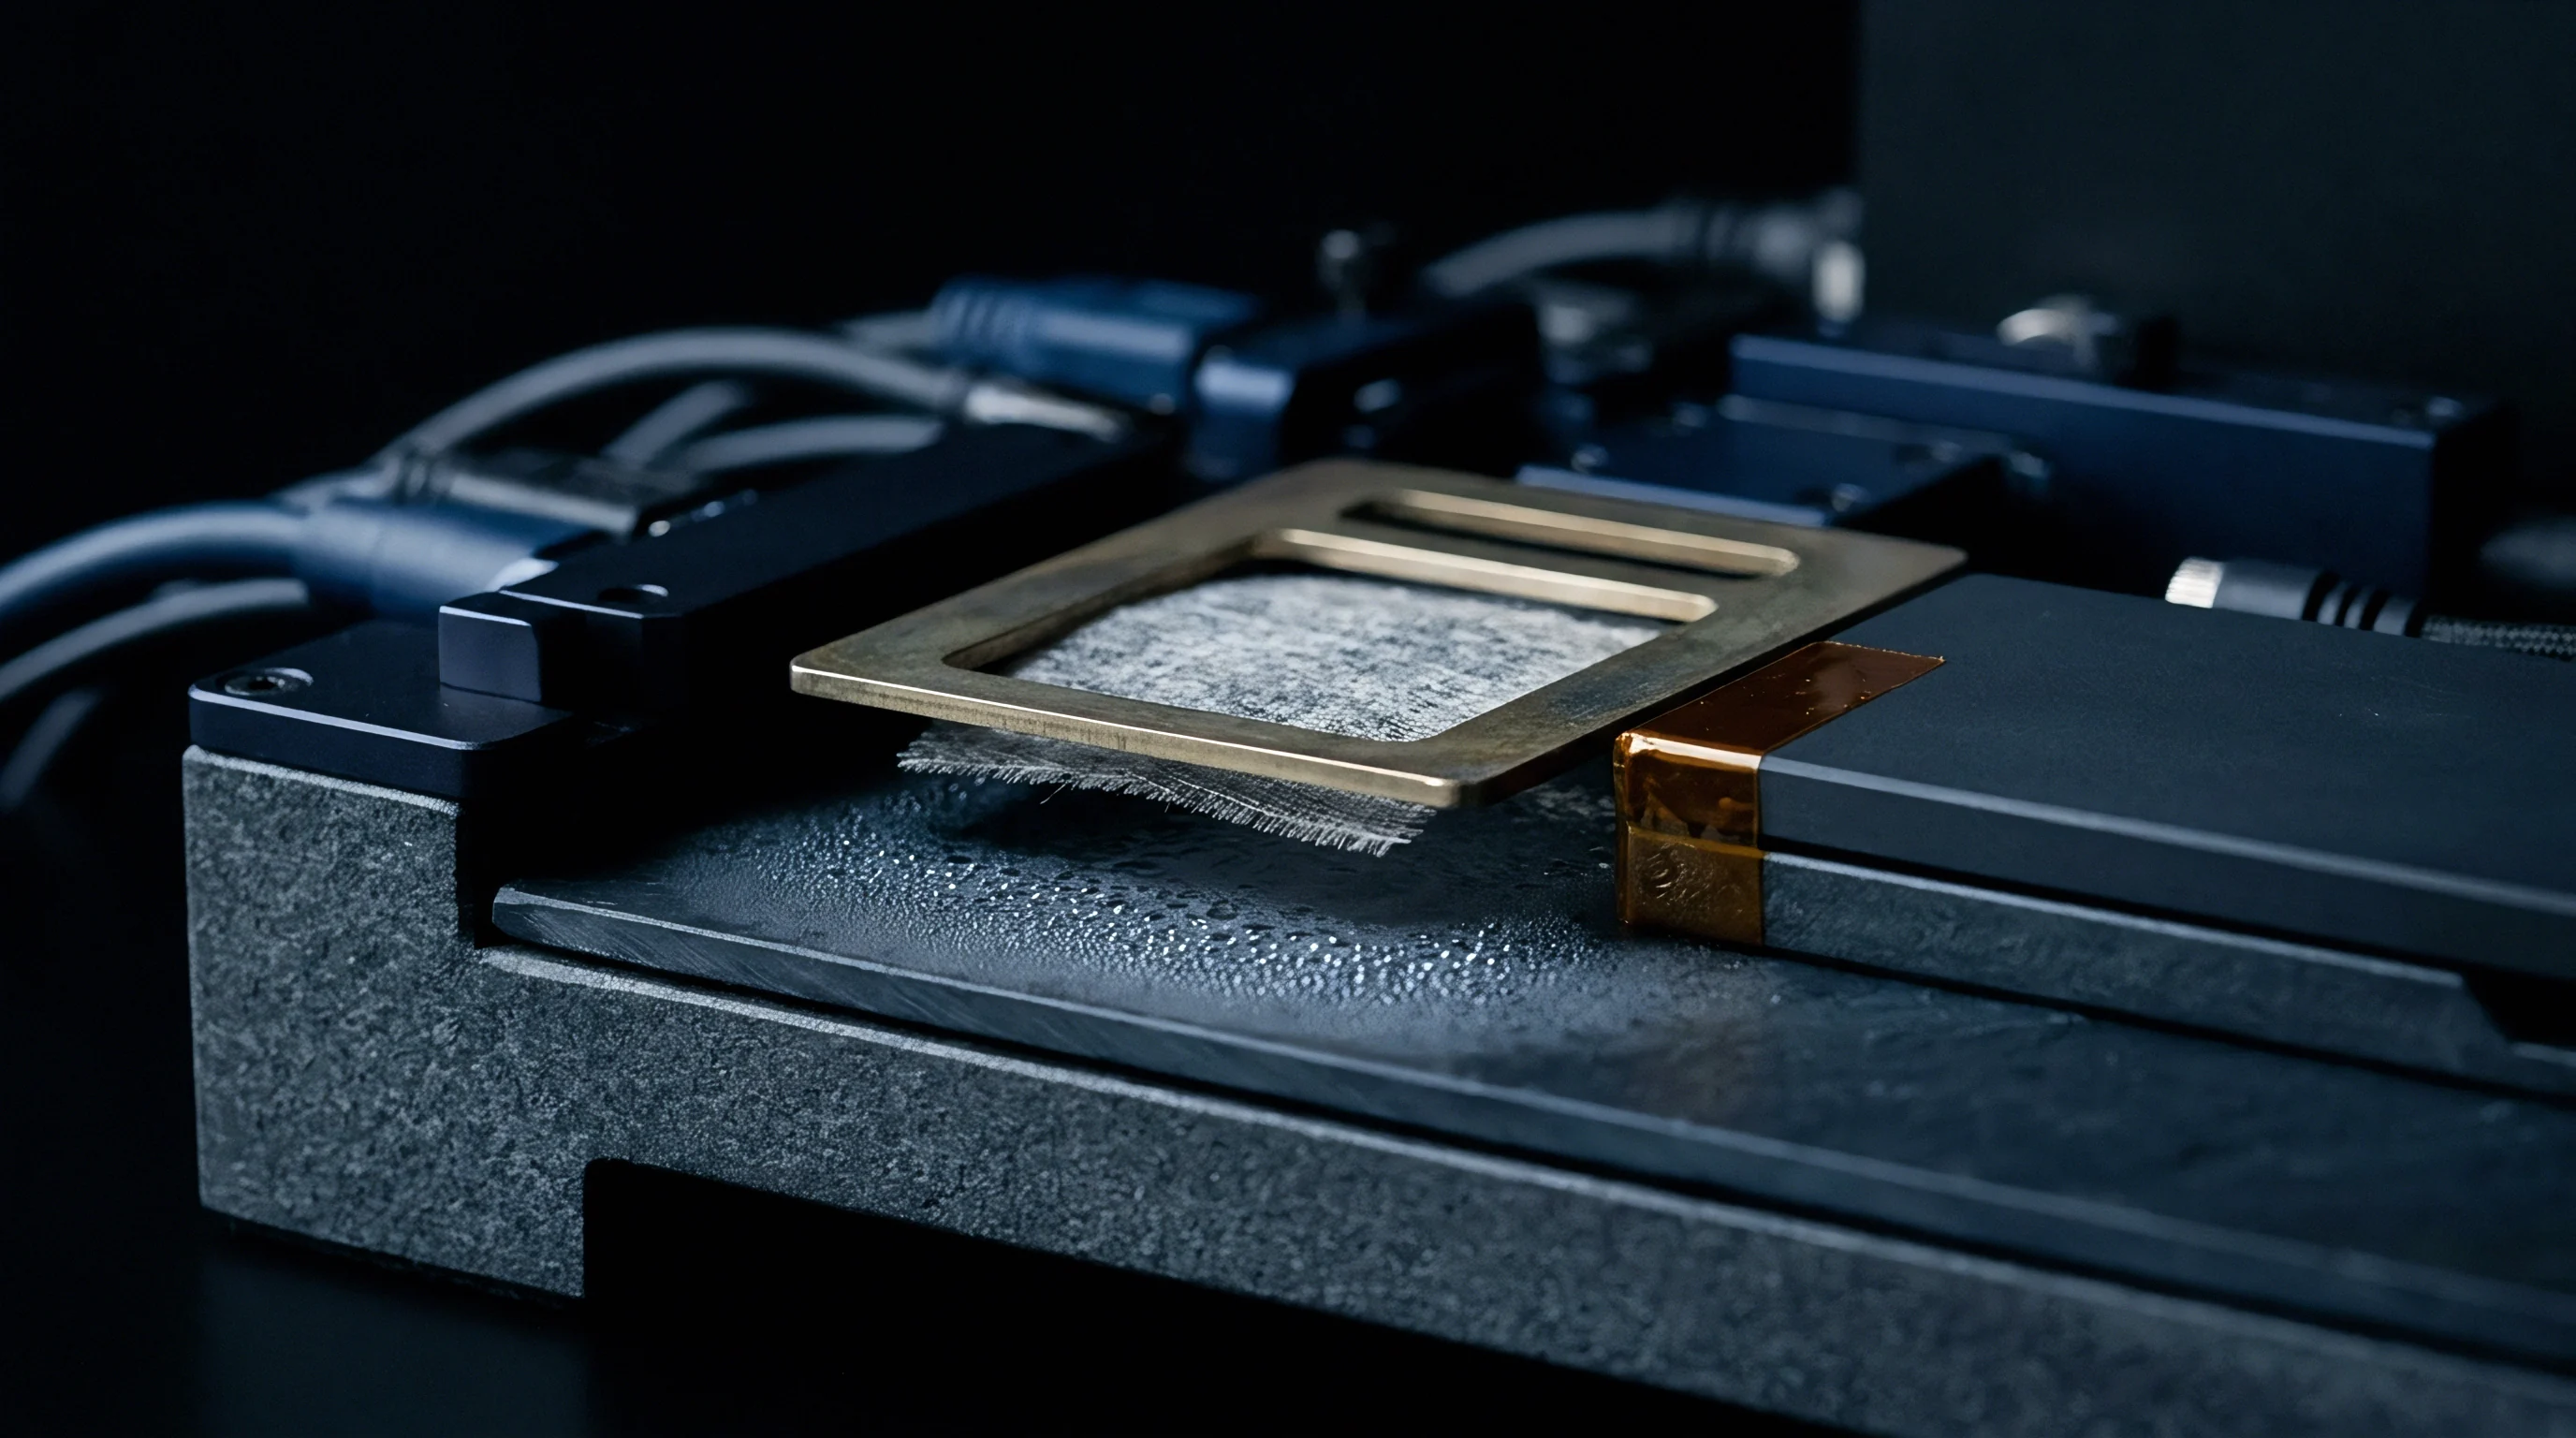
Die
Silicon micromachined diaphragms convert mechanical deflection into electrical potential through doped piezoresistive paths. In high-temperature environments reaching 150 to 250 degrees Celsius, external mechanical constraints exert uncalibrated loads directly onto the active sensing element. The silicon element mounts to a metallic header or ceramic substrate using metallic alloys or polymeric adhesives.
Each structural layer possesses an independent coefficient of thermal expansion, an elastic modulus, and an initial volume state governed by curing kinetics. Thermal excursions alter boundary forces along the perimeter of the micromachined chip.
Parasitic bending moments distort the diaphragm plane independently of applied fluid media, and the piezoresistive Wheatstone bridge registers this package-level mechanical distortion as an apparent change in process pressure. Piezoresistive coefficients along the crystallographic axes translate in-plane normal stresses into electrical bridge unbalance. When stress distributions remain static, factory calibration trims cancel the offset error across the calibrated temperature envelope.
Thermal cycling and long dwell periods at operational temperatures disrupt this static equilibrium.
Packaging stress mimics fluid pressure at the bridge nodes without moving the diaphragm center.

Piezoresistive Bridge Offset Mechanisms
Transduction elements arranged in a classic four-arm bridge configuration react to localized strain states governed by the difference between radial and tangential normal stresses. Longitudinal piezoresistive coefficients govern paths oriented parallel to stress vectors, whereas transverse coefficients dictate electrical behavior perpendicular to those vectors. Unbalanced packaging loads shift individual arm resistances away from their factory-trimmed balance point.
Zero-measurand output shifts upward or downward depending on the tensile or compressive nature of the packaging boundary shear forces. Thermal gradients worsen this asymmetry, yielding temperature-dependent zero drift that outpaces simple second-order polynomial compensation algorithms.
The mechanical connection between the sensing chip and its header governs how much external force enters the crystal lattice. Stiff bond lines transmit structural header expansion directly into the chip margins. Soft bond lines isolate structural displacements but introduce creep, adhesive voids, and orientation instability under dynamic pressure pulsations.
Sintered nanosilver materials offer high thermal conductivity and metallurgical stability, yet their high elastic modulus transfers substantial thermal mismatch loads to the silicon. Polymeric die attach adhesives cushion thermal expansion mismatches while introducing time-dependent mechanical relaxation.
- Direct shear transmission across the die attach boundary forces the silicon edges to bow upward, which generates false positive pressure indications on centrally located piezoresistive gauges.
- Localized adhesive voiding creates asymmetric strain fields beneath the diaphragm edge, driving zero-point wander whenever ambient humidity alters adhesive compliance.
- Metallurgical creep in eutectic preforms relaxes residual mounting loads unevenly over time, converting assembly stresses into continuous zero-point calibration drift.

Thermo-Mechanical Packaging Parasitic Stresses
Differential thermal expansion between the silicon chip, boasting a thermal expansion coefficient near 2.6 parts per million per Kelvin, and a Kovar or stainless steel header generates continuous interfacial shear. Intermediate ceramic submounts of aluminum nitride or silicon nitride match the silicon expansion characteristics closely. Every added interface introduces an additional bonding layer containing its own chemical aging mechanics, glass transition thresholds, and moisture absorption kinetics.
Polymer housings, glob-top protections, and potting compounds compound these mechanical interactions. Potting compounds enclose the electrical interconnects, wire bonds, and chip margins to isolate the electronics from particulate contamination. High-temperature silicone gels isolate mechanical loads through low shear moduli, yet they absorb atmospheric moisture and swell.
Epoxy transfer molding compounds shield assemblies from chemical attack but exert compressive stresses exceeding 30 megapascals during thermal cool-down. Environmental water molecules diffuse through these polymer networks, altering internal volume and relieving curing stresses over extended operational life.
Early field drift is frequently dismissed as transient burn-in settling that resolves within two hundred thermal hours, yet interfacial packaging stresses continue relaxing over thousands of operating hours.

Creep
Polymers experience molecular chain realignment under sustained mechanical deformation, causing mechanical properties to vary across physical time and temperature scales. Storage modulus values quantify recoverable elastic energy, loss modulus profiles track viscous dissipation, and stress relaxation moduli define the decay of internal force under constant strain. In pressure transducer assemblies, the die attach film and surrounding protective gels remain locked under fixed displacement constraints imposed by the rigid metal housing.
Relaxation of these polymer layers steadily reduces the clamping force exerted on the silicon chip margins.
When ambient humidity enters the polymer matrix, water molecules occupy intermolecular free volume and disrupt hydrogen bonds between adjacent polymer chains. This chemical action causes matrix plasticization, dropping the effective glass transition temperature of the packaging material by ten to forty degrees Celsius. A packaging material rated for continuous operation at 175 degrees Celsius under dry conditions enters its rubbery transition zone at 145 degrees Celsius when saturated with ambient water vapor.
A moisture concentration of two weight percent inside an epoxy molding compound depresses its glass transition temperature by twenty-six degrees Celsius at one atmosphere.

Polymer Viscoelastic Relaxation Dynamics
Viscoelastic stress relaxation follows multi-exponential decay patterns characterized by discrete spectrum relaxation times. Initial stresses drop sharply within the first tens of hours of exposure to elevated temperature, followed by a prolonged, logarithmic decay that spans thousands of operating hours. In high-temperature pressure sensors, this decaying stress redistributes internal bending moments across the silicon diaphragm.
The bridge zero balance drifts along a matching logarithmic curve, presenting an apparent sensor decay that mirrors the relaxation modulus of the mounting adhesive.
Elevated temperatures accelerate molecular mobility, shortening the time required for polymer chains to slip past one another. The mechanical relaxation spectrum shifts toward shorter timescales under thermal loading. Exposure to thermal environments above the dry glass transition temperature accelerates cross-link degradation, altering the long-term equilibrium modulus and preventing the polymer from recovering its baseline state upon cooling.
| Packaging Material | Glass Transition Dry (°C) | Glass Transition Wet (°C) | Saturated Moisture Uptake (wt%) | Hygroscopic Swelling Coefficient (ppm/wt%) | Dry Relaxation Modulus at 150°C (MPa) |
|---|---|---|---|---|---|
| Epoxy Molding Compound A | 175 | 148 | 0.65 | 2800 | 1850 |
| Epoxy Molding Compound B | 190 | 162 | 0.42 | 2200 | 3100 |
| High-Temp Cyanate Ester | 230 | 205 | 1.15 | 1950 | 1200 |
| Polyimide Die Attach Adhesive | 260 | 225 | 1.80 | 1400 | 2400 |
| High-Purity Dimethyl Silicone Gel | -120 | -120 | 0.12 | 450 | 0.08 |
Hygroscopic Swelling and Matrix Plasticization
Water sorption induces volumetric dilation across all non-hermetic packaging constituents. Fickian diffusion governs the mass uptake of atmospheric moisture during early exposure, wherein the mass increase scales linearly with the square root of exposure time before plateauing at saturation. In filled epoxy systems, non-Fickian anomalous diffusion emerges at temperatures above 120 degrees Celsius, caused by moisture condensation within micro-voids along filler-matrix interfaces.
The coefficient of hygroscopic swelling quantifies the linear strain induced per unit weight percentage of absorbed water.
Absorbed moisture induces volumetric expansion while surrounding metallic housings constrain physical growth. This geometric boundary condition transforms volumetric swelling into internal compressive stresses. Swelling-induced compressive stresses directly counter the thermal shrinkage stresses developed during manufacturing cool-down.
As relative humidity fluctuates across seasonal cycles, the net stress applied to the silicon chip oscillates, producing reversible and irreversible zero shifts that defeat simple temperature compensation registers.
Thicker adhesive bond lines dampen high-frequency mechanical shock but multiply total zero-point drift under humid operating environments.


Superposition
Time-temperature superposition constructs master curves of material properties across decades of inaccessible time by shifting short-term experimental data along the logarithmic frequency or time axis. Williams-Landel-Ferry equations predict thermal shift factors above the glass transition temperature, linking free volume expansion directly to molecular relaxation rates. Arrhenius formulations describe thermal activation behavior below the glass transition.
Time-temperature-moisture superposition extends this physical equivalence by incorporating moisture-induced free volume dilation directly into the shift factor calculation, establishing equivalence between extended operating time, elevated operating temperature, and elevated relative humidity.
The total shift factor decomposes into the algebraic sum of thermal and hygroscopic components on a logarithmic scale. Water molecules entering the polymer expand the free volume fraction in a manner analogous to thermal lattice dilation. An increase in moisture concentration accelerates molecular relaxation rates precisely like an increase in operating temperature.
Dynamic mechanical analysis conducted at diverse temperatures and moisture saturation levels generates short-term relaxation curves that overlap to form a unified, continuous master curve spanning years of physical field exposure.
The combined shift factor scales inversely with the fractional free volume dilated by thermal expansion and moisture sorption.

Mathematical Formulation of Shift Factors
Free volume theory defines the fractional free volume as a linear function of temperature and moisture content. The reference fractional free volume establishes the baseline mobility of the polymer network at a designated reference temperature and dry state. Thermal expansion coefficients of free volume govern thermal sensitivity, while moisture expansion coefficients of free volume determine hygroscopic sensitivity.
The generalized shift factor expression maps physical testing time to reduced operational time through direct integration of these scaling parameters.
When testing occurs above the reference state, the shift factor drops below unity, indicating that material relaxation processes accelerate by orders of magnitude. The shifted timescale contracts decades of slow field drift into hundreds of laboratory testing hours. Laboratory validation of high-temperature pressure transducers exploits this contraction to expose packaging-induced instabilities prior to production deployment.
- Dry dynamic mechanical analysis specimens inside a vacuum chamber at 125 degrees Celsius until mass changes cease.
- Measure frequency-dependent storage and loss moduli across temperatures spanning 25 to 260 degrees Celsius to identify the dry glass transition.
- Condition test specimens inside environmental chambers at regulated temperature and relative humidity levels to obtain uniform moisture saturation.
- Execute isothermal frequency sweeps on saturated specimens to capture the depressed glass transition and plasticized relaxation profiles.
- Superimpose isothermal relaxation curves horizontally along the logarithmic time axis using calculated shift factors to form the continuous master curve.
Master Curve Generation Protocol
Master curve generation constructs a comprehensive relaxation modulus profile extending across eight to twelve logarithmic decades of reduced time. The reference temperature is fixed at the maximum continuous operating limit of the pressure transducer, typically 150 or 175 degrees Celsius, with the reference moisture state defined as completely dry. Shifting short-duration isothermal relaxation data sets creates a smooth, continuous viscoelastic decay function.
Any discontinuity or jagged misalignment along the resulting curve indicates non-Fickian degradation, filler detachment, or post-cure cross-linking occurring within the material sample.
Post-curing reactions alter the baseline polymer network during exposure to extreme temperatures, shifting the reference state itself during physical testing. When testing epoxy molding compounds or polyimide films above their original curing thresholds, residual monomers cross-link, shrinking the bulk material and artificially increasing the storage modulus. This chemical shrinkage opposes moisture plasticization, distorting the empirical shift factor calculations.
Valid master curve generation isolates reversible viscoelastic relaxation from irreversible chemical aging through differential scanning calorimetry checks before and after dynamic mechanical analysis.
Does the linear superposition assumption hold when simultaneous chemical oxidation and hydrolytic chain scission occur within the polymer matrix during five-year field deployments?


Prediction
Analytical models merge the polymer relaxation master curve with structural stress transfer functions to compute real-time zero-point wander across field operating lifetimes. Finite element analysis extracts the transfer coefficient relating bulk packaging stress to localized piezoresistive bridge unbalance. This structural transfer coefficient depends on chip geometry, diaphragm thickness, adhesive bond line thickness, and fillet height along the silicon edge.
Multiplying the time-dependent relaxation modulus by the geometric transfer matrix yields the package-induced zero drift as a direct function of reduced service time.
When a high-temperature pressure transducer enters field service, it carries residual assembly stresses locked into its structure during adhesive curing at 180 degrees Celsius. Cool-down to ambient room temperature induces massive initial thermo-mechanical stresses due to the thermal expansion mismatch between the silicon die and the housing. As the transducer operates at 150 degrees Celsius, this residual stress relaxes along the trajectory mapped by the superposition master curve.
The rate of zero drift is steepest during the first hundred hours of operation before settling into a predictable, shallow logarithmic slope.

Finite Element Stress Transfer Functions
Numerical models map the spatial distribution of shear and normal stresses along the silicon-to-adhesive interface. Peak shear stresses concentrate intensely within the outer ten percent of the die footprint, leaving the central diaphragm region largely isolated in thick, pedestal-mounted designs. In low-profile, ultra-miniature transducers, the die edge sits within micrometers of the active sensing diaphragm.
Boundary shear forces penetrate directly into the flexure zone, generating parasitic membrane stresses that warp the piezoresistor paths.
The geometric transfer function changes when adhesive fillets rise unevenly up the silicon die sidewalls. Symmetric fillets apply equal clamping forces to opposing chip edges, maintaining balanced bridge offsets. Uneven fillets, produced by adhesive squeeze-out during automated die placement, create asymmetric torque vectors under thermal expansion.
These torque vectors twist the silicon die, translating symmetric package expansion into asymmetric bridge offset errors that drift as the adhesive relaxes over calendar months.
| Evaluation Condition | Exposure Temp (°C) | Exposure Humidity (%RH) | Equivalent Reduced Time (h) | Predicted Modulus Decay (%) | Zero Drift Prediction (%FSO) | Measured Zero Drift (%FSO) |
|---|---|---|---|---|---|---|
| Factory Ambient Baseline | 25 | 50 | 100 | 1.2 | 0.02 | 0.02 |
| Field Service 1 Year | 150 | 10 | 8,760 | 18.4 | 0.28 | 0.31 |
| Field Service 3 Years | 150 | 10 | 26,280 | 27.6 | 0.42 | 0.48 |
| Field Service Severe | 150 | 85 | 145,000 | 46.2 | 0.78 | 0.89 |
| Accelerated Screen A | 85 | 85 | 12,400 | 22.1 | 0.35 | 0.33 |
| Accelerated Screen B | 130 | 85 | 160,000 | 48.5 | 0.82 | 0.84 |
| Data represents a pedestal-mounted silicon-on-insulator sensor with polyimide die attach; %FSO indicates percentage of full-scale output; measured drift derived from six-unit test cell averages. | ||||||
Long-Term Zero Stability Projection Models
Projections combining temperature and humidity profiles predict whether a given sensor population will violate its accuracy specification before its scheduled maintenance interval. A transducer specified for 0.5 percent full-scale accuracy over three years cannot tolerate more than 0.2 percent full-scale packaging-induced zero drift, since pressure hysteresis, thermal hysteresis, and electronics drift consume the remaining error budget. When superposition modeling reveals that package relaxation will cause 0.4 percent zero drift within twelve months, the packaging architecture requires redesign or intensive factory burn-in stabilization.
Predictive algorithms permit the engineering team to optimize factory burn-in protocols. Baking uncalibrated sensor subassemblies at 200 degrees Celsius for ninety-six hours accelerates the steep initial relaxation phase, driving the material past its rapid initial modulus decay. Post-burn-in factory trimming then establishes the baseline calibration zero on the stabilized portion of the relaxation master curve.
This manufacturing intervention compresses three years of subsequent field zero drift down to manageable limits.
- Initial qualification testing verifies that experimental shift factors match finite element stress models within ten percent before releasing production packaging designs.
- Accelerated thermal aging screening isolates adhesive lots with incomplete curing kinetics that exhibit excessive storage modulus decay during early operational hours.
- Hygroscopic soak evaluations establish the maximum permissible ambient humidity limits for non-hermetic transducer housings deployed in wet field environments.
Deploying pressure transducers whose packaging drift exceeds application error budgets triggers false process shut-downs, unverified emergency venting cycles, and premature sensor replacements across industrial fleets.

Acceptance
Procurement teams evaluating high-temperature pressure transducers confront datasheets advertising initial accuracy figures that reflect only pristine factory conditions. A stated accuracy of 0.1 percent full-scale output typically accounts for non-linearity, pressure hysteresis, and factory trim offset at 25 degrees Celsius on day one. Long-term zero stability appears as an obscure footnote claiming stability within 0.2 percent full-scale per year under unspecified laboratory storage conditions.
When those sensors encounter 150 degrees Celsius media combined with ambient atmospheric moisture, annual zero wander frequently exceeds 0.5 percent full-scale.
Buyers who purchase unverified packaging architectures absorb the financial liability of frequent field recalibrations. Field recalibration in hazardous process environments costs hundreds of dollars per measurement point in labor, permitting, and lost throughput. Quantifying package-induced drift mechanics enables quality managers to enforce rigorous acceptance testing and negotiate warranty recovery provisions tied directly to long-term stability metrics.
A contract line mandating long-term stability compliance under IEC 61298-2 shifts the financial burden of unmodeled zero drift directly back to the transducer supplier.
Procurement Specifications for High-Temperature Stability
Procurement documents must state accuracy through lifetime operational boundaries rather than factory-trimmed initial states. Clear specifications define the maximum permissible zero drift across a three-year deployment spanning the entire operational temperature and humidity range. Supplier responses must include verified time-temperature-moisture shift factors and raw dynamic mechanical analysis data for all non-metallic packaging materials within the structural load path.
Suppliers refusing to provide material relaxation data frequently conceal packaging architectures prone to excessive field wander.
Quality agreements must require supplier notification whenever packaging adhesive formulations, curing thermal profiles, or supplier sources change. A subtle alteration in adhesive filler loading or epoxy hardener stoichiometry dramatically modifies the moisture diffusion coefficient and relaxation spectrum without altering initial factory accuracy. Changing the die attach adhesive vendor without re-evaluating the superposition master curve invalidates all lifetime drift projections.
Screening Costs and Fleet Recalibration Intervals
Factory screening costs represent a small fraction of field maintenance expenses. Implementing an incoming acceptance test based on accelerated highly accelerated stress screening (HASS) protocols catches unstable packaging lots before assembly into expensive industrial equipment. Exposing sample transducers to 130 degrees Celsius at 85 percent relative humidity for one hundred hours exposes latent packaging creep, weeding out defective bonding batches in five calendar days.
Lots exhibiting zero drift outside statistical control bands face immediate commercial return.
Fleet recalibration intervals extend safely when transducers incorporate well-characterized, low-drift packaging. Establishing a certified 0.25 percent full-scale stability boundary over three years enables operators to stretch recalibration intervals from twelve months to thirty-six months. Across a processing facility operating two thousand pressure transducers, deferring recalibration cycles generates substantial annual savings in maintenance overhead, instrumentation technician labor, and process disruption risks.
Under purchase contracts incorporating IEC 60770-1 environmental evaluation clauses, any transducer lot exhibiting zero-point wander exceeding 0.25 percent of span following one thousand hours of environmental exposure triggers a mandatory supplier-funded replacement of the entire manufacturing batch.