Metrological Drift in Precision Bulk Metal Foil Resistors
Bulk metal foil resistor drift stems from thermal stress relaxation and epoxy moisture swelling, manageable through hermetic packaging and thermal burn-in.

Foil
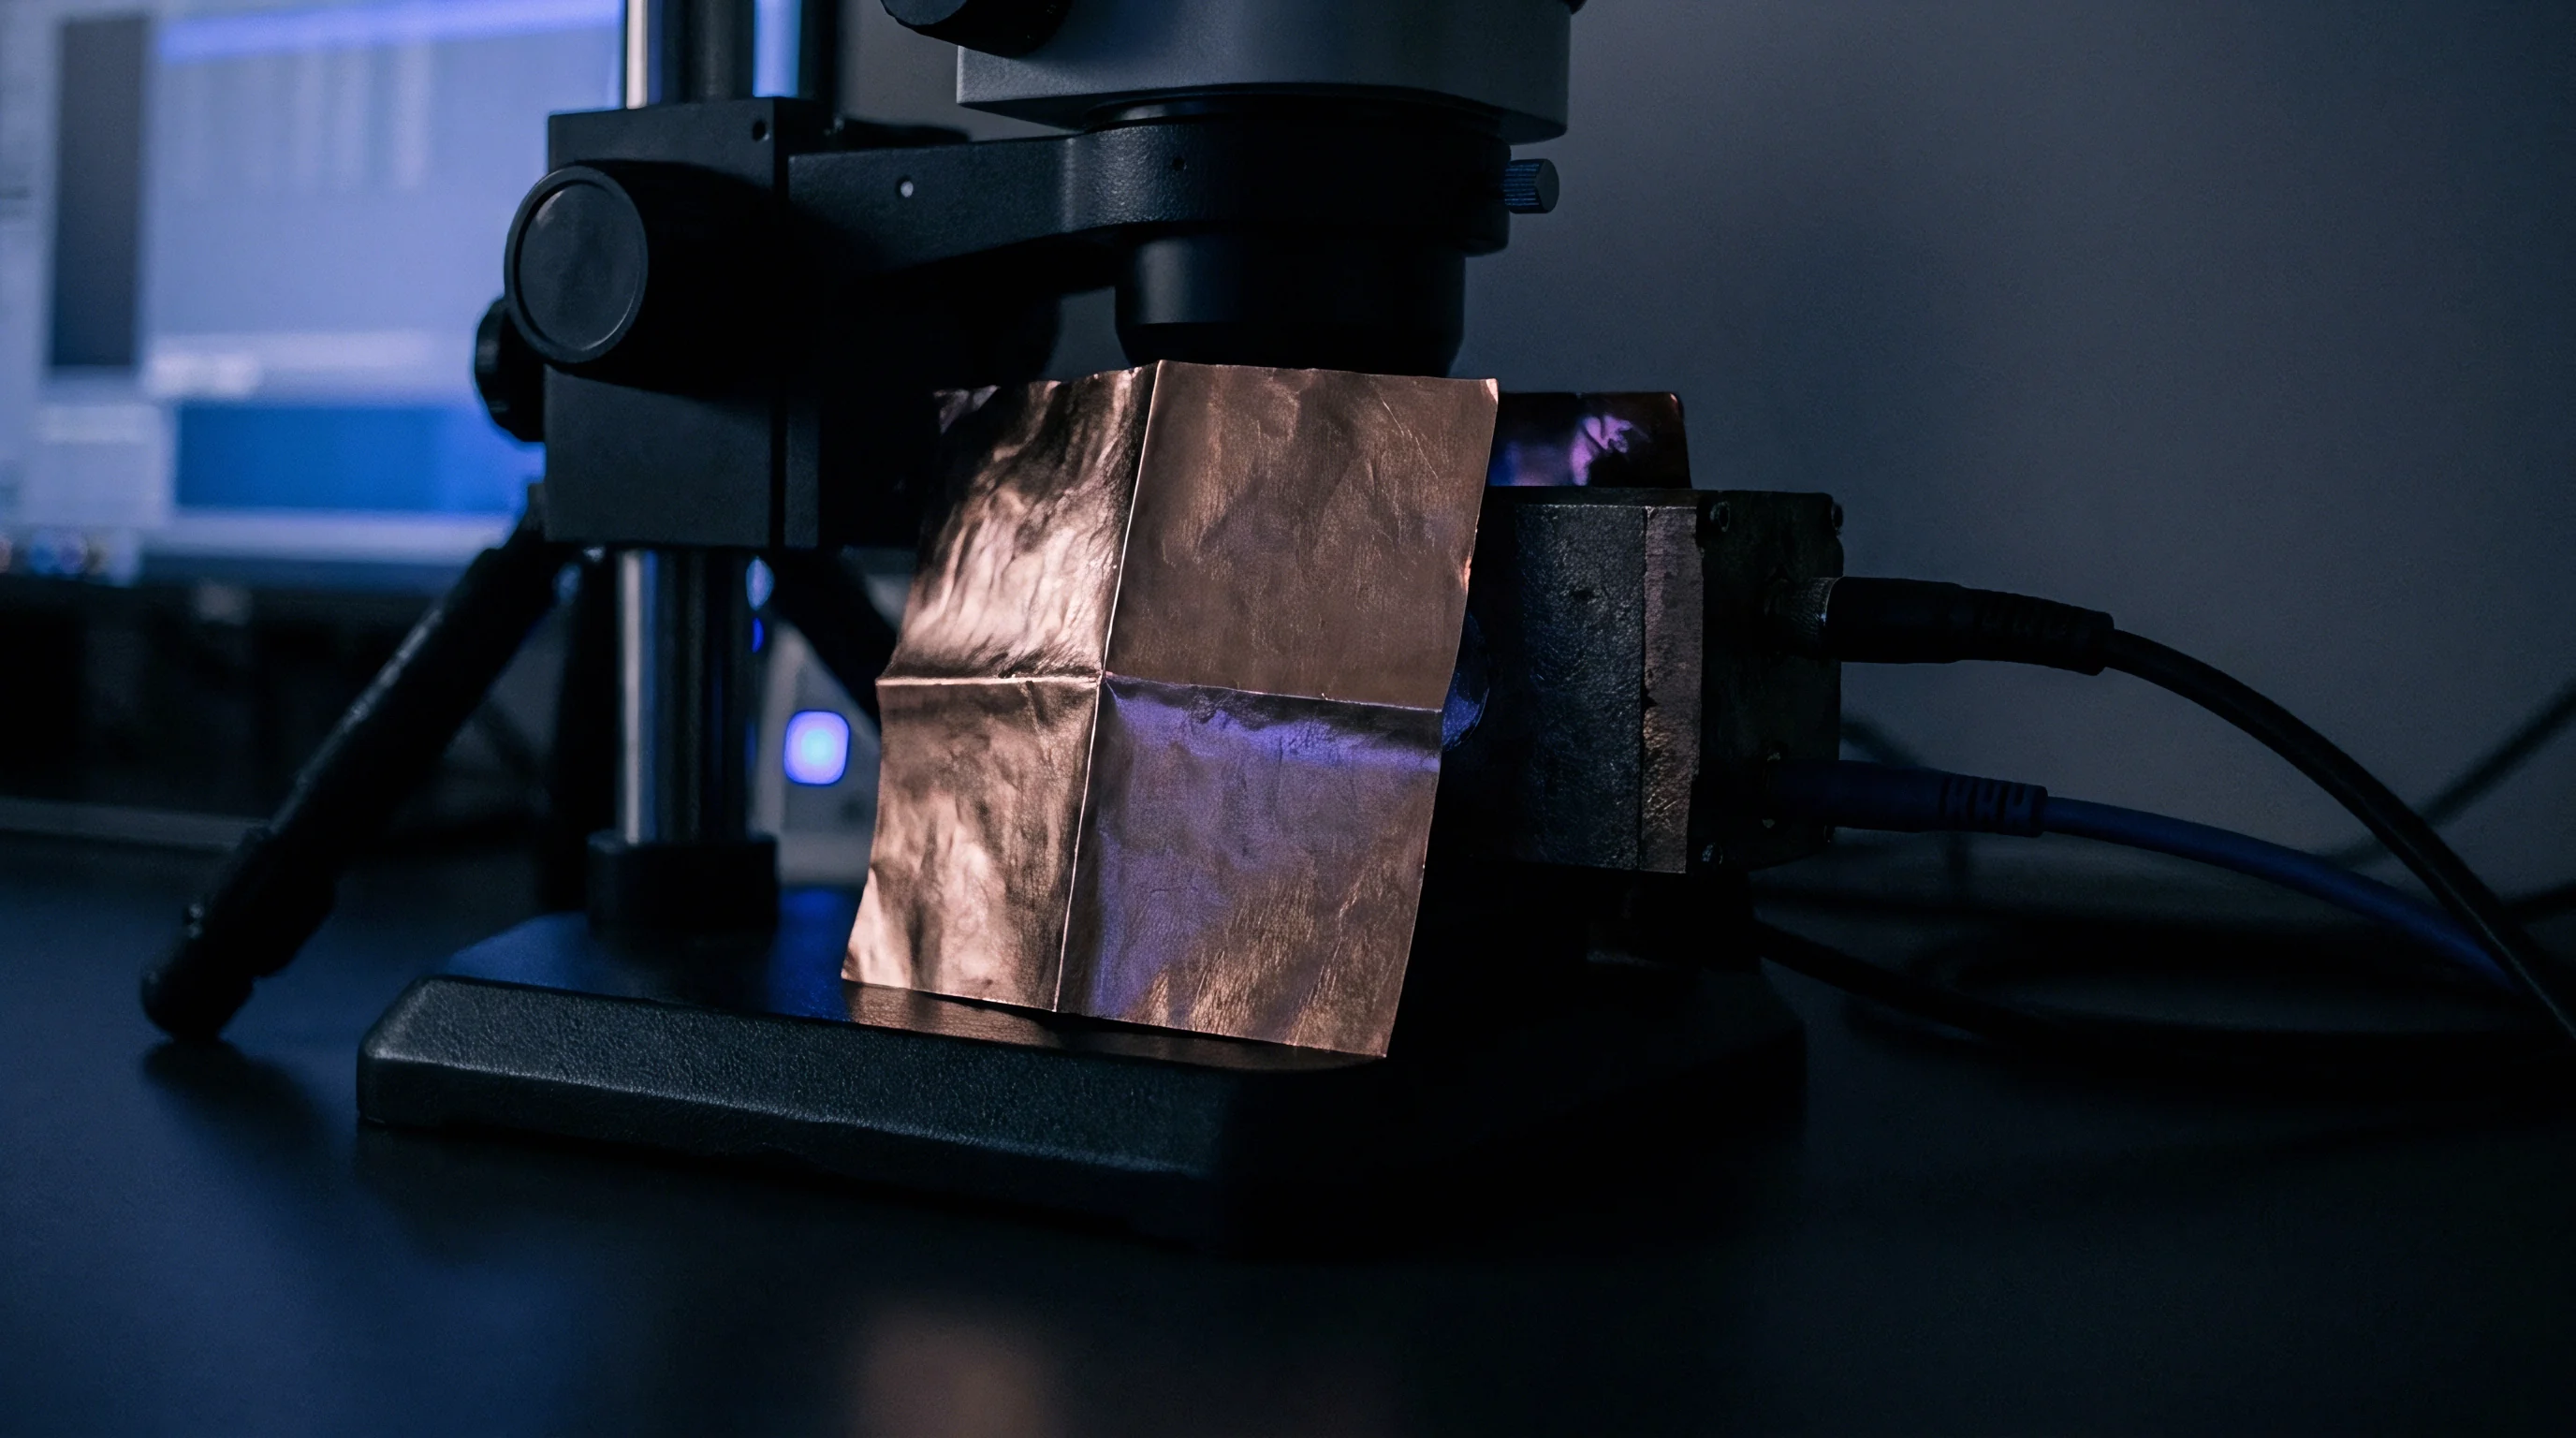
Planar nickel-chromium alloy sheets cold-rolled to sub-micrometer thickness and bonded to alumina ceramic substrates establish the baseline performance of ultra-precision passive components. Compression strain engineered into the metallic film counteracts the positive intrinsic thermal coefficient of resistance characteristic of bulk nickel-chromium alloys. When temperature increases, the ceramic substrate expands at a lower thermal expansion rate than the metallic alloy, pulling the foil into mechanical tension.
This mechanical tension alters the crystal lattice dimensions, decreasing electrical conductivity through strain gauge effects. The mechanical strain effect offsets the natural thermal increase in resistance, maintaining near-zero temperature coefficients from negative fifty-five degrees Celsius to one hundred twenty-five degrees Celsius.
Adhesive bonding layers positioned between the metallic element and the rigid substrate determine how effectively this thermal strain balances electrical resistance over time. Epoxy adhesives and silicone bonding matrices experience viscoelastic relaxation, creeping under continuous physical shear. Over months of thermal cycling and operational power dissipation, the polymer adhesive relaxes, releasing stored shear stress at the interface.
As the bond line softens or shifts, compressive strain on the metallic grid relaxes, causing permanent resistance wander known as structural drift.
A ten-kilohm precision bulk foil resistor tested at ambient room temperature shifts up to fifteen parts per million after two thousand hours of continuous rated electrical load.
Etching patterns in the foil grid create serpentine current paths that concentrate localized strain along narrowed turning points. Micro-yield phenomena occur at high-stress points within the etched pattern during circuit warm-up cycles. These structural modifications change the localized resistivity of the active element without altering the overall physical size of the component.
Mechanical stress balance depends on specific material choices and manufacturing variables during sub-component assembly.
- Substrate expansion coefficient dictates the compressive strain forced into the metallic grid during elevated thermal cycles.
- Bonding agent elasticity determines the rate at which interfacial shear stress decays during extended storage.
- Etching photo-mask precision governs stress concentrations along serpentine current turnarounds in the resistive pattern.
- Annealing cycle duration sets the initial dislocation density inside the cold-rolled metallic structure before calibration.
The table below details physical characteristics and drift performance across standard metallic foil alloy and substrate combinations.
| Foil Alloy Type | Substrate Material | Thermal Expansion Differential (ppm/°C) | Nominal TCR (ppm/°C) | 1000-Hour Load Drift (ppm) |
|---|---|---|---|---|
| Alumina (Al2O3 96%) | 7.2 | ±2.0 | ±35 | |
| Alumina (Al2O3 99.5%) | 5.8 | ±0.5 | ±15 | |
| Silicon Crystal | 2.1 | ±0.2 | ±5 | |
| Aluminum Nitride | 8.5 | ±1.0 | ±25 |
Uncorrected mechanical strain shifts the internal zero-point of precision instrumentation, forcing premature re-calibration of input amplifier stages in high-resolution data acquisition systems.
Lattice
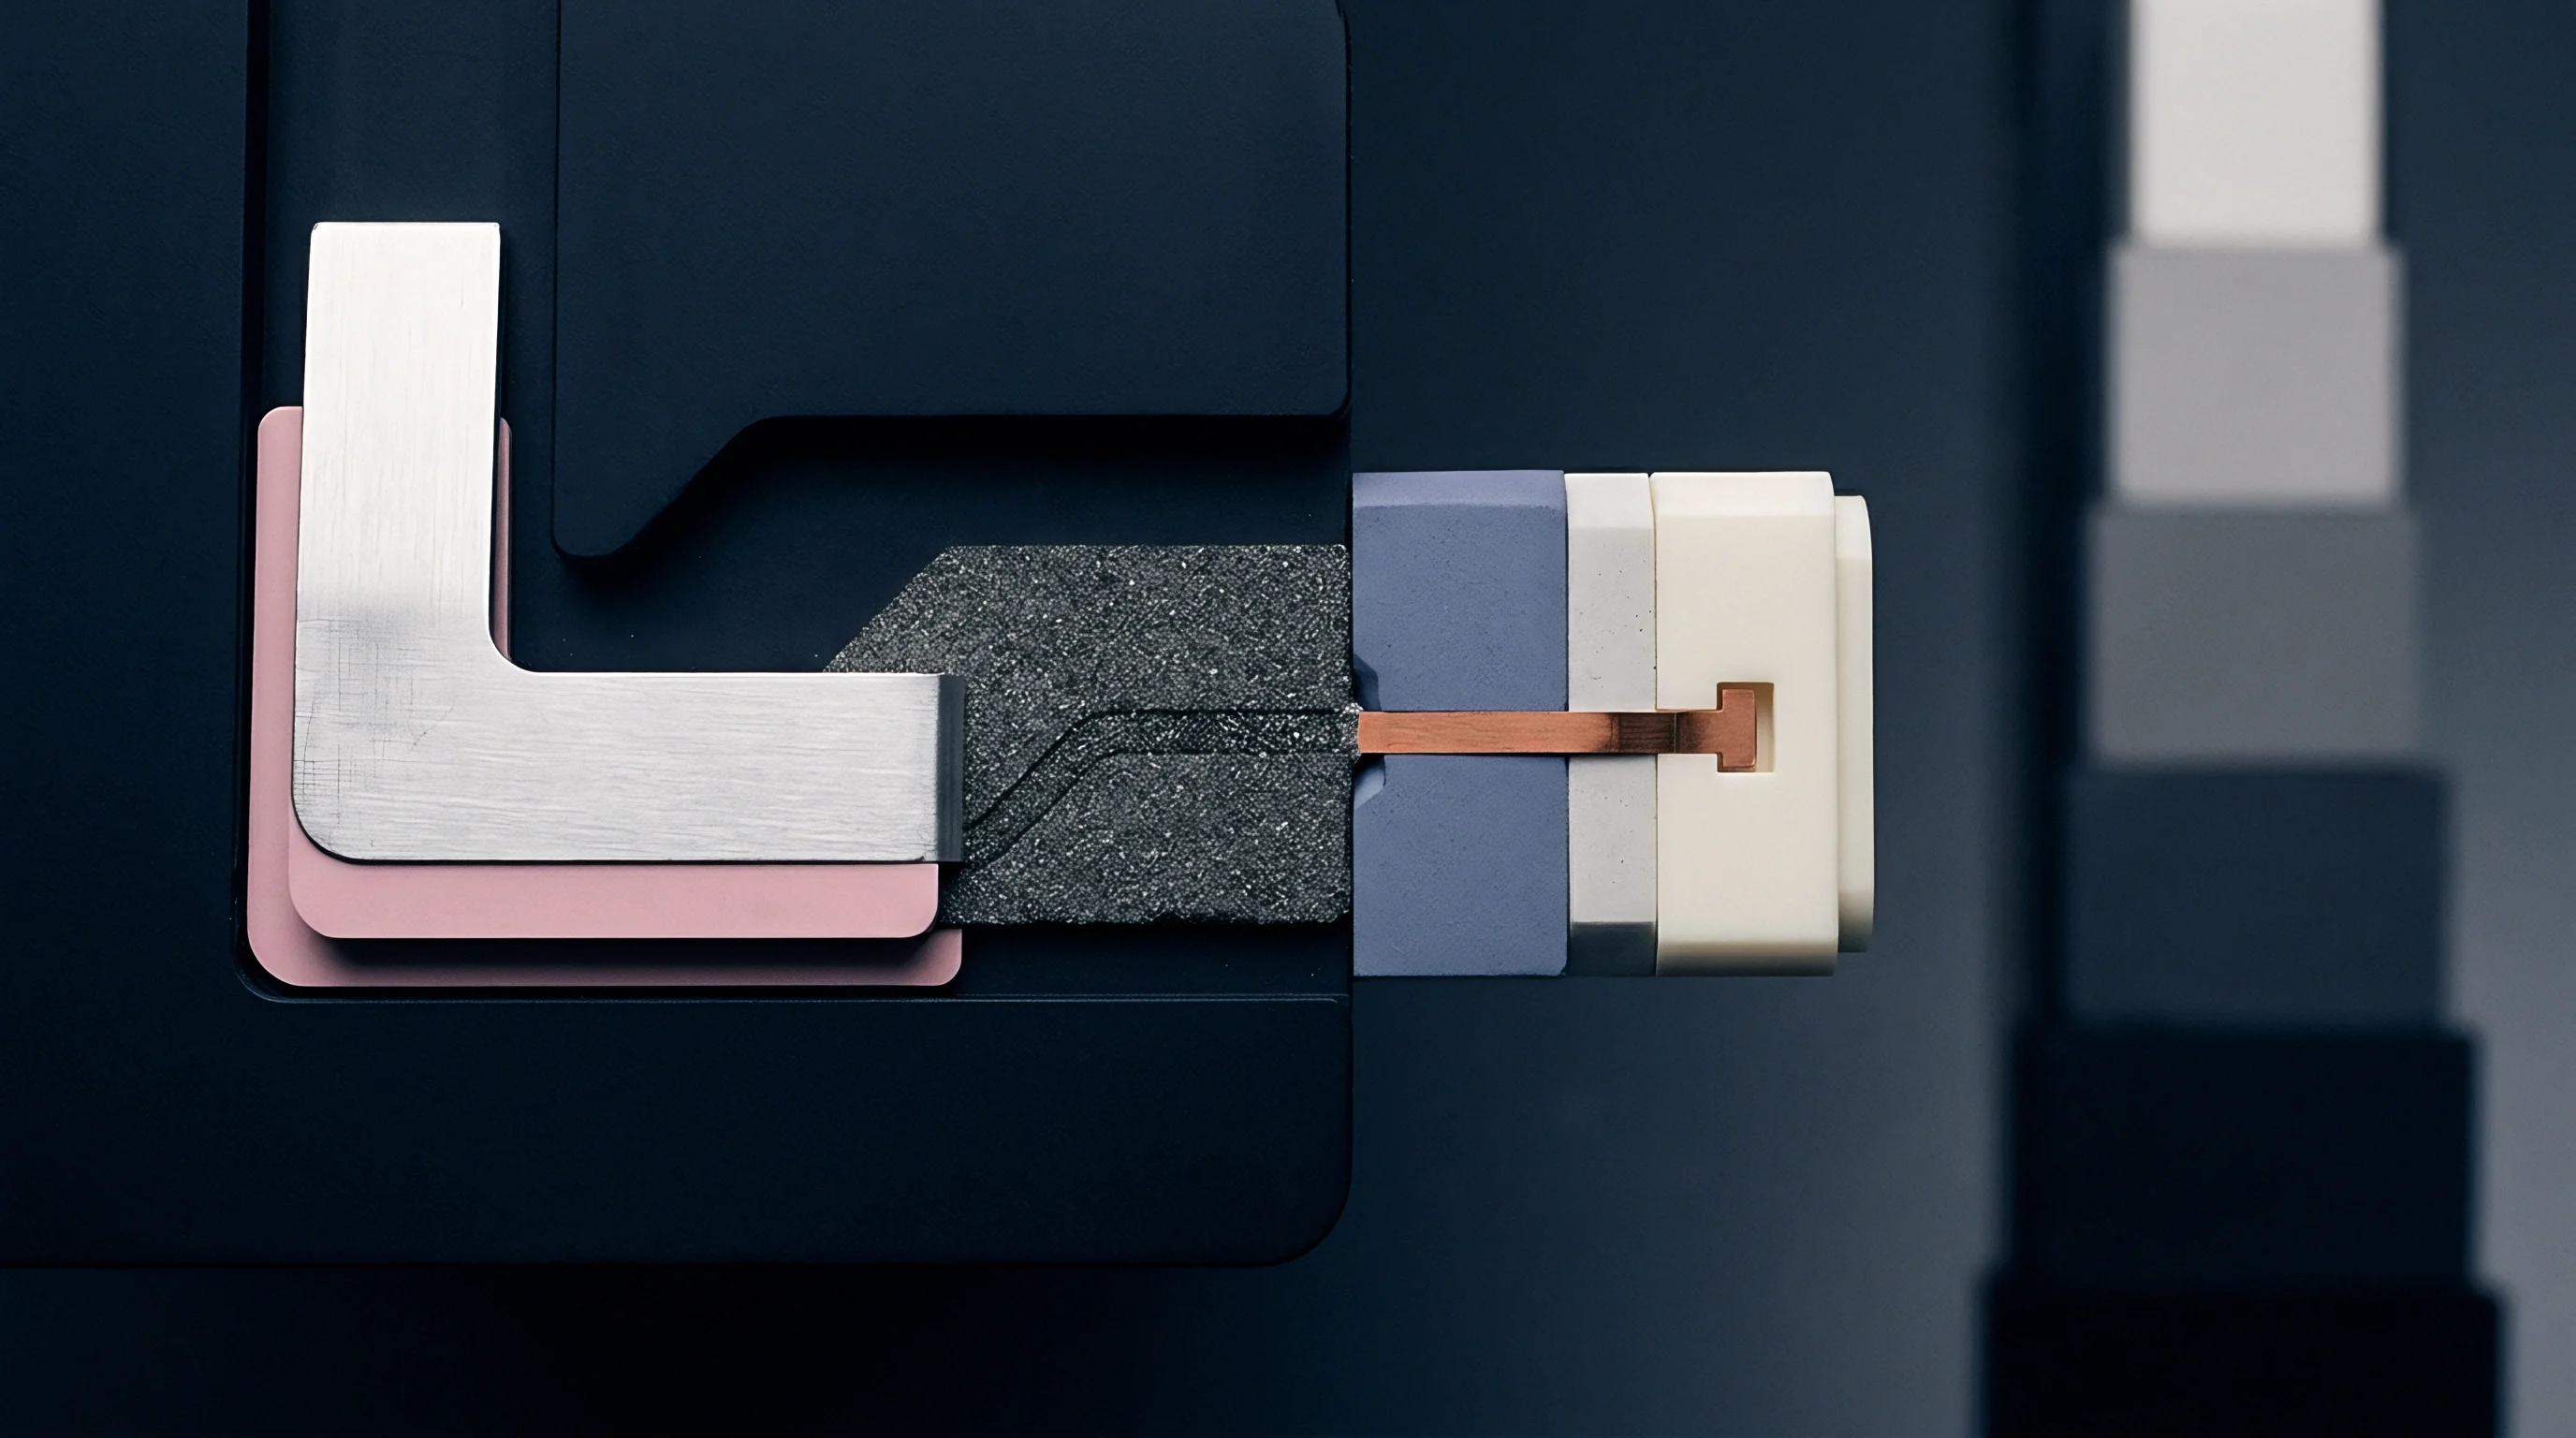
Atomic rearrangement within nickel-chromium matrix structures occurs continually under electrical excitation and thermal environment changes. Cold rolling during foil creation introduces high dislocation densities into the crystal grain structure. Annealing heat treatments attempt to stabilize these internal structures, yet atomic diffusion persists at room temperature over long durations.
Vacancy migration toward grain boundaries alters the effective mean free path of conducting electrons, producing measurable drift in absolute resistance values.
Short-range atomic ordering causes non-linear resistance changes in nickel-chromium systems. Operating temperatures between forty degrees Celsius and eighty degrees Celsius accelerate short-range ordering, shifting the resistance upward over extended operation. Higher thermal exposure above one hundred twenty degrees Celsius disrupts this local atomic ordering, reversing the resistance shift.
Standard industrial specifications rate load-life stability over two thousand hours, whereas metrological instrumentation demands predictable stability across ten-year operational windows.
Thermal shock events drive reversible and irreversible shifts in the metallic crystal structure. Reversible variations disappear once the component returns to reference ambient conditions, whereas irreversible variations permanently displace the baseline ohmic value. Hysteresis loops formed during thermal cycling reflect microscopic slip events along crystal grain planes within the foil element.
Long-term degradation mechanisms operate through distinct physical pathways within the active metallic layer.
- Vacancy annihilation reduces electron scattering centers, causing an initial downward resistance drift during early service life.
- Grain boundary oxidation increases resistance along thin foil edges where atmospheric oxygen contacts the active element.
- Short-range order formation increases resistivity slowly as chromium atoms reorganize into low-energy clusters within the lattice.
- Electromigration stress displaces metal atoms at high current density nodes, creating micro-voids in serpentine turnarounds.
Under thermal strain, bonding adhesives undergo gradual relaxation. Long-term shelf-life drift typically stabilizes within six months of storage, after which remaining resistance changes stem from external PCB mounting stresses.

Moisture
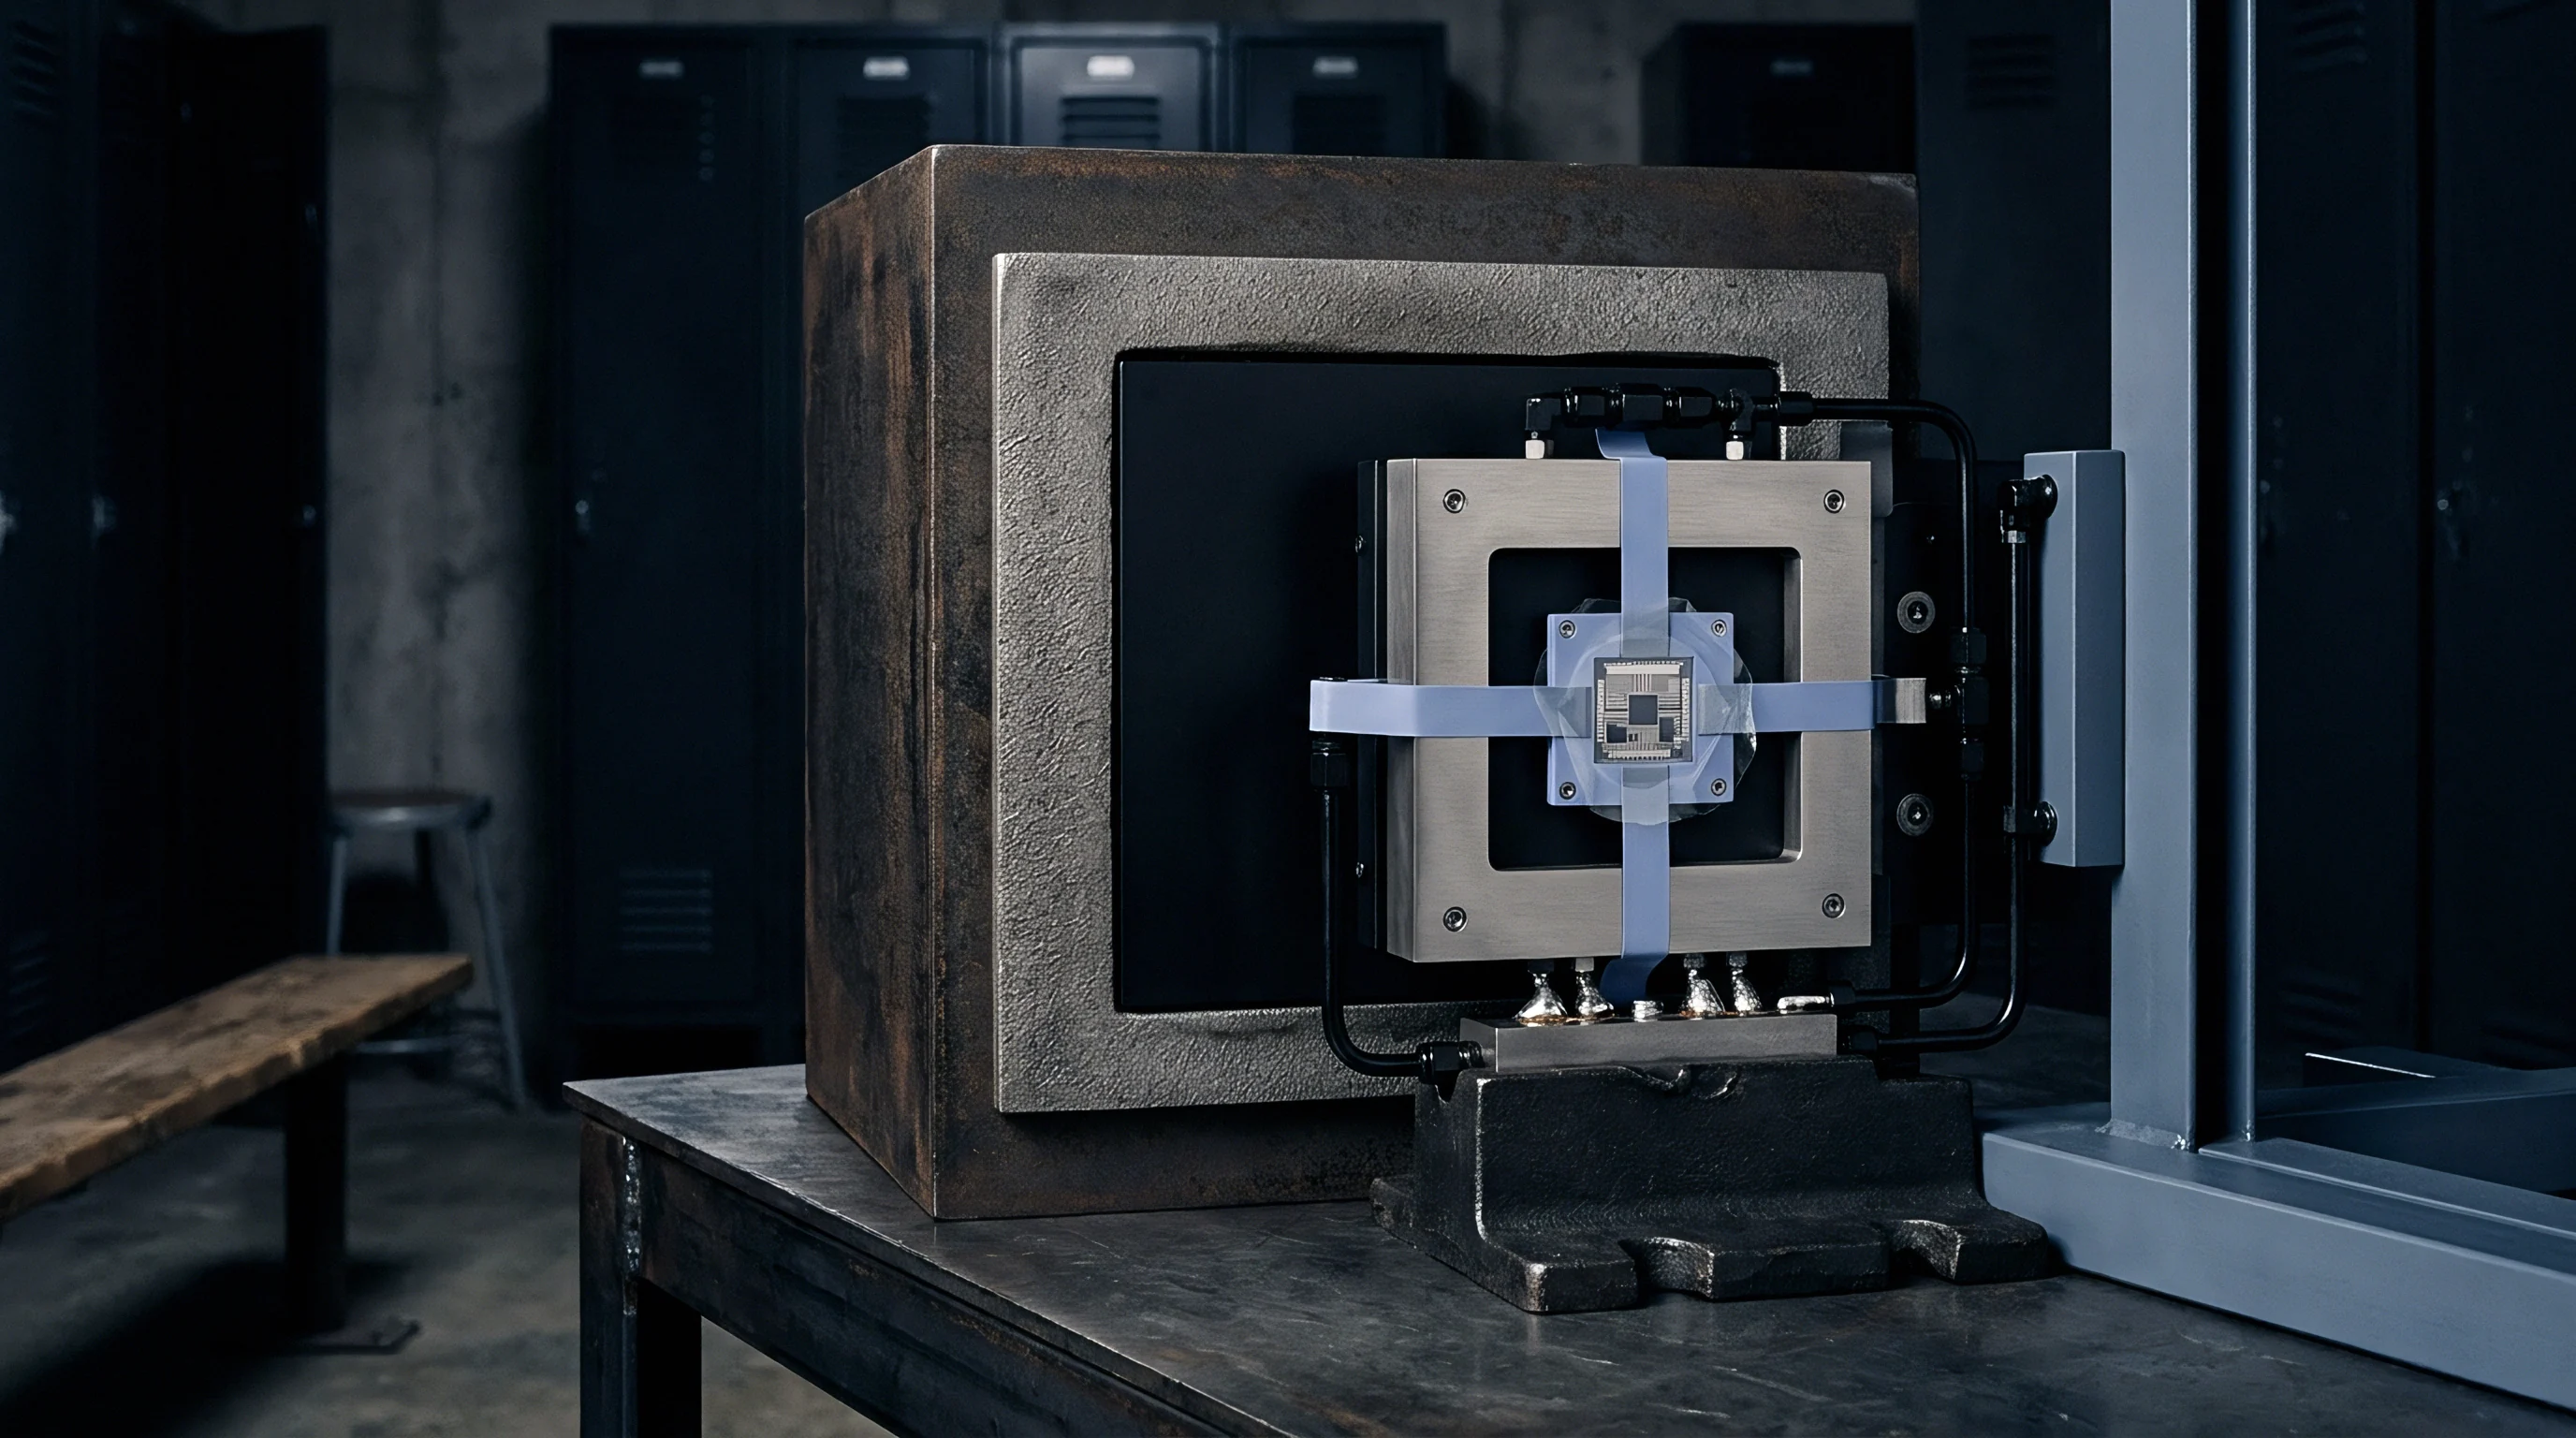
Atmospheric vapor penetration through polymer encapsulation alters internal stress fields and creates secondary parallel resistance paths. Epoxy molding compounds absorb water molecules from ambient air until reaching hygroscopic equilibrium with surrounding humidity. As the polymer matrix absorbs moisture, the volume of the encapsulation material expands.
This volumetric expansion exerts outward pulling forces on the ceramic substrate while applying direct compressive forces to the underlying metallic element through the internal protective coating.
Which Packaging Architecture Suppresses Moisture Drift over Extended Storage?
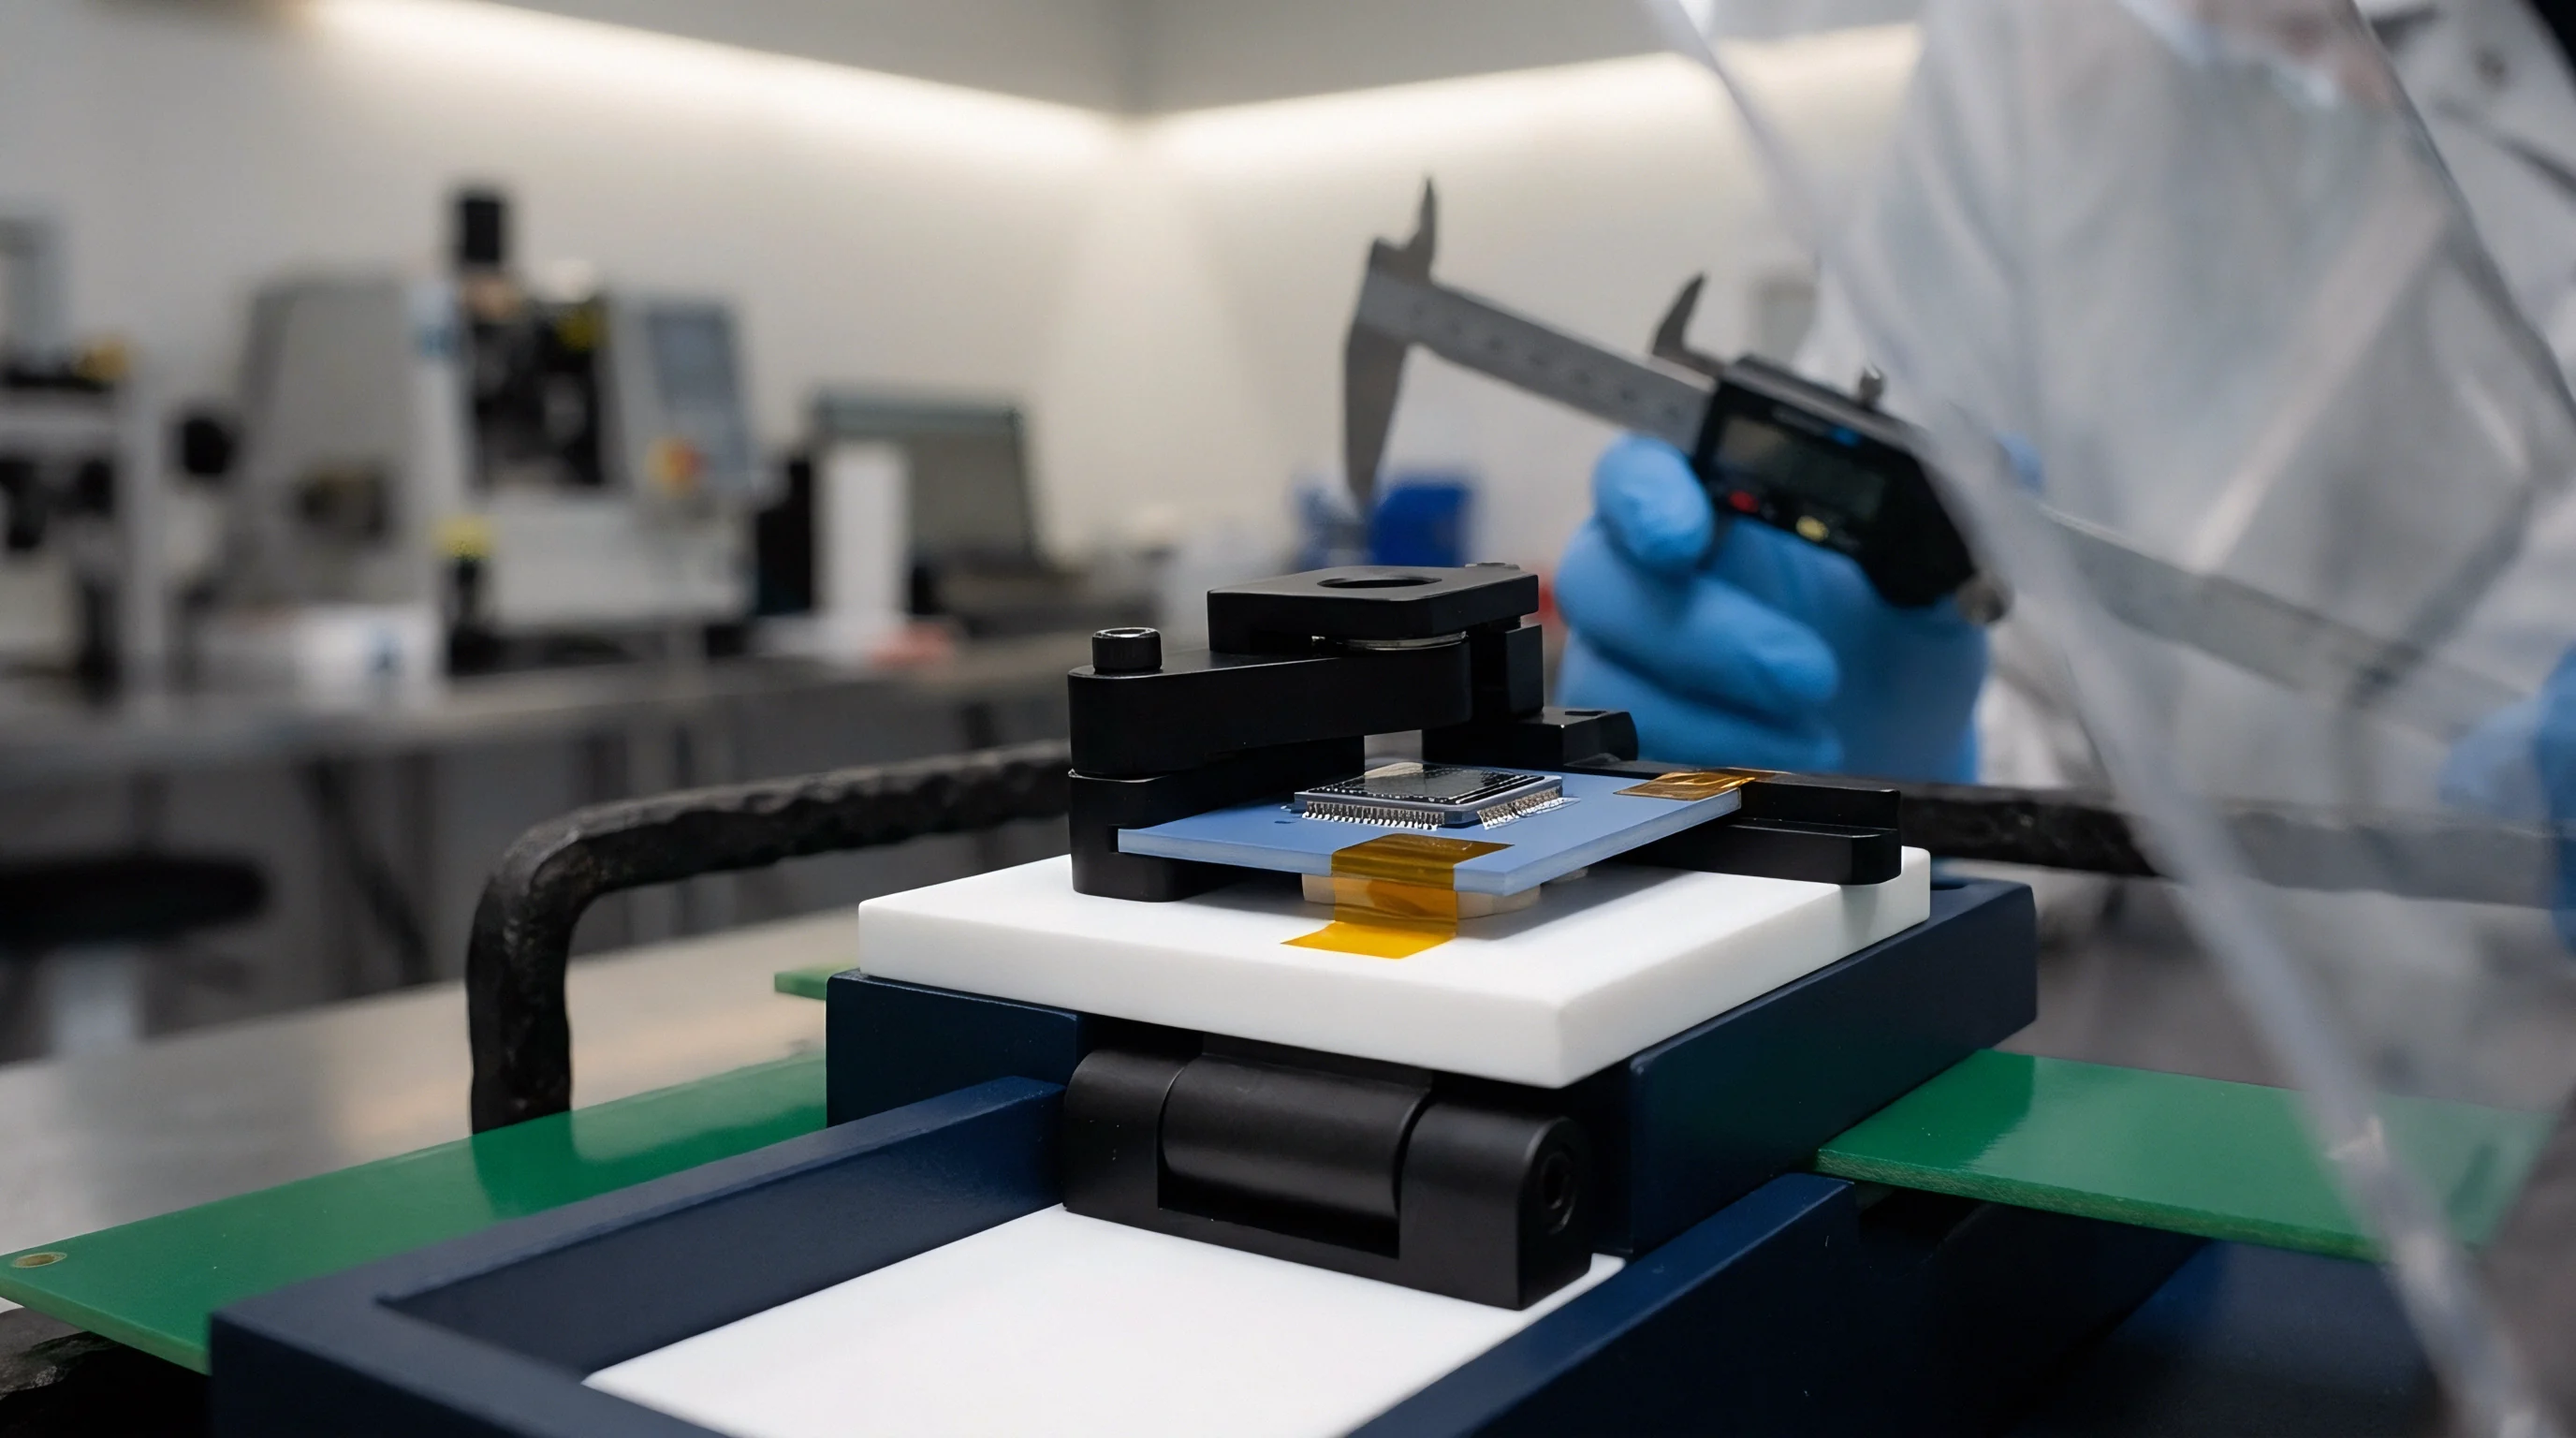
Hermetic packaging completely isolates the active resistive grid from external atmospheric humidity variations. Glass-to-metal sealed miniature cans filled with dry nitrogen or inert oil eliminate water vapor ingress entirely. Epoxy-molded surface-mount devices remain vulnerable to seasonal humidity fluctuations.
During humid summer months, molded devices absorb moisture and swell, shifting resistance values upward or downward depending on internal strain geometry. In dry winter months, water vapor desorbs from the plastic, driving a reverse strain cycle.
Component qualification standard IEC 60115-1 specifies high-humidity testing at eighty-five percent relative humidity without defining the post-test drying time required for strain recovery.
Surface leakage channels form when moisture combines with trace ionic contaminants on non-hermetic package surfaces. Microscopic condensation layers bridge terminal contacts, reducing parallel insulation resistance. At high circuit impedances, this secondary leakage path dominates observed drift figures, mimicking an actual reduction in foil element resistance.
The comparative evaluation below presents environmental drift behavior across distinct package construction styles subjected to accelerated environmental exposure.
| Package Construction | Ingress Protection Rating | 85°C / 85% RH Drift (1000h) | Thermal Hysteresis (-55°C to +125°C) | Humidity Recovery Time |
|---|---|---|---|---|
| IP62 equivalent | ±150 ppm | 10 ppm | 14 days | |
| IP50 equivalent | ±300 ppm | 15 ppm | 5 days | |
| IP68 certified | ±5 ppm | 2 ppm | 0 days | |
| IP68 certified | ±2 ppm | 1 ppm | 0 days |
Although moisture drives reversible resistance shifts, open questions remain over whether the internal strain state ever returns fully to its initial baseline after desiccation, or if polymer swelling permanently alters the foil bond line interface.

Screening
Standard production testing measures initial room-temperature resistance, leaving post-assembly strain and early load-life aging unquantified. Reflow soldering subjects surface-mount components to rapid thermal spikes reaching two hundred sixty degrees Celsius. Board assembly introduces solder shock, and thermal expansion mismatch between the printed circuit board substrate and ceramic resistor body imparts significant mechanical bending strain through the solder joints.
Pre-conditioning protocols accelerate initial strain release before final circuit calibration. Thermal seasoning cycles alternate parts between temperature extremes to exhaust early stress relaxation mechanisms.
The following sequence details the operational procedure for pre-conditioning and verifying ultra-precision foil resistors destined for high-stability metrological references.
- Expose unmounted components to fifty thermal shock cycles from negative fifty-five degrees Celsius to one hundred twenty-five degrees Celsius with a ten-minute dwell time at each extreme.
- Solder components onto test evaluation boards using temperature-controlled reflow profiles matching final production parameters.
- Stabilize assembled circuit boards at standard reference conditions of twenty-three degrees Celsius and fifty percent relative humidity for ninety-six hours.
- Measure baseline resistance using a four-wire Kelvin sensing setup in a temperature-controlled liquid bath stabilized to within five thousandths of a degree Celsius.
- Apply full rated power dissipation to parts inside an environmental chamber held at seventy degrees Celsius for one hundred sixty-eight consecutive hours.
- Cool assemblies back to reference laboratory conditions and re-measure resistance values to record initial load-life burn-in shift.
- Reject any manufacturing lot exhibiting a mean resistance change exceeding ten parts per million during the burn-in phase.
Consider a practical engineering evaluation for an analog front-end reference circuit. Assume a ten-kilohm precision bulk foil resistor specification operating in a precision sensor digitizer. The design target demands maximum resistance drift under five parts per million across three years of field operation.
Unconditioned off-the-shelf molded resistors display an initial load-life drift of fifty parts per million during their first five hundred operational hours. Implementing a thermal pre-conditioning sequence reduces subsequent three-year field drift from fifty parts per million down to three parts per million.
Thermal conditioning eliminates early exponential drift curves, leaving a predictable linear aging rate suitable for mathematical software compensation.
Military standard specification clause MIL-PRF-55182 Section 4.8.4 mandates power conditioning for one hundred hours at seventy degrees Celsius, converting non-linear early drift into a stable linear aging trend.

Outlay
Selecting an ultra-tight initial resistance tolerance without evaluating three-year field stability shifts maintenance costs directly onto ownership budgets. Initial factory tolerance reflects resistance at twenty-five degrees Celsius immediately after manufacture. Long-term metrological drift erodes this initial tolerance band during field service; a resistor purchased at one hundredth of a percent tolerance can drift past one tenth of a percent within two years if exposed to continuous electrical load and elevated humidity.
Sub-ppm stability components command higher unit acquisition costs due to complex hermetic packaging, low-yield alloy selection, and extended factory burn-in procedures. Unverified stability claims increase warranty risk. Field verification costs double factory testing.
The financial matrix below maps unit purchase costs against calibration maintenance costs across component precision tiers.
| Precision Class | Unit Cost Range (USD) | Initial Tolerance (%) | Annual Drift Claim (ppm) | Recommended Re-Calibration Interval | Five-Year Total Cost of Ownership |
|---|---|---|---|---|---|
| $3 – $8 | ±0.05% | 15 to 30 | 12 months | $180 | |
| $12 – $25 | ±0.01% | 5 to 10 | 24 months | $120 | |
| $45 – $110 | ±0.005% | 2 to 5 | 36 months | $145 | |
| $150 – $350 | ±0.001% | 0.5 to 2 | 60 months | $220 |
High initial component cost buys longer recalibration intervals and lower warranty field service overhead.