Constitutive Parameter Extraction for Packaging Alloys
Extracting constitutive parameters for packaging alloys requires strain-rate control, optical strain tracking, and multi-temperature curve fitting.
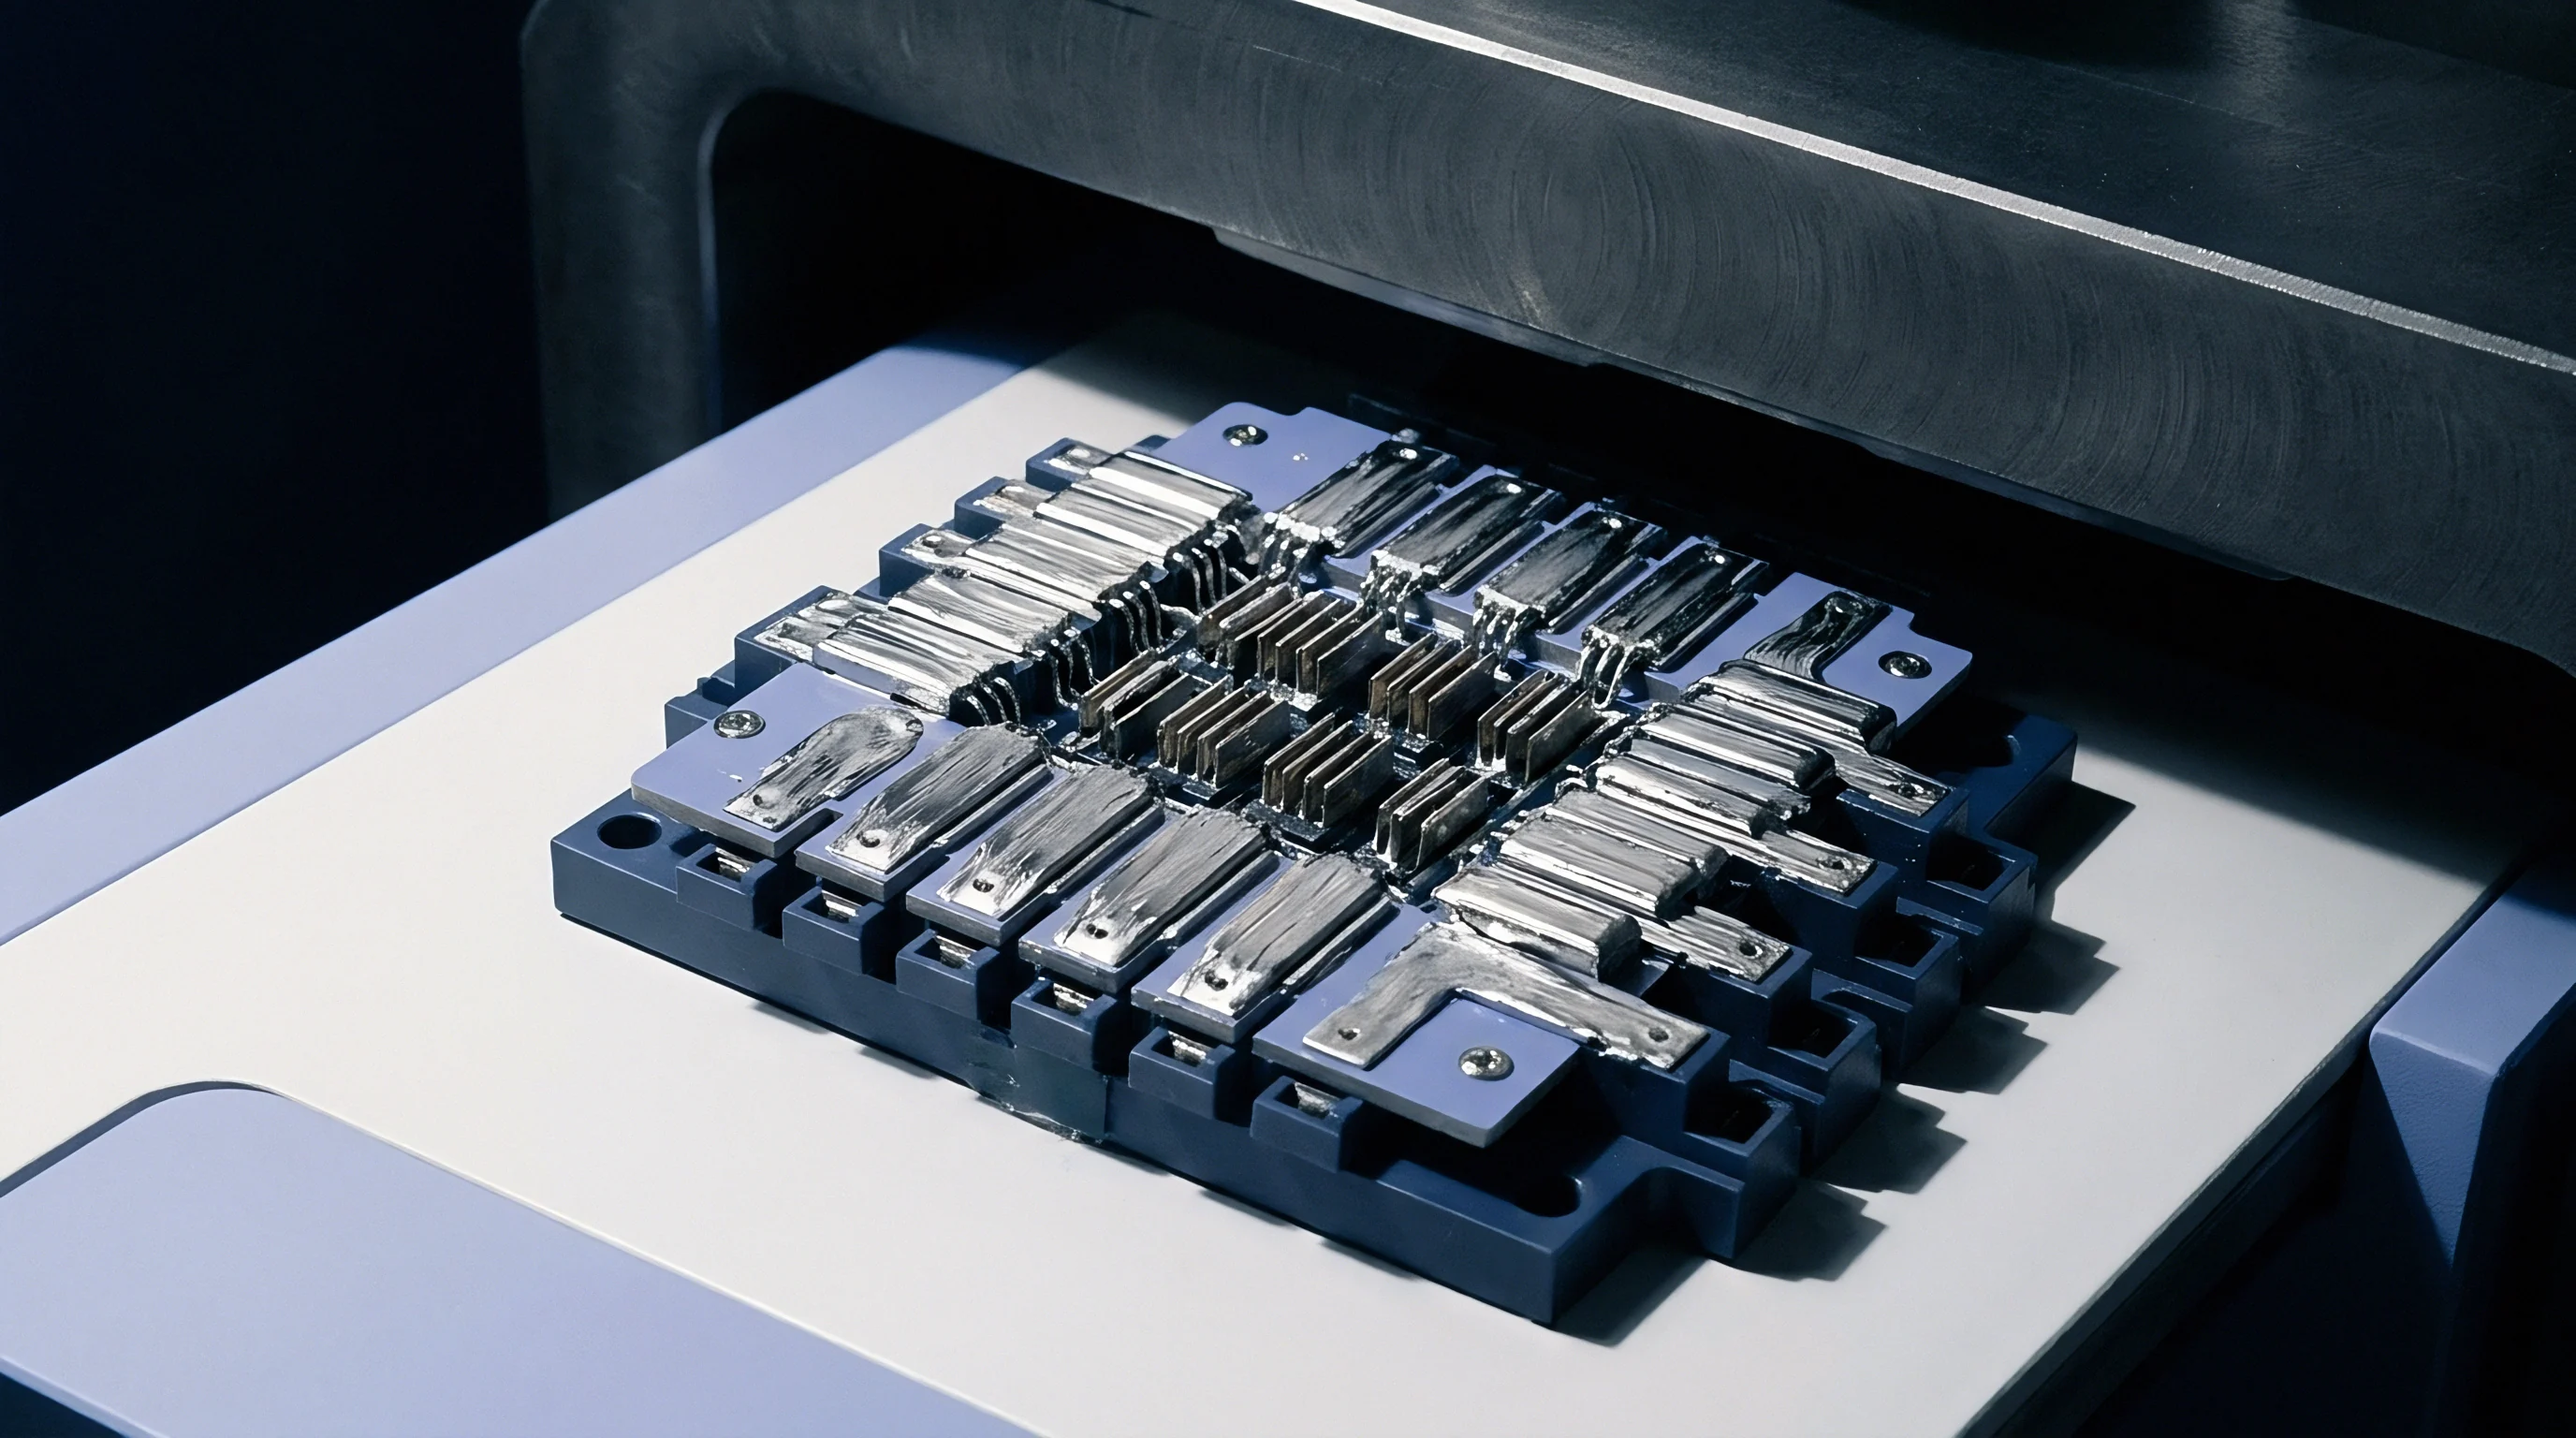
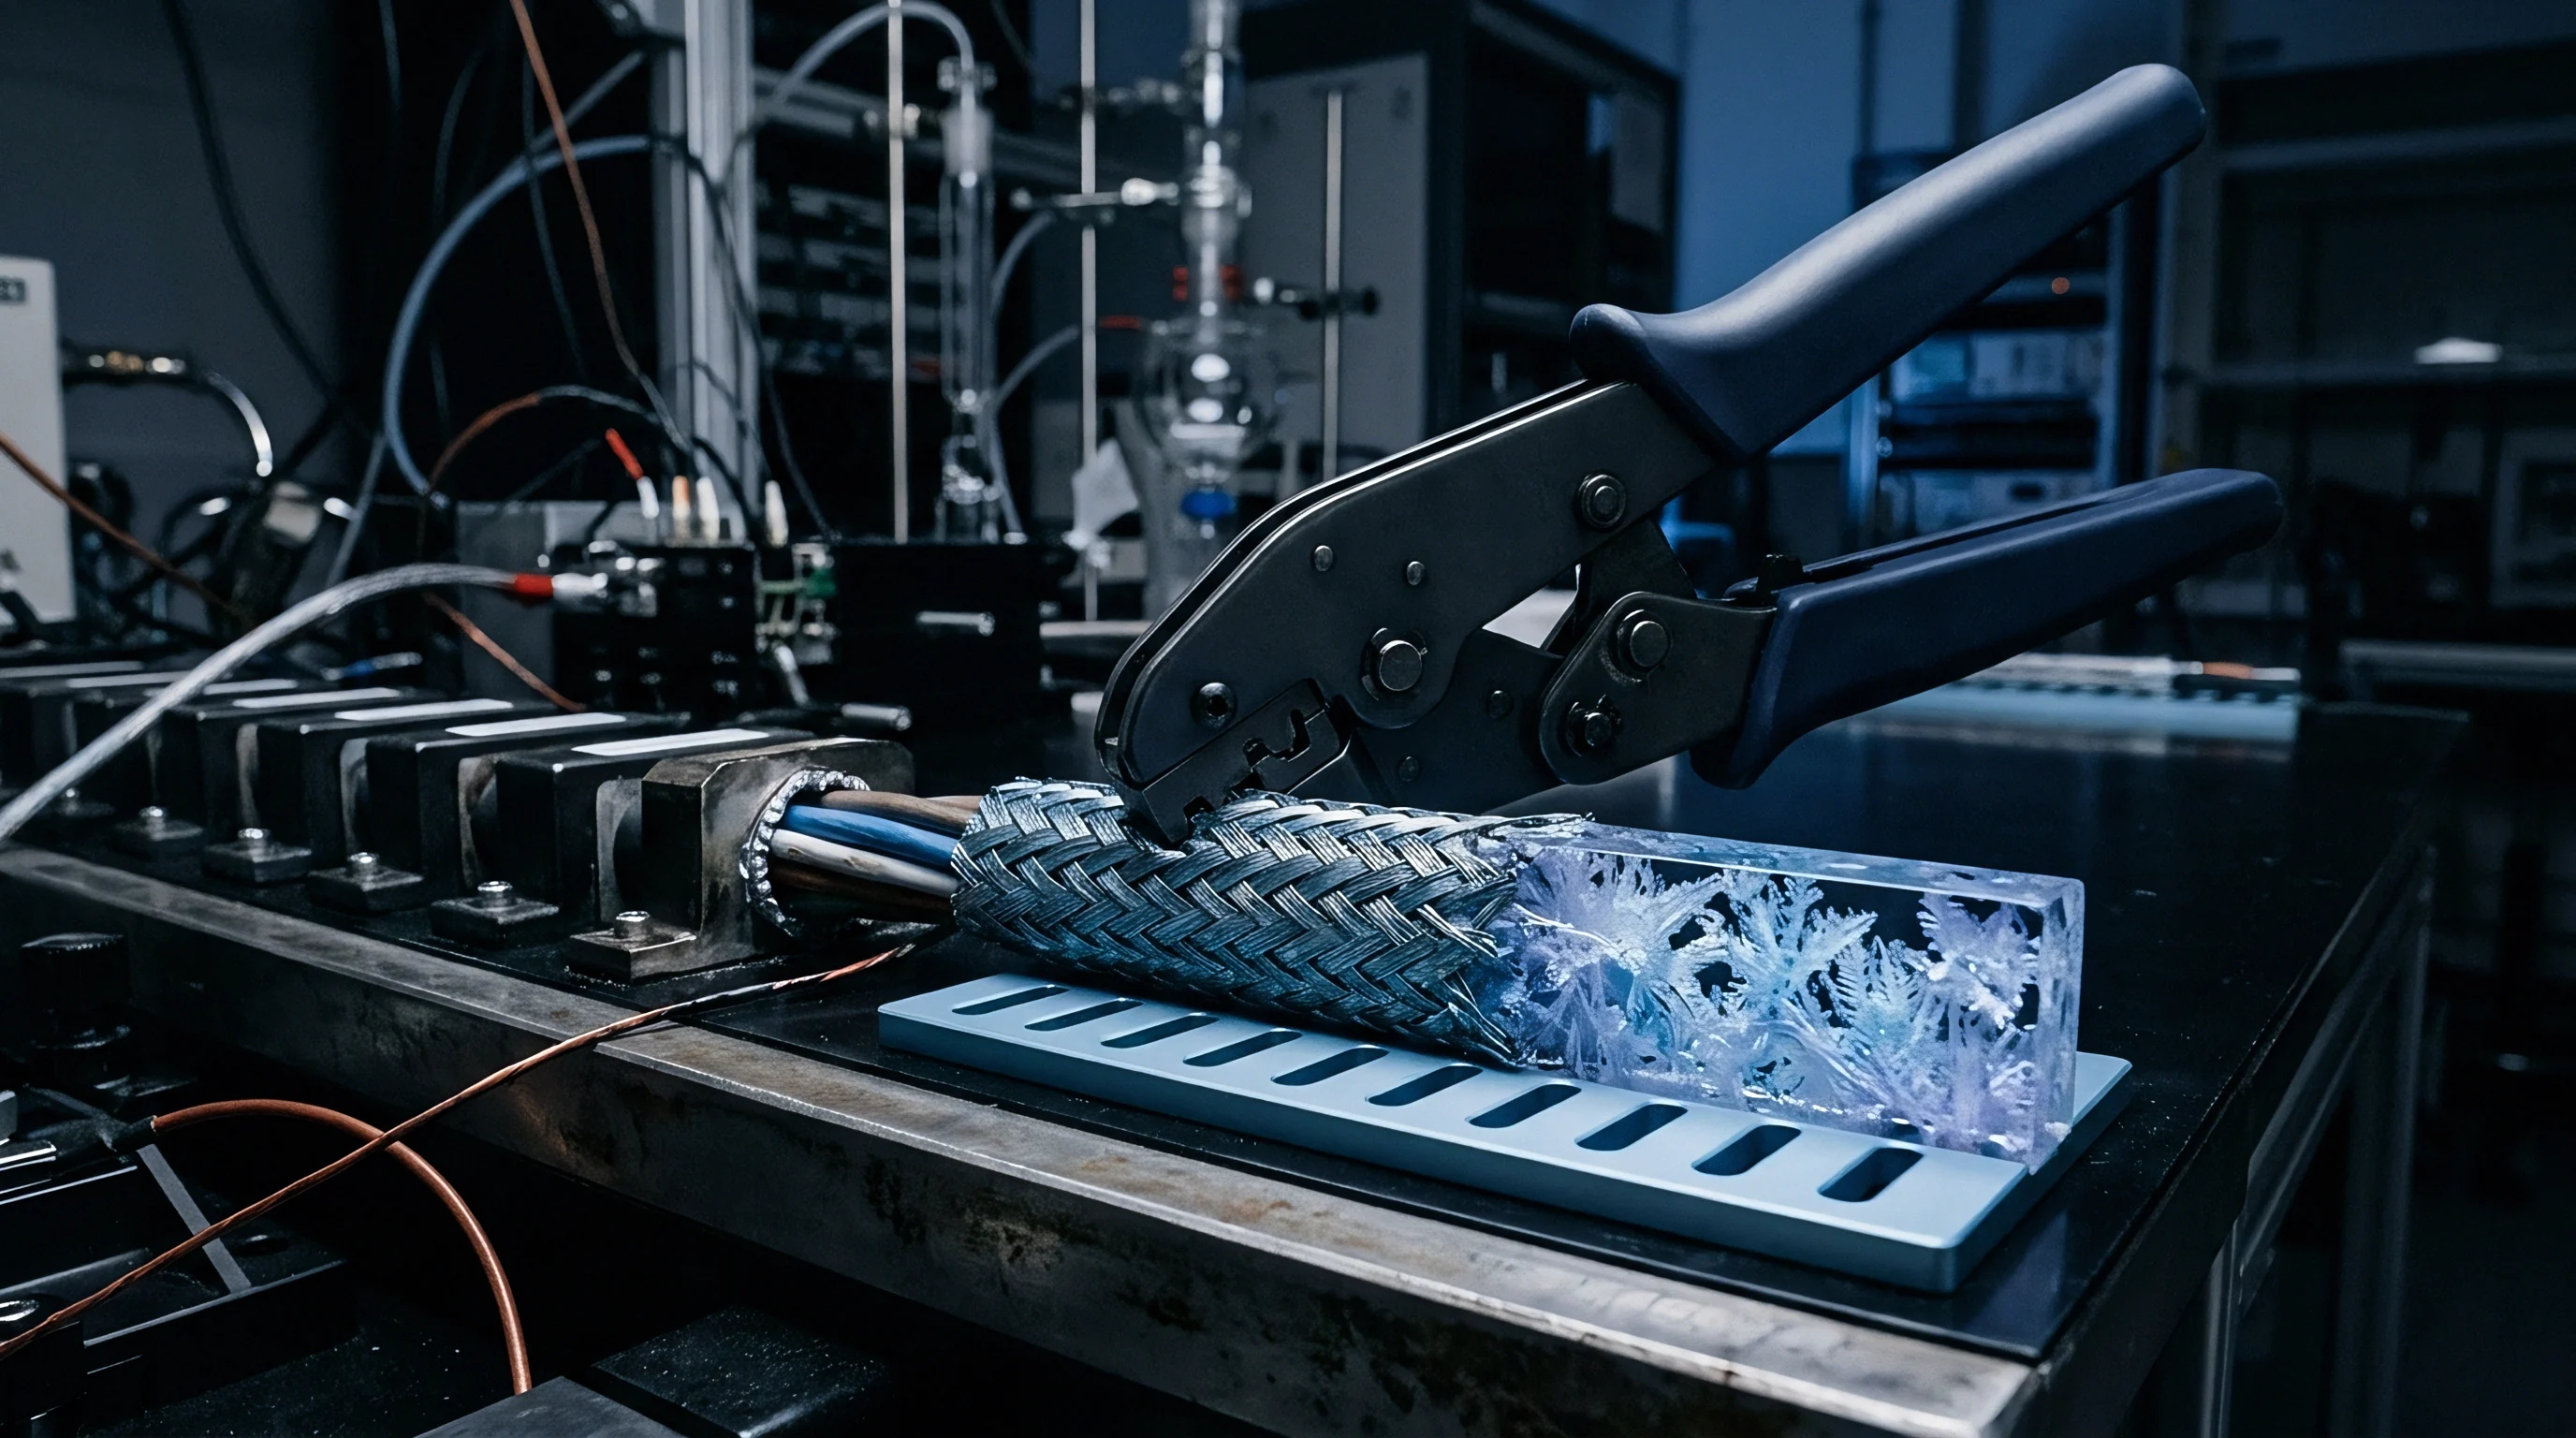
Foil
Thin metallic ribbons in microelectronics packaging face structural constraints that do not apply to bulk stock. Standard tensile test protocols developed for thick bars fail on 100-micrometer packaging foils or 25-micrometer wire bonds, where specimens contain so few grains across their cross-section that individual crystal orientations dictate yield behavior. At this sub-grain scale, size effects boost apparent flow stress while cutting total elongation prior to failure.
Uncorrected raw load cell data also misattributes machine frame deflection to coupon strain, artificially inflating the calculated elastic modulus by up to 30 percent.
Optical strain measurement resolves localized deformation without physical contact, using digital image correlation to track surface speckle patterns on micro-foil strips during thermal-mechanical cycling. High-resolution cameras capture local strain gradients right at the fillet boundaries where cracks initiate. Alignment requires equal care: load axis deviations over 0.05 degrees introduce secondary bending moments, shifting the stress state from pure tension to mixed tension-bending and causing premature necking across thin foil widths, while edge burrs distort load cell signals.
Gauge length displacement uncertainty exceeding 0.5 micrometers in a 10-millimeter foil specimen introduces a 5 percent bias in extracted yield strength at 25 degrees Celsius.
Direct strain measurement via non-contact optical extensometry bypasses machine compliance issues altogether. Across narrow coupon necks, spatial resolution depends on speckle density and subset size, while sub-pixel interpolation algorithms track displacement through thermal excursions up to 200 degrees Celsius without loss of signal. Air currents drifting through heated test chambers shift the refractive index and introduce artificial strain noise into digital image correlation data, making thermal shields around the test fixtures essential for stable optical path accuracy during long-term runs.
| Specimen Type | Thickness (mm) | Gauge Length (mm) | DIC Resolution (µm) | Modulus Error Risk |
|---|---|---|---|---|
| Rolled Micro-Foil | 0.050 to 0.100 | 10.0 | 0.12 | Machine compliance under-reports stiffness by 22% |
| Electro-deposited Strip | 0.025 to 0.050 | 5.0 | 0.08 | Edge roughness causes 15% stress concentration bias |
| Cast Solder Ribbon | 0.150 to 0.300 | 15.0 | 0.25 | Coarse grain orientation shifts yield by 35% |
| Sintered Copper Sheet | 0.100 to 0.200 | 10.0 | 0.15 | Porosity variation induces 18% local strain scatter |
Foil specimens prepared without chemical etching retain cold-worked surface layers from stamping or spark erosion. High dislocation density stored in these surface layers elevates baseline flow stress, obscuring intrinsic alloy hardening constants. When packaging constitutive parameters are extracted from improperly prepared coupons, structural stiffness errors carry directly into finite element warpage models, leading to package coplanarity failures after mold compound cure.

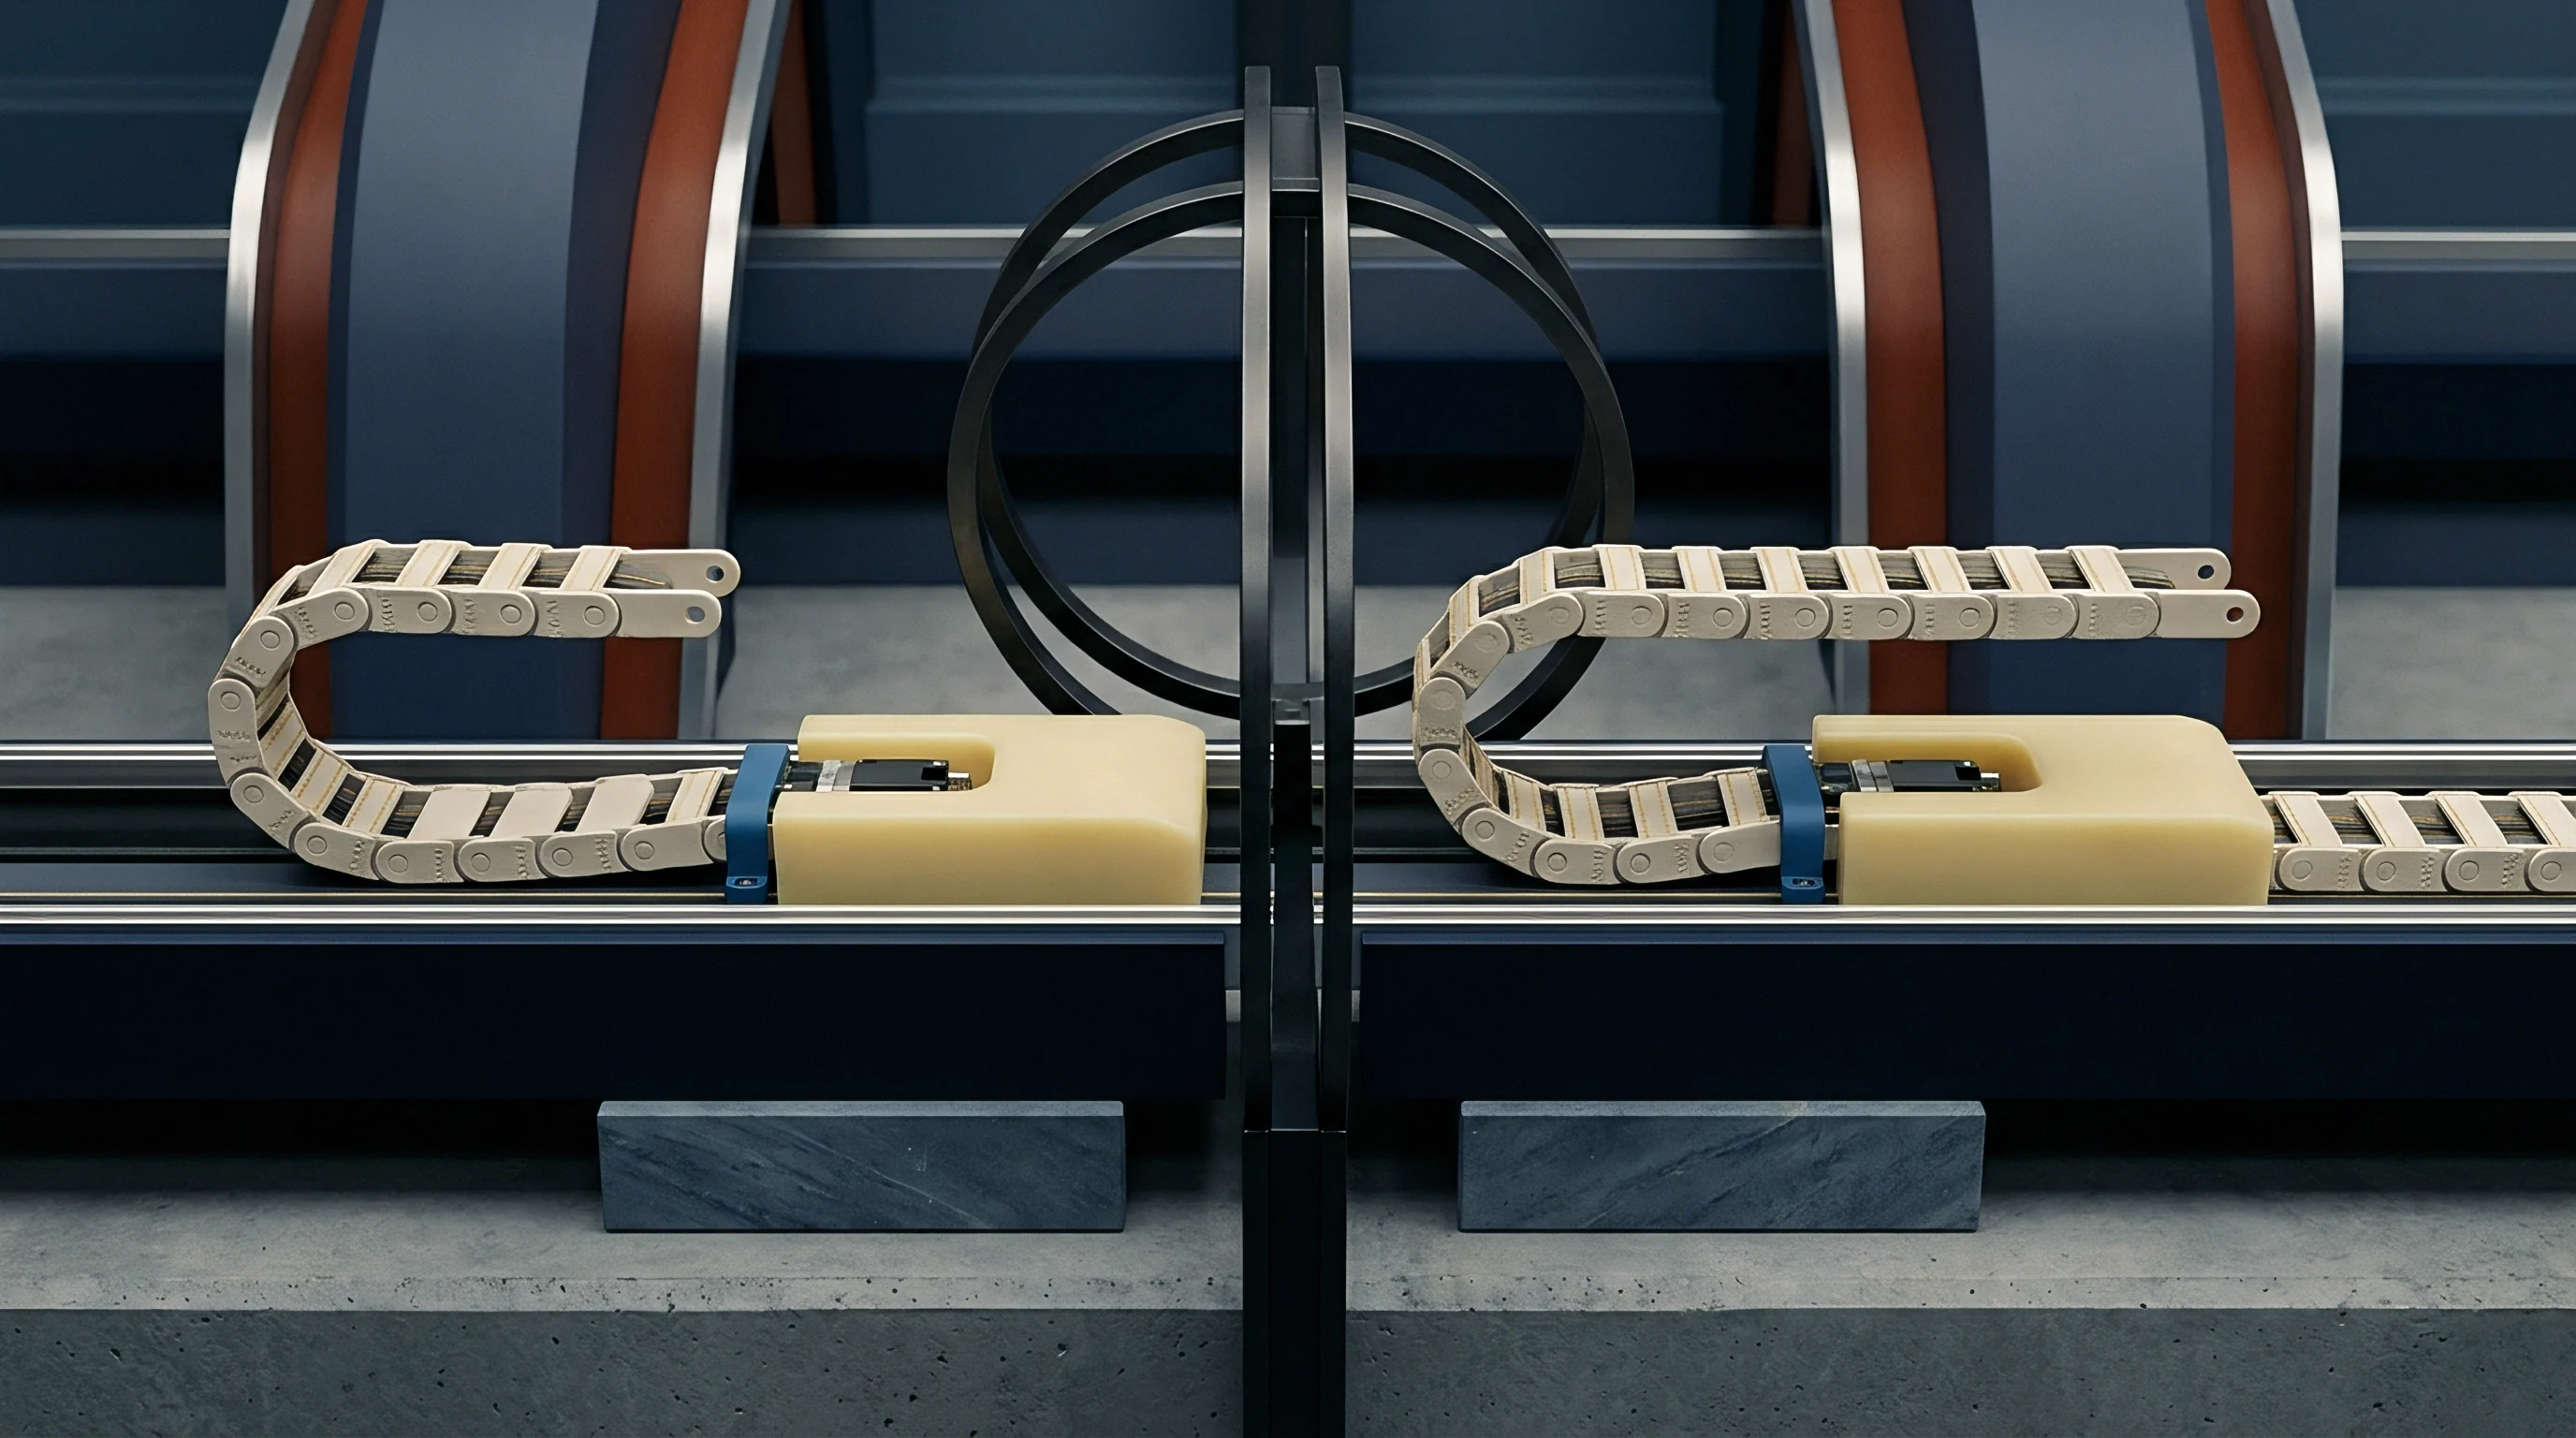
Hardening
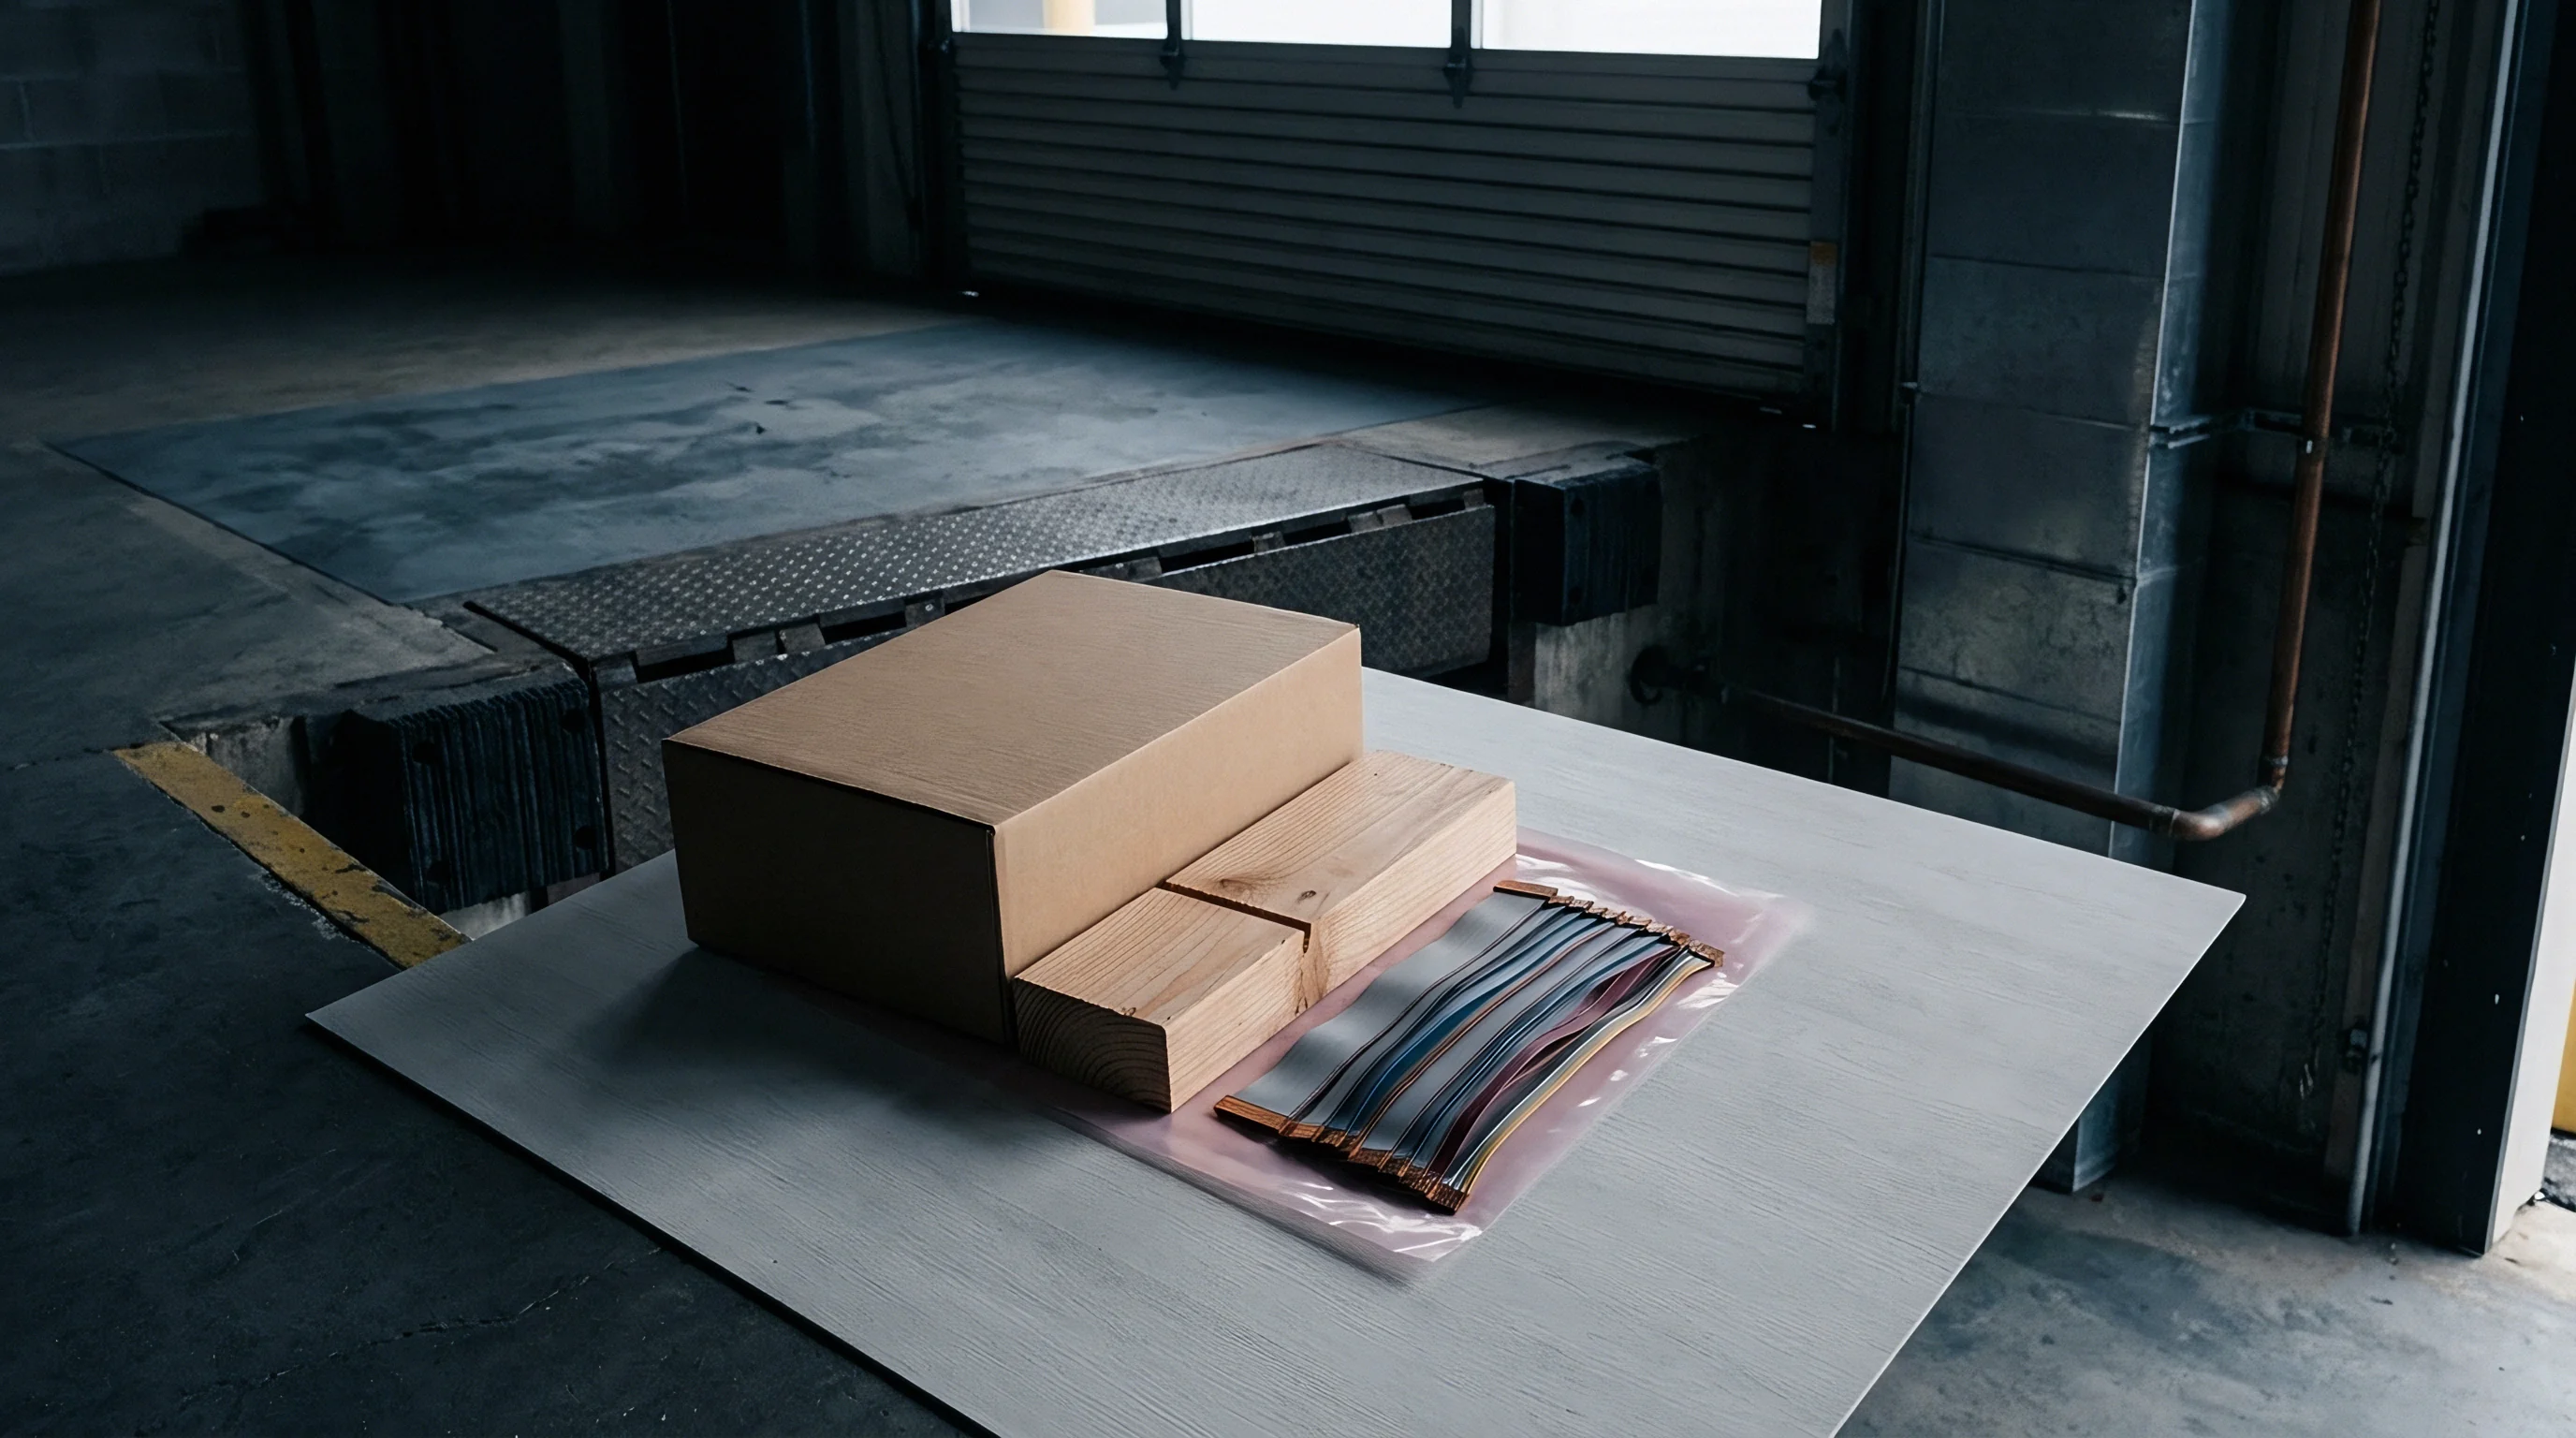
Cyclic Plasticity and Kinematic Parameter Identification
Reversed loading experiments reveal back-stress development within the metallic matrix as solder joints and leadframe alloys in power modules undergo cyclic tension-compression during operation. Isotropic hardening formulations expand the yield surface uniformly, which fails to capture the Bauschinger effect during directional load reversals. Chaboche kinematic hardening models address this by incorporating non-linear back-stress evolution terms to track the displacement of the yield surface center in stress space.
Extracting Chaboche parameters requires symmetric, strain-controlled cyclic tests at operational temperatures. Single-frequency strain loops supply kinematic constants via non-linear regression on stable hysteresis curves, where multiple back-stress terms capture both early non-linear yield and long-term strain hardening response.
- Apply symmetric axial strain cycling at a constant strain rate of 10⁻³ s⁻¹ until stress amplitude stabilizes across consecutive hysteresis loops.
- Isolate a stable mid-life stress-strain hysteresis loop to eliminate transient cyclic softening or hardening background effects.
- Subtract the elastic strain contribution using high-precision unloading slope data measured at peak strain limits.
- Plot plastic stress shift against plastic strain accumulation from the onset of yield during the load reversal phase.
- Execute non-linear regression to fit two-term or three-term Chaboche parameters C₁ through C₃ and gamma₁ through gamma₃.

Strain-Rate Sensitivity and Multi-Axial Decomposition
Deformation responses vary significantly across four orders of loading velocity, as packaging alloys operate near high homologous temperatures where plastic flow depends on instantaneous strain rate. Slow thermal cycling induces time-dependent creep relaxation, whereas mechanical shock pushes the material into high-strain-rate plastic regimes. Combining rate-independent plasticity equations with rate-dependent viscoplastic formulations prevents analytical divergence across these operational extremes.
Uniaxial testing masks complex multiaxial behavior. Under thermal expansion mismatches between substrate and silicon die, interconnect solder spheres experience combined shear, axial compression, and torsional loading. Transforming uniaxial Chaboche parameters into von Mises equivalent stress space assumes plastic isotropy ~ an assumption that breaks down in highly textured solder microstructures.
Testing parameters extracted under pure uniaxial tension underestimate the cyclic softening rates observed during low-cycle shear fatigue.
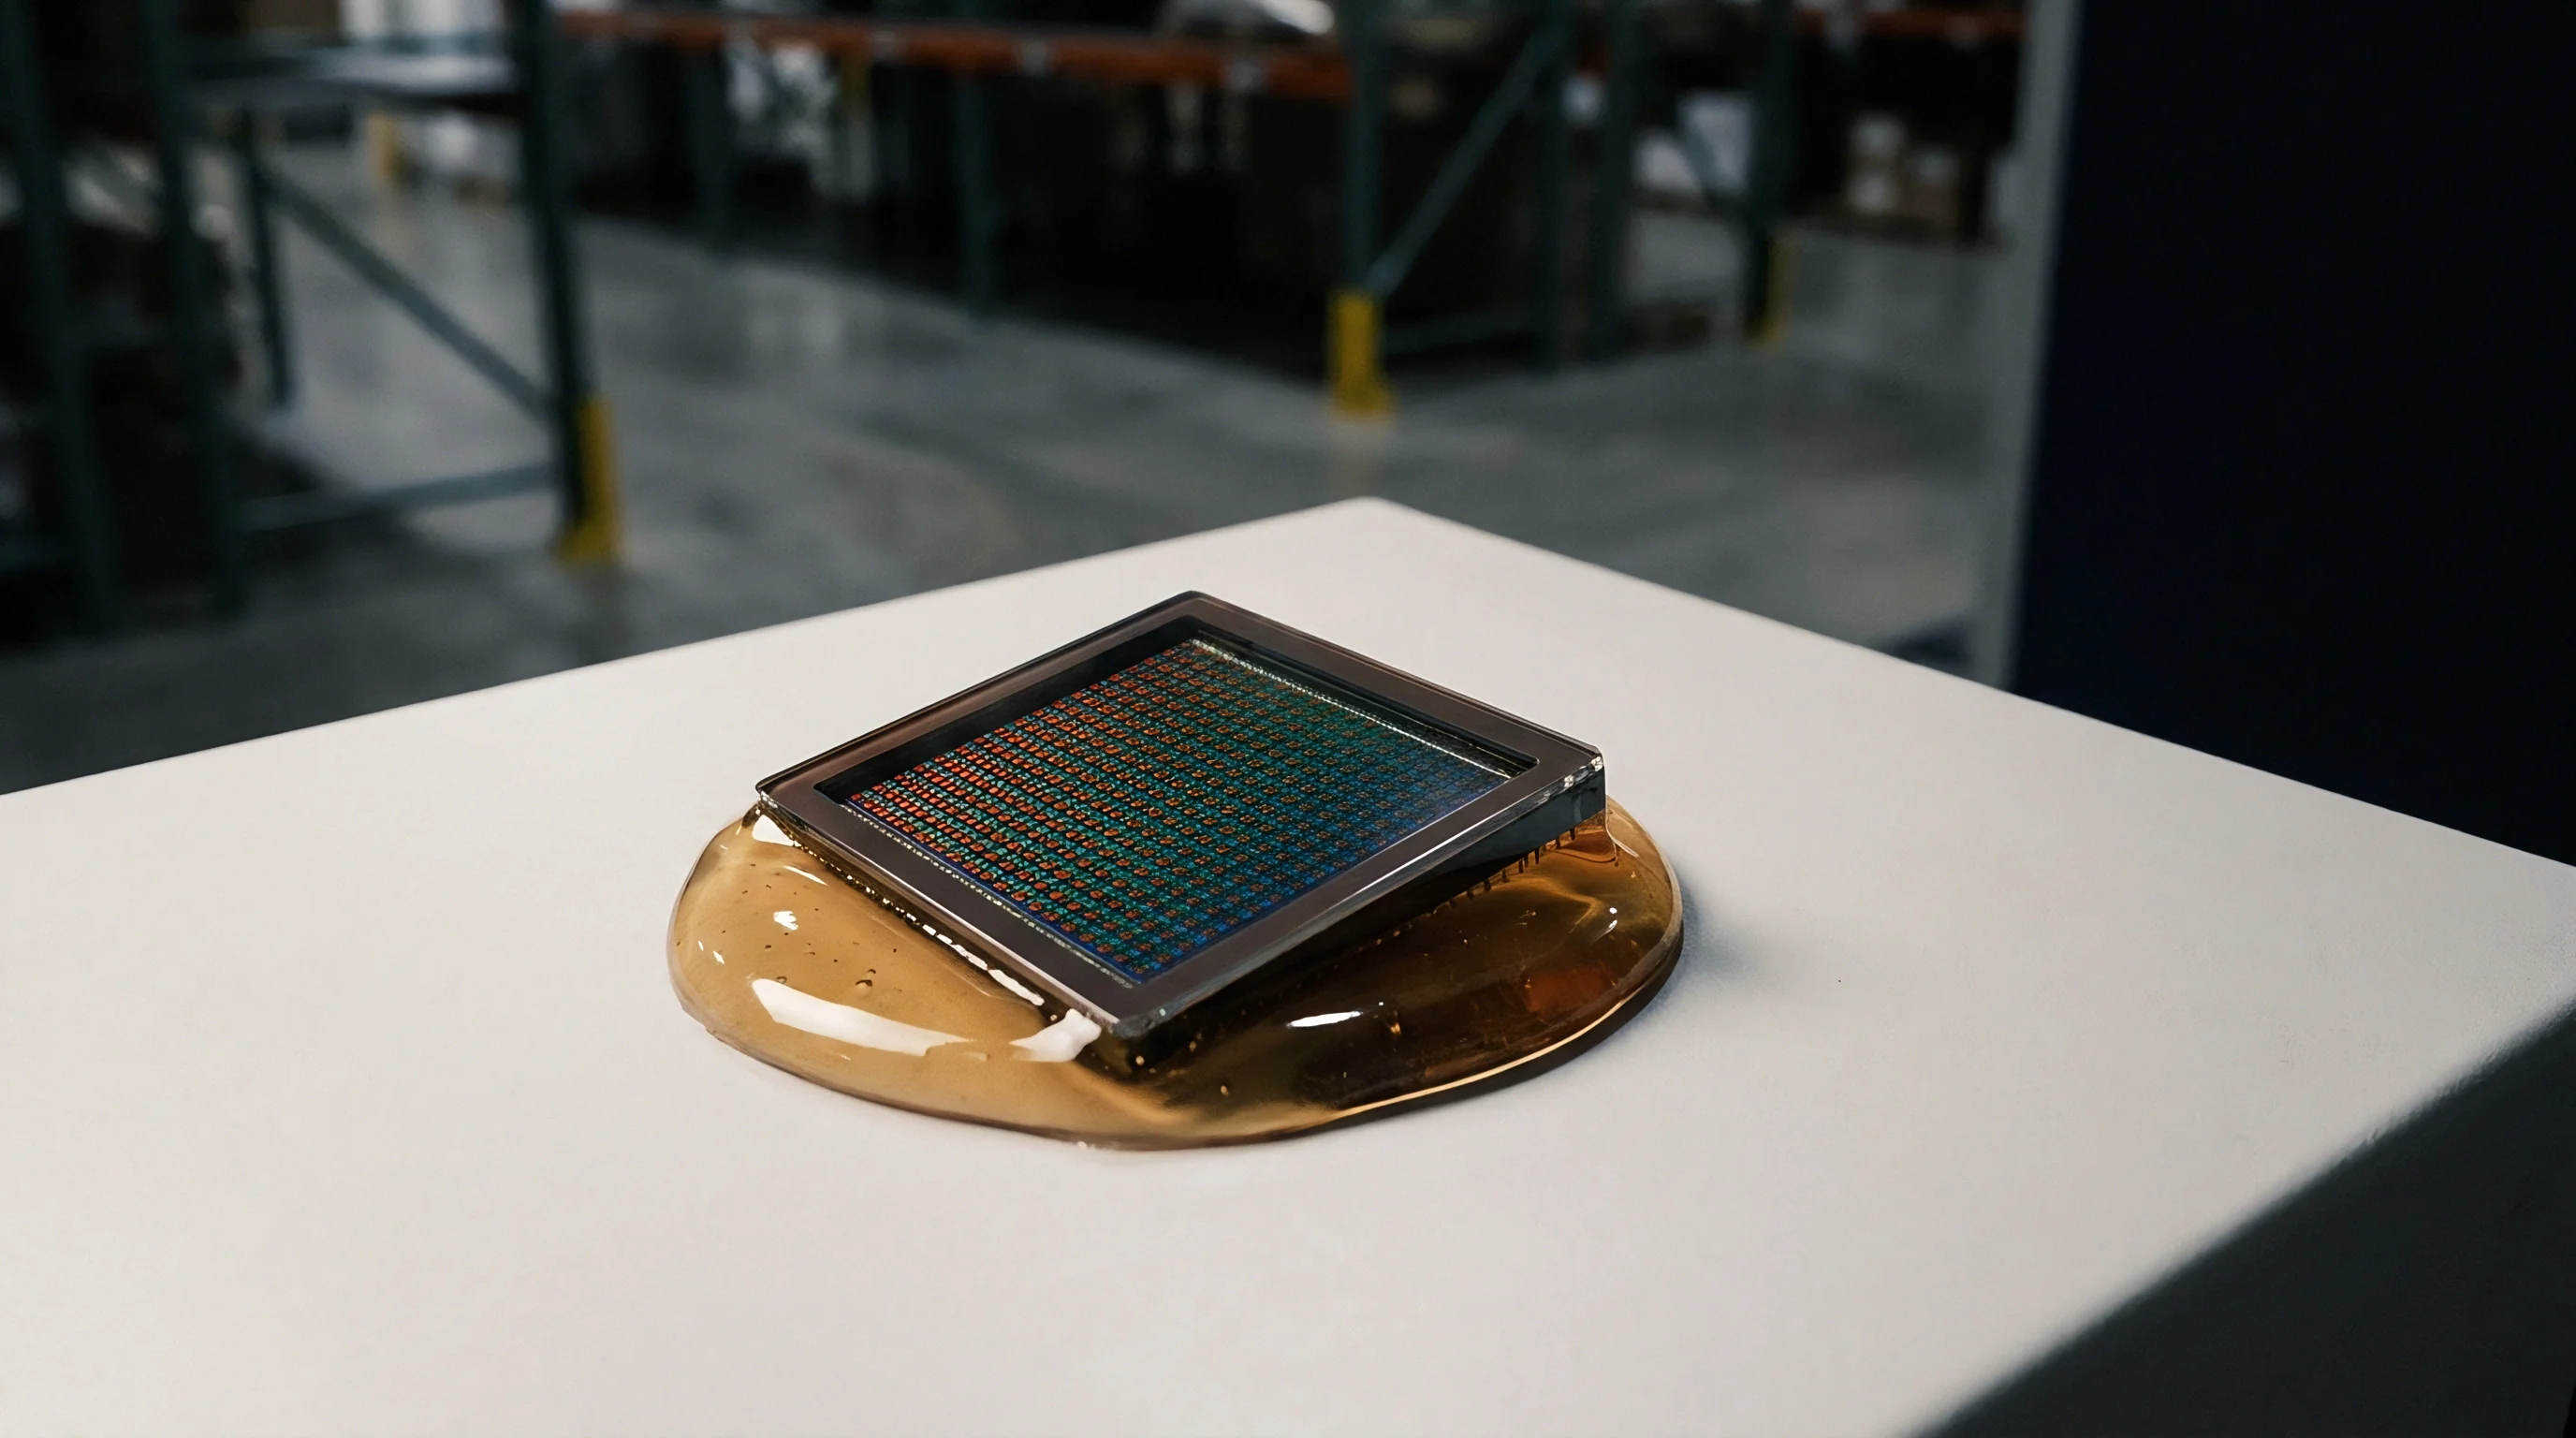

Arrhenius
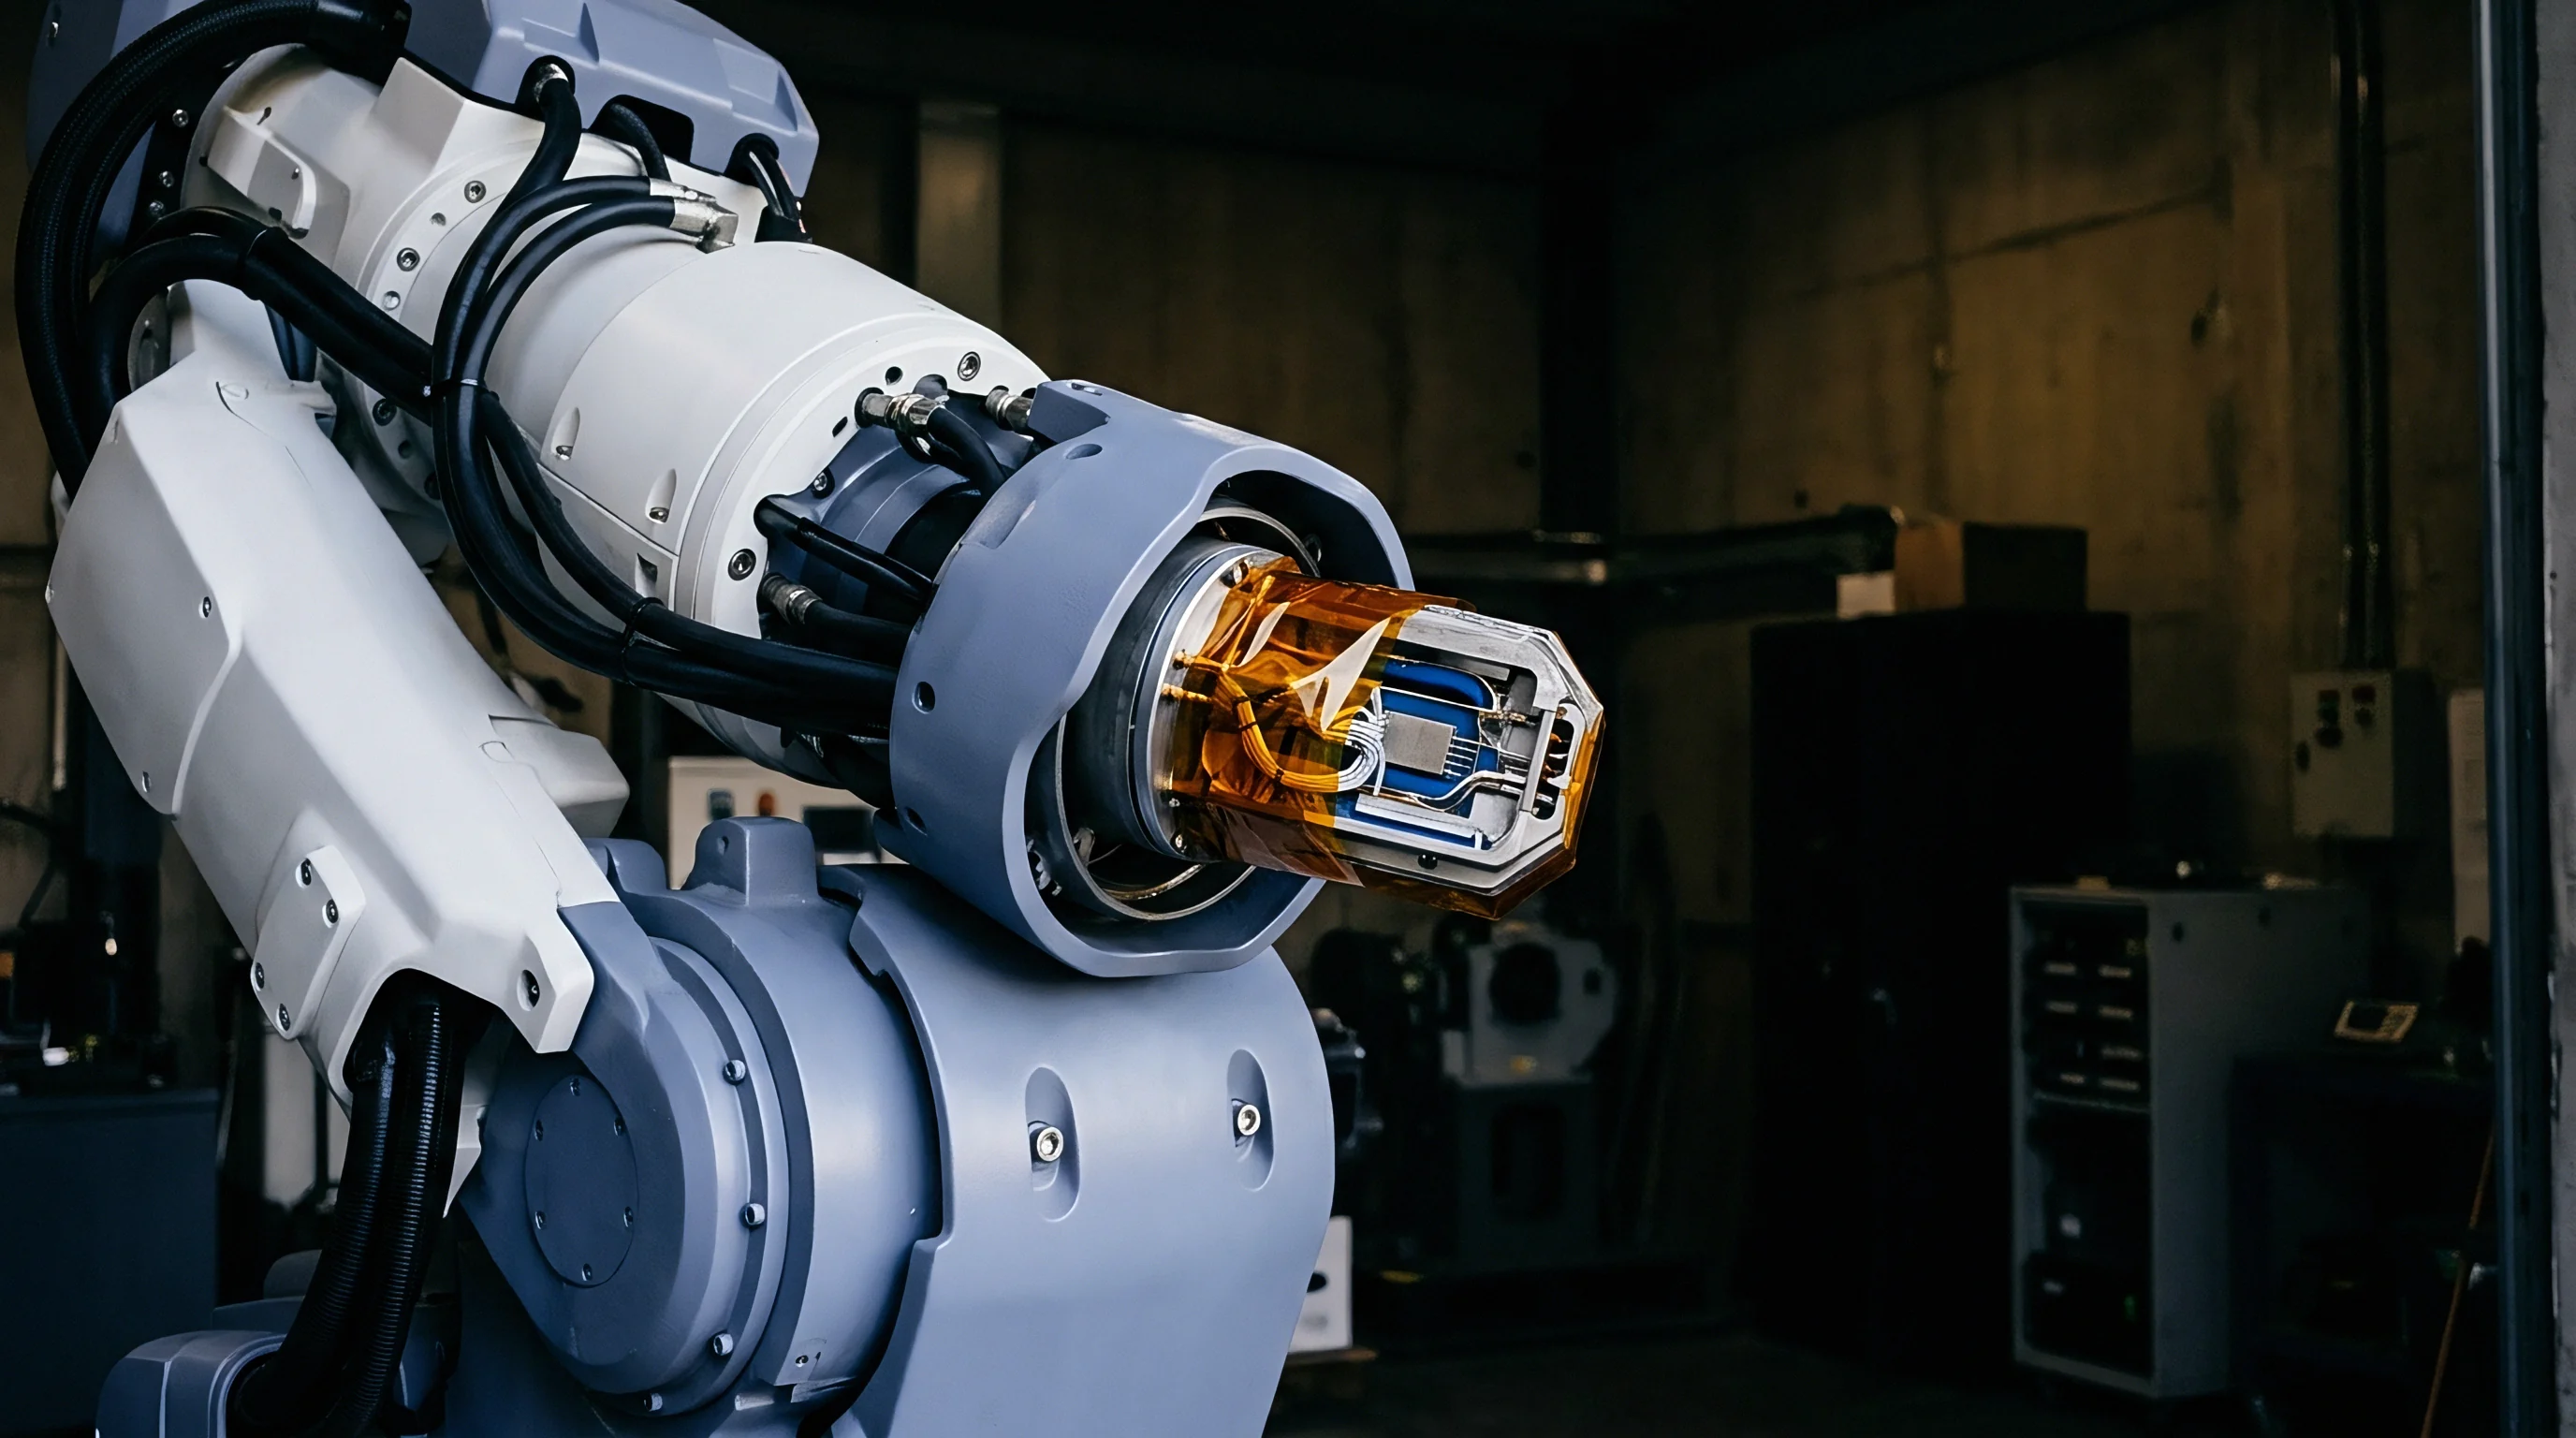
Can Anand Model Parameters Capture High Temperature Stress Decay?
Viscoplastic formulations represent rate-dependent behavior across broad temperature swings without requiring explicit yield surface definitions. The unified Anand constitutive model relies on a single internal state variable representing isotropic resistance to plastic flow. Nine material parameters govern the deformation response: A (pre-exponential factor), Q/R (activation energy divided by gas constant), xi (stress multiplier), m (strain rate sensitivity exponent), s_bar (saturation value of deformation resistance), h_0 (hardening/softening constant), a (strain rate sensitivity of hardening), s_hat (coefficient for deformation resistance saturation limit), and n (deformation resistance sensitivity exponent).
Determining these nine constants requires systematically varied isothermal tensile and strain-rate jump experiments across temperatures from minus 40 degrees Celsius to 150 degrees Celsius, matching typical automotive and aerospace rating envelopes. Strain rates span 10⁻⁵ s⁻¹ to 10⁻² s⁻¹. Fitting nine variables simultaneously to a single stress-strain curve risks non-unique numerical solutions, where multiple distinct parameter combinations match the experimental data with identical regression scores.

Thermal Activation and Viscoplastic Parameter Derivation
Steady-state creep rates follow an exponential relation driven by lattice diffusion energies. Plotting the natural logarithm of the steady-state plastic strain rate against inverse absolute temperature yields a slope proportional to thermal activation energy Q. For lead-free SAC305 alloy (96.5% Tin, 3.0% Silver, 0.5% Copper), activation energy transitions near 100 degrees Celsius, reflecting a shift from matrix dislocation pipe diffusion to bulk lattice self-diffusion, while room-temperature creep dominates stress decay below that threshold.
Step-by-step extraction begins with steady-state saturation stress values measured across varied strain rates and temperatures, as illustrated by benchmark data for SAC305 packaging solder:
At temperature T₁ = 298 Kelvin (25 °C) and strain rate epsilon_dot₁ = 10⁻⁴ s⁻¹, saturation stress sigma_sat₁ is measured at 42.0 MPa. Increasing the strain rate to epsilon_dot₂ = 10⁻² s⁻¹ at T₁ raises saturation stress sigma_sat₂ to 68.5 MPa.
At an elevated temperature T₂ = 398 Kelvin (125 °C) and strain rate epsilon_dot₁ = 10⁻⁴ s⁻¹, saturation stress sigma_sat₃ drops to 14.2 MPa. Raising the strain rate to epsilon_dot₂ = 10⁻² s⁻¹ at T₂ brings saturation stress sigma_sat₄ back up to 29.8 MPa.
Using the Anand stress equation at steady state, where the hardening rate equals zero:
sigma_sat = (s_hat / xi) sinh⁻¹
Evaluating inverse hyperbolic sine relations across two temperatures isolates the activation term Q/R. Assuming a stress multiplier xi = 1.0 based on standard lead-free alloy baseline calibrations, the ratio of inverse sinh values at constant strain rate yields Q = 54.3 kJ/mol in the low-temperature regime and Q = 98.6 kJ/mol above 100 degrees Celsius.
Adherence to ASTM E139 creep testing guidelines prevents thermal drift from corrupting steady-state stress decay curves.
Parameter extraction algorithms that ignore activation energy shifts across temperature regimes introduce systematic errors into lifetime prediction models. Similarly, experimental artifacts corrupt fitting routines if thermal expansion of the test frame is not subtracted from raw displacement curves.
- Thermal Frame Expansion ~ Uncompensated thermal growth of loading grips during temperature ramps introduces artificial compressive strain offsets into stress-strain datasets.
- Grip Slip Trajectory ~ Friction-based coupon clamping allows microscopic axial slippage during load reversal, artificially inflating measured plastic strain range.
- Temperature Overshoot ~ Uncontrolled oven heating during micro-foil testing alters precipitate morphology prior to mechanical test initialization.
- Transducer Drift ~ Uncalibrated strain gauge bridge circuits experience thermal zero-point wander across multi-hour creep holds.
Constitutive parameters extracted from bulk ingot specimens are often assumed to remain valid for micro-scale solder joints on the grounds of identical chemical composition.

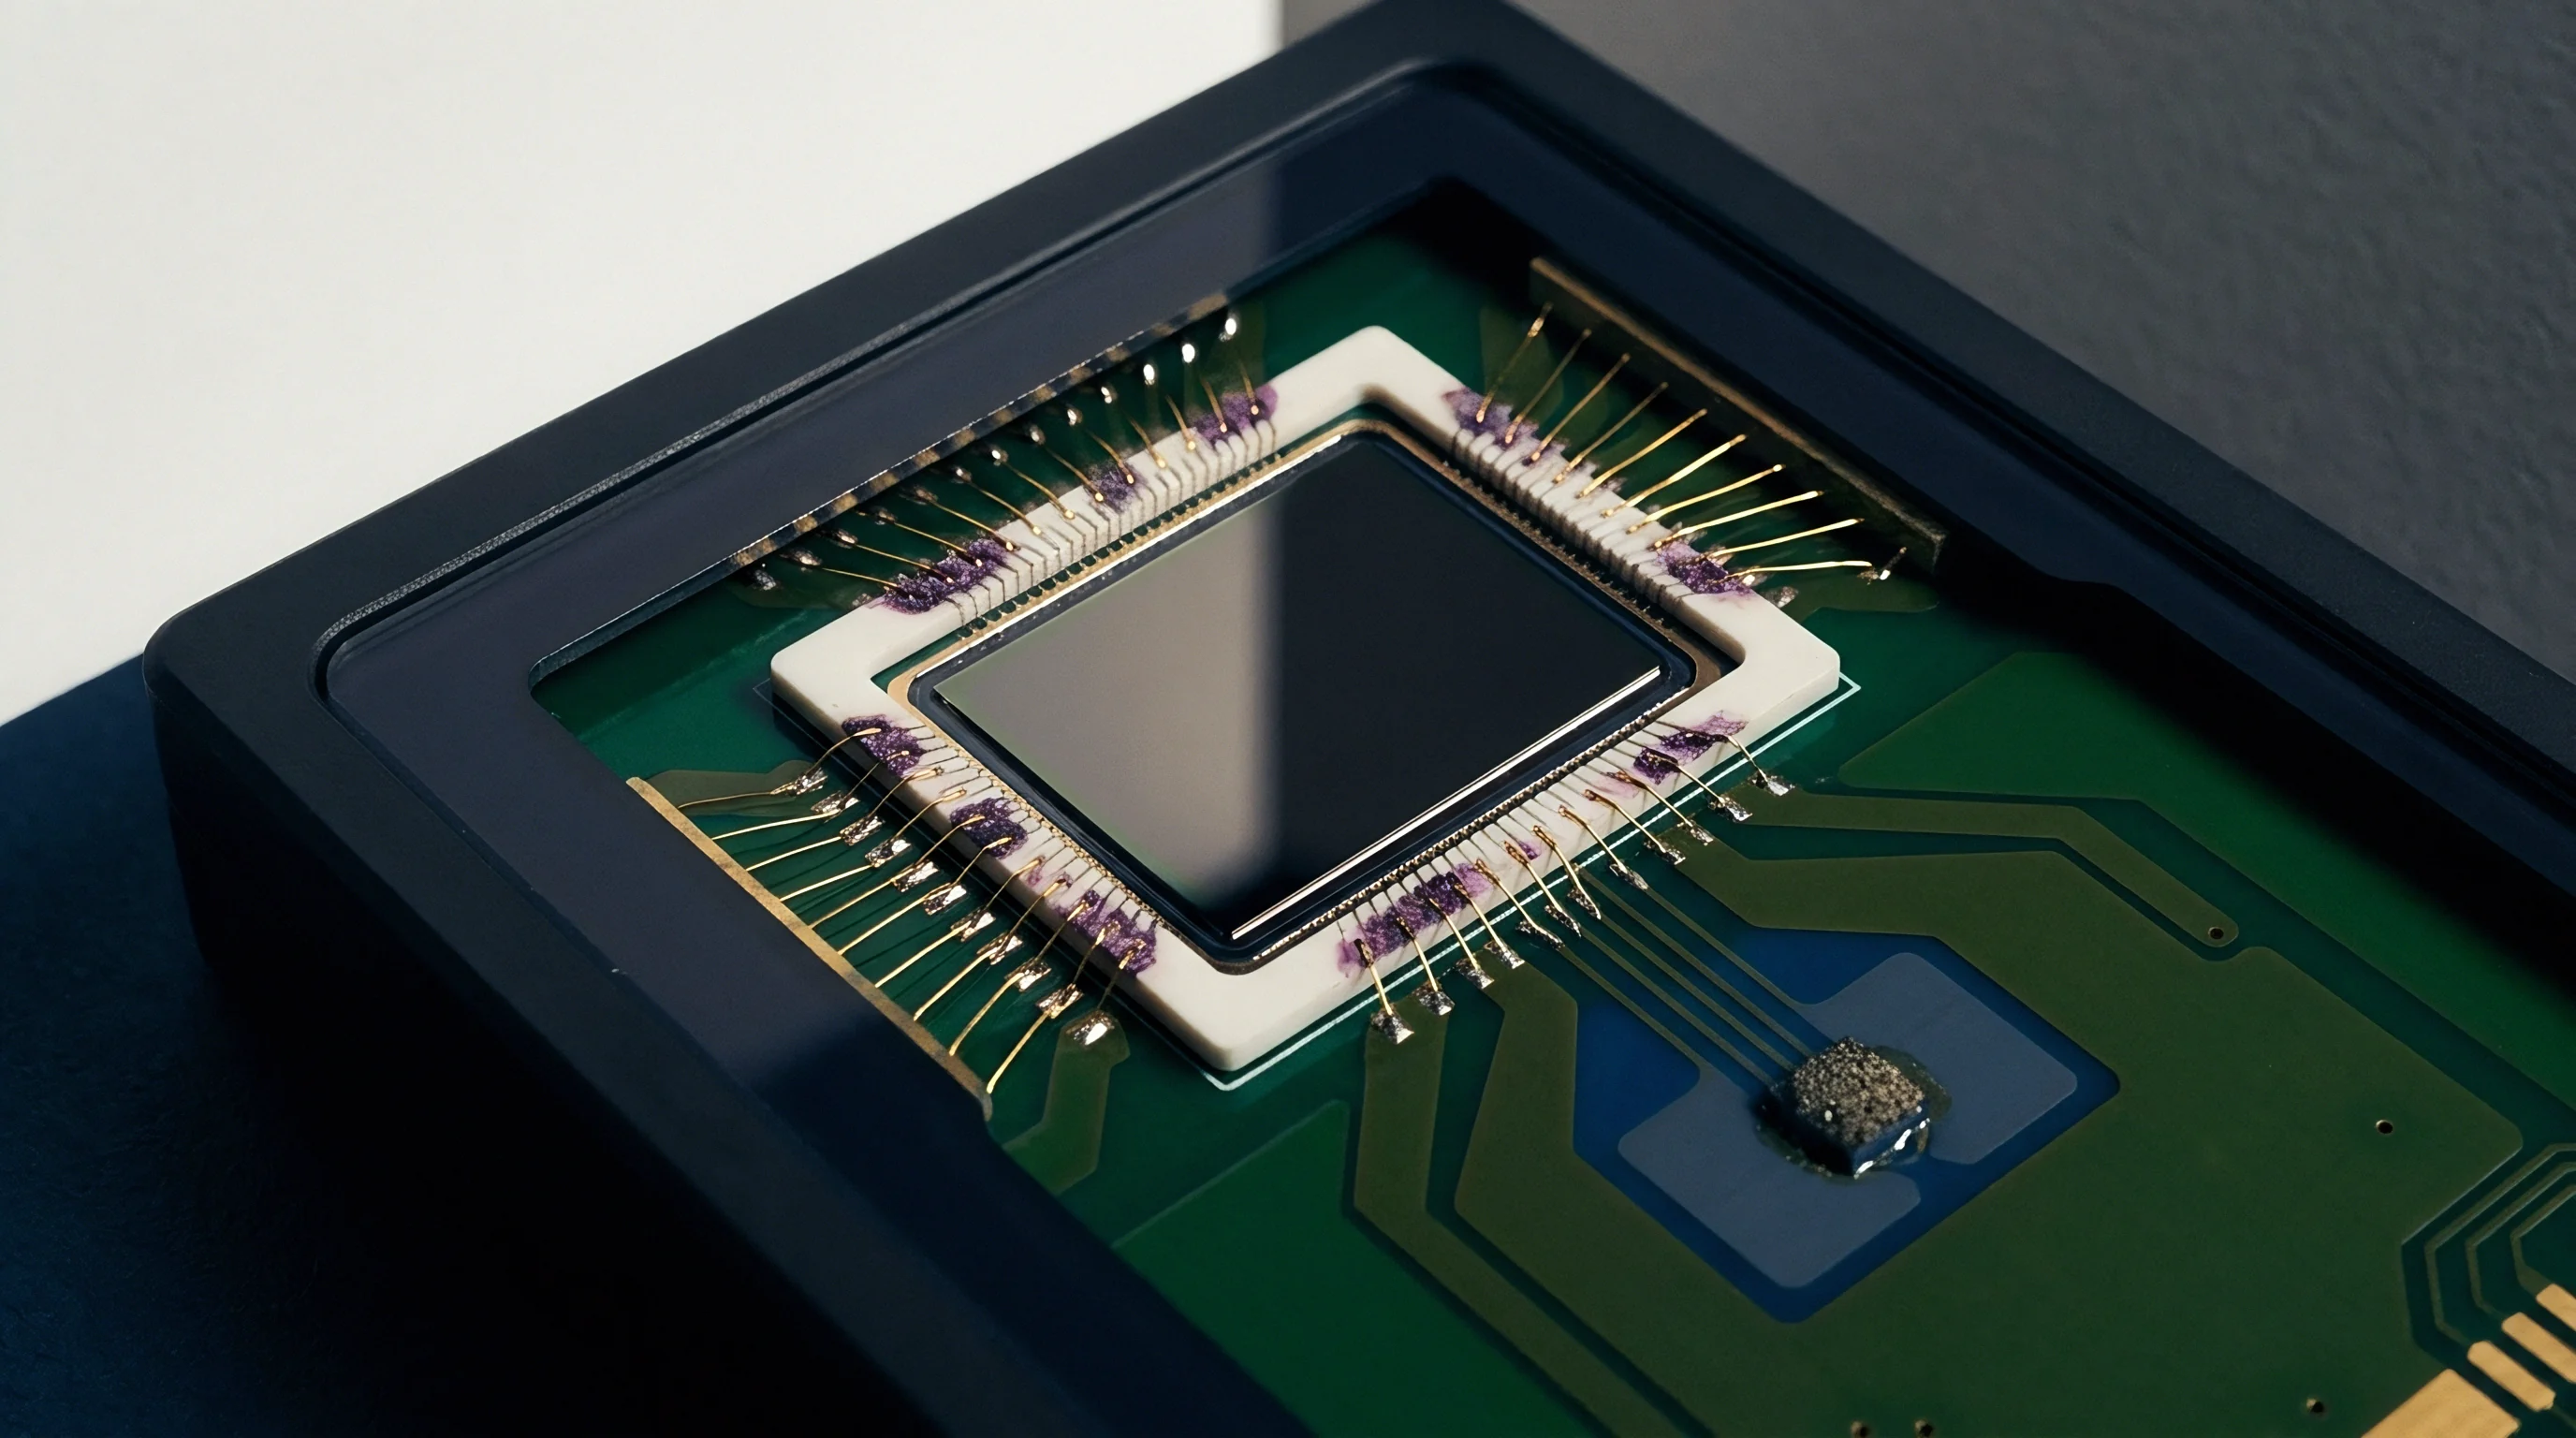
Solder
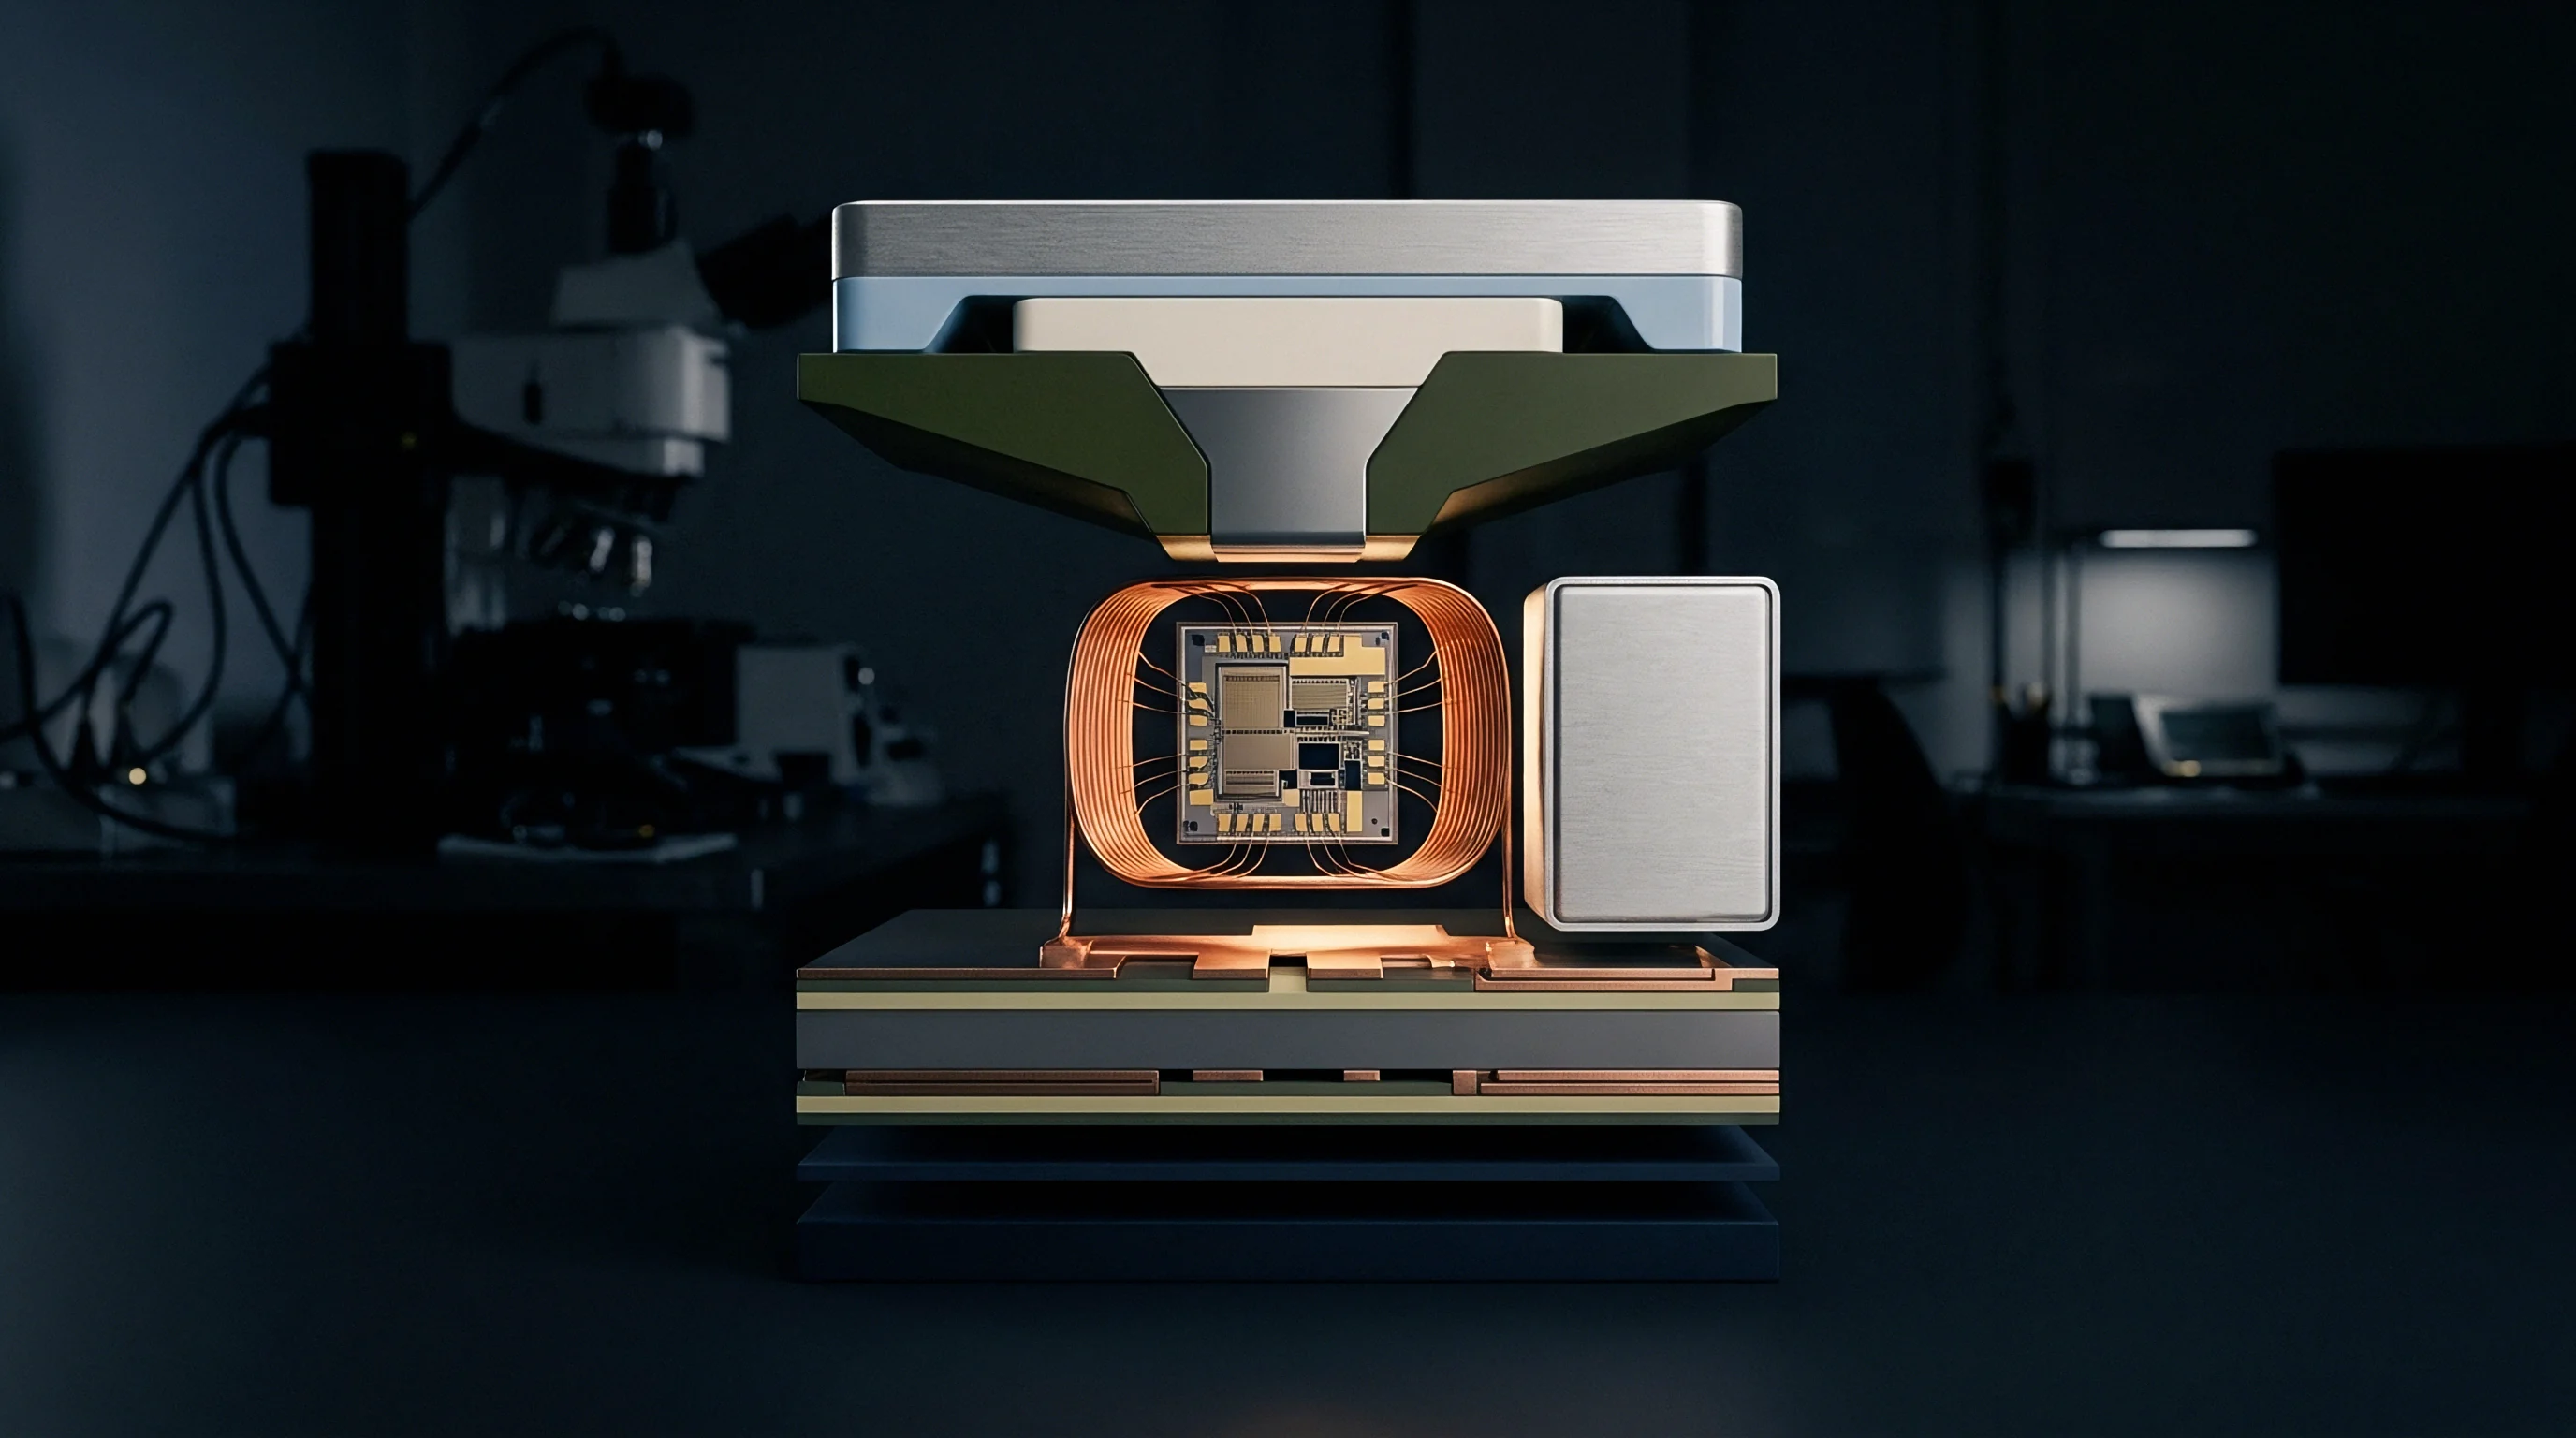
Microstructural Evolution in Lead-Free Packaging Interconnects
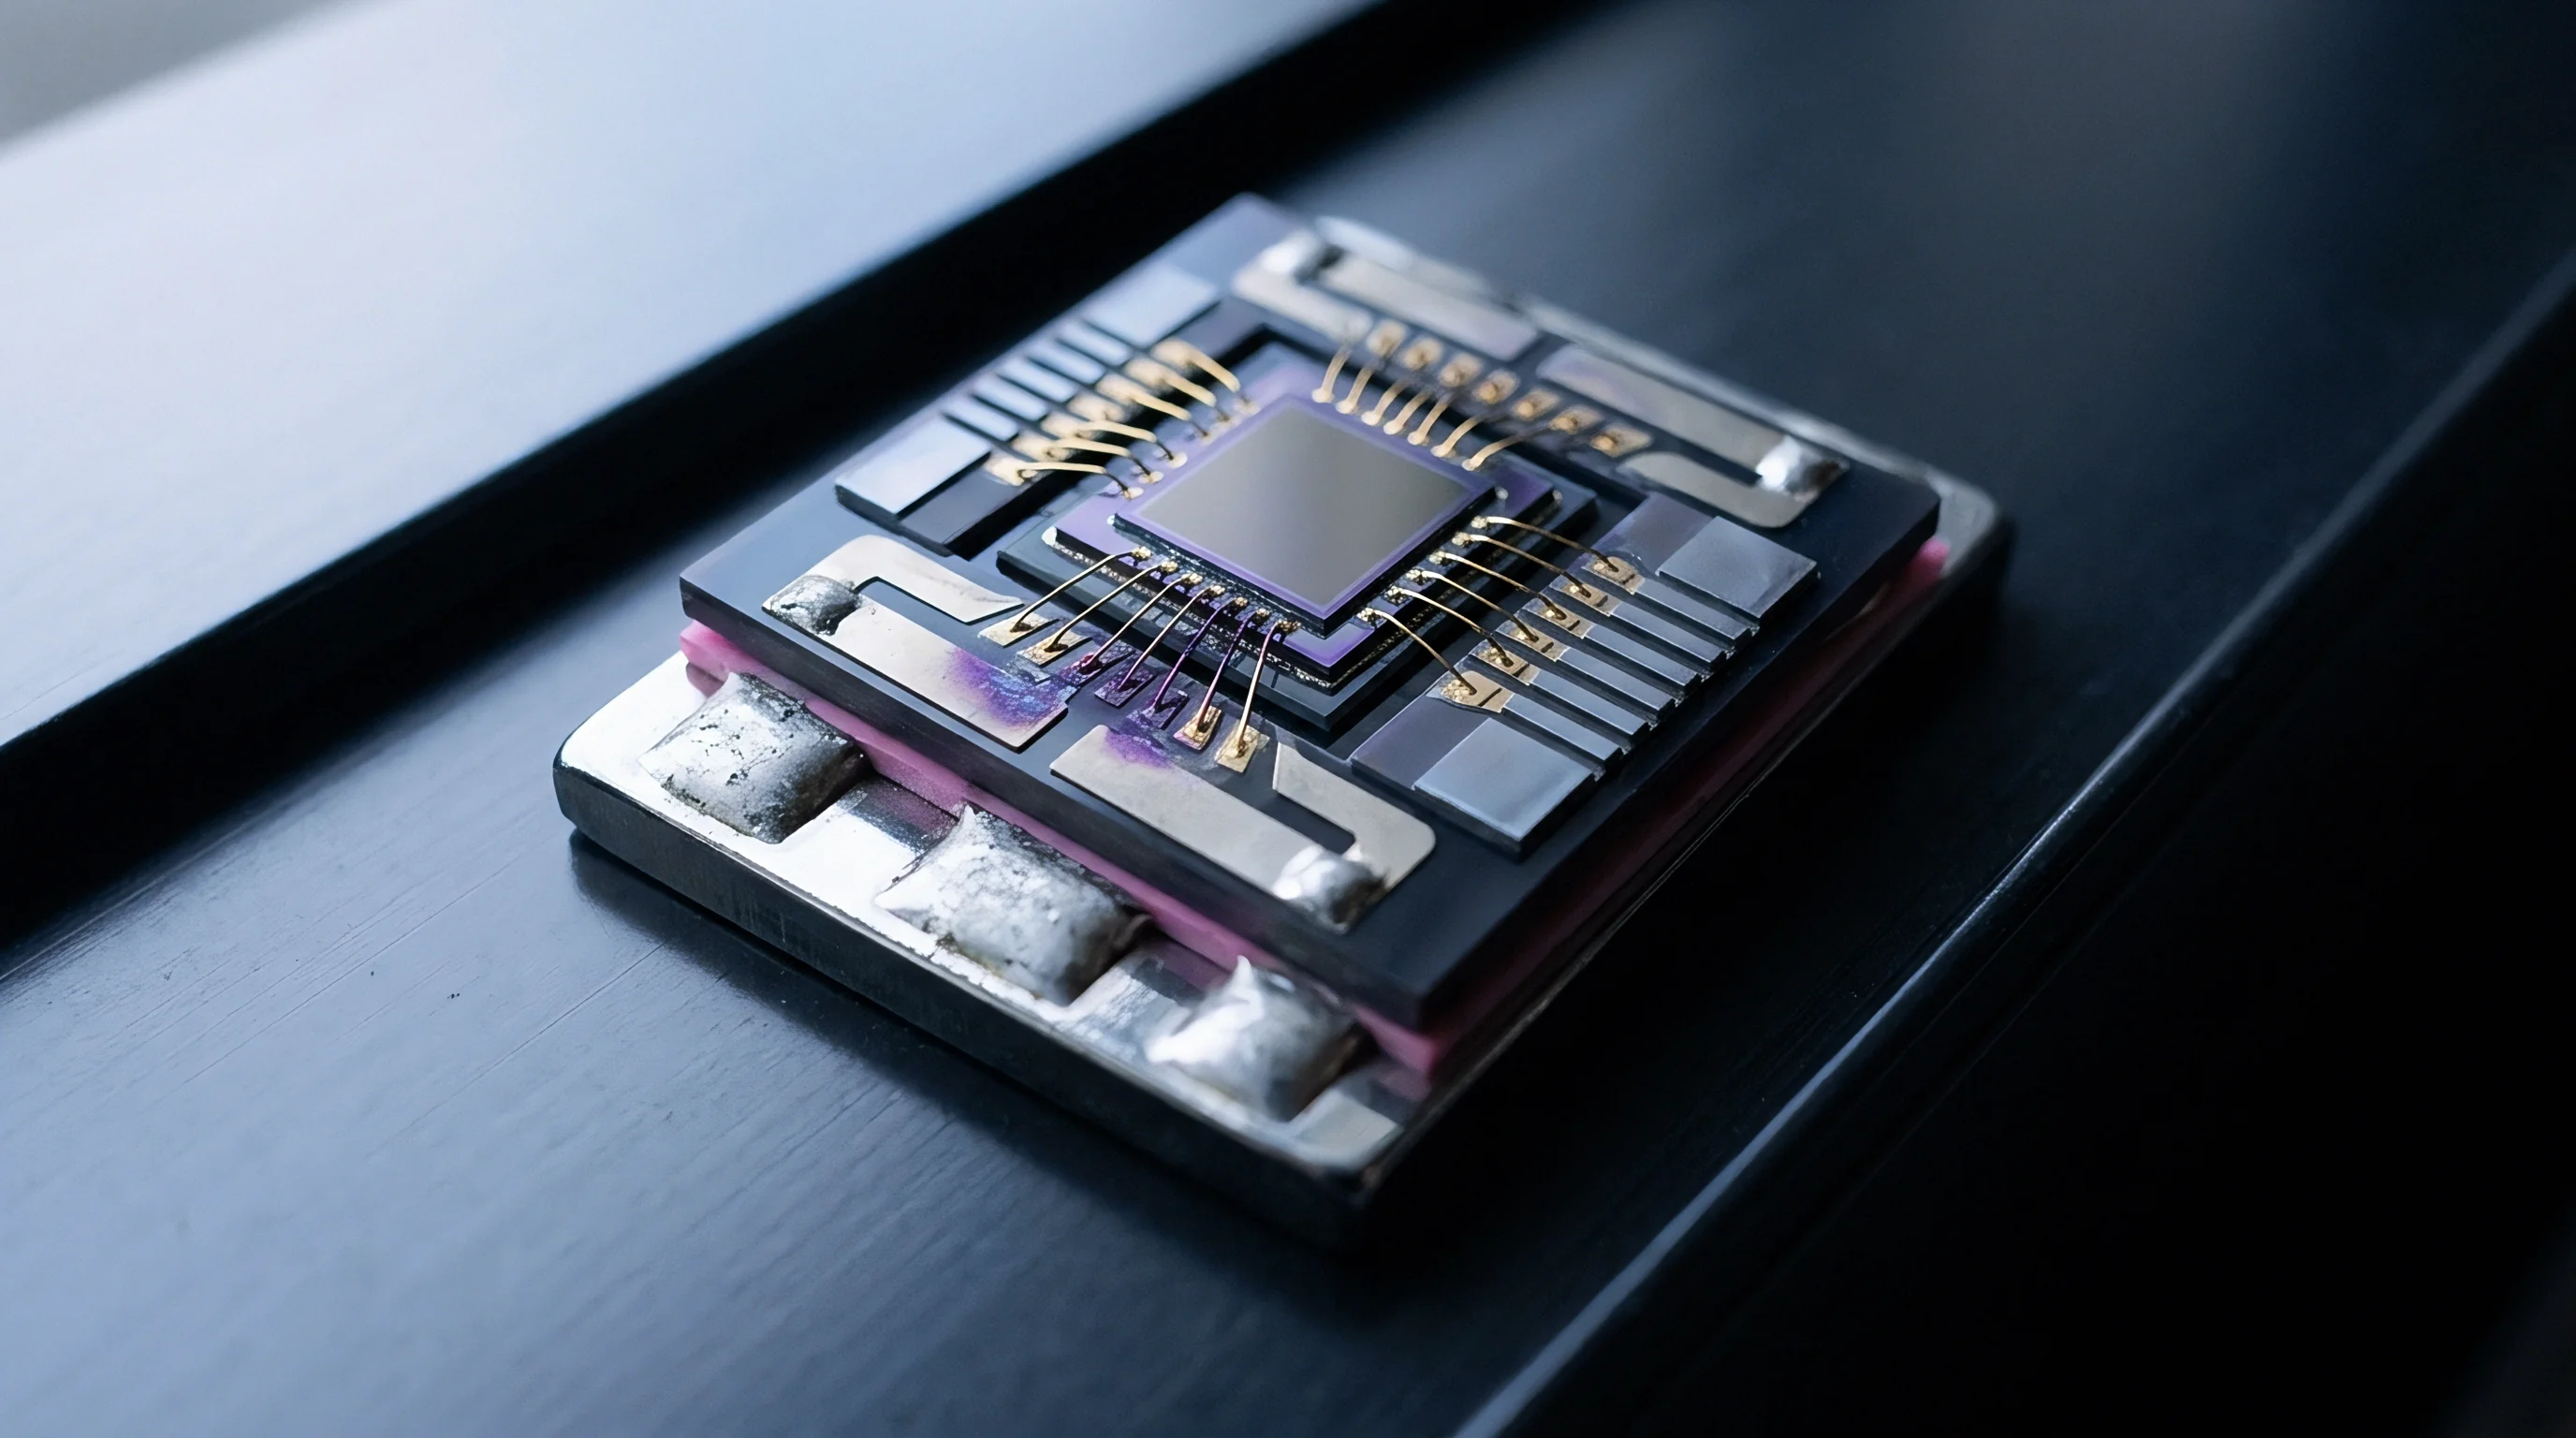
Lead-free interconnect alloys undergo rapid microstructural coarsening under ambient and elevated operational temperatures. As-cast SAC305 microstructures display fine eutectic regions surrounding primary beta-tin dendrites. Isothermal storage at 125 degrees Celsius drives intermetallic particle coarsening ~ specifically of Cu₃Sn and Ag₃Sn within eutectic channels ~ which increases mean inter-particle spacing, lowers resistance to dislocation glide, and cuts yield strength by 20 to 40 percent over 1,000 thermal cycles.
Thermal history dictates initial grain size. Microelectronics interconnects often contain only a few tin grains per joint, giving rise to strongly orientation-dependent elastic and plastic anisotropy. As a result, single-grain solder spheres deform asymmetric under thermal cycling owing to the anisotropic coefficient of thermal expansion along the body-centered tetragonal c-axis of tin, which also undergoes allotropic phase transformations.
Aging Effects on Viscoplastic Response
Isothermal holds at elevated temperatures reduce initial flow stress by altering precipitate spacing, meaning constitutive models derived from freshly cast coupons fail to reflect the flow behavior of joints aged in service. Even 24 hours of room-temperature storage alters yield stress compared to immediate testing. Parameter extraction routines must therefore track room-temperature storage duration or incorporate explicit aging damage terms into their yield and hardening equations.
A comprehensive material card evaluation requires a systematic audit of testing parameters before committing constitutive constants to production finite element solvers.
- Specimen History Audit ~ Verify sample thermal history, solidification cooling rate, and post-cast aging duration prior to mechanical property extraction.
- Strain Rate Range Validation ~ Confirm testing strain rates span actual strain rates calculated in package thermal-mechanical FEA simulations.
- Temperature Bounds Verification ~ Ensure constitutive curve fitting covers lowest storage temperature and peak reflow or operational junction temperatures.
- Multi-Axial Correlation Check ~ Cross-check uniaxial model prediction accuracy against independent torsional or shear lap-joint experimental results.
| Alloy System | Anand A (s⁻¹) | Q/R (K) | Anand m | Chaboche C₁ (MPa) | Dominant Creep Mechanism |
|---|---|---|---|---|---|
| SAC305 (As-Cast) | 4.0e6 | 9,900 | 0.232 | 12,400 | Dislocation Pipe Diffusion |
| SAC305 (Aged 1000h 125°C) | 1.2e6 | 8,700 | 0.195 | 7,800 | Lattice Self-Diffusion |
| Au80Sn20 Eutectic | 8.5e8 | 14,200 | 0.085 | 45,000 | Grain Boundary Sliding |
| High-Lead Pb92.5Sn5Ag2.5 | 1.1e5 | 7,400 | 0.310 | 4,200 | Coble Diffusional Creep |
| Sintered Copper (92% Dense) | 3.2e7 | 18,500 | 0.112 | 68,000 | Dislocation Climb |
In accordance with ASTM E21 high-temperature tension test standards, reported yield strength figures must include verified thermal equilibration times to prevent un-aged microstructural states from corrupting parameter datasets.

Convergence

Non-Linear Fitting Algorithms and Material Card Validation
Least-squares error minimization requires robust starting points to avoid converging on local minima. Objective functions calculate the squared residual difference between experimental stress response and model output across all strain-temperature points. Non-linear optimization algorithms like Levenberg-Marquardt or genetic routines rely on parameter space bounds grounded in physical metal behavior; unbounded mathematical fits tend to yield negative hardening constants or unphysical activation energies that trigger solver divergence during implicit finite element iterations.
Fit errors propagate directly into lifetime predictions. Weighting objective functions toward low strain rates ensures accurate steady-state creep modeling during extended thermal dwell periods, whereas unweighted fits over-emphasize high-strain-rate plastic deformation and skew stress relaxation rates during microelectronics dwell cycles.

Finite Element Verification against Physical Micro-Joint Failure
Simulation models incorporating extracted flow parameters predict warpage profiles and localized stress concentration. Validating constitutive material cards requires comparing predicted package deformation against moiré interferometry or digital image correlation measurements taken on physical microelectronics assemblies during thermal cycling. Single-element verification confirms correct parameter implementation within FEA solver libraries prior to full assembly runs, ensuring secondary creep rates properly inform thermal fatigue estimates.
Parameter extraction performed on cast ingots rather than micro-scale packaging forms understates cyclic stress relaxation rate.
How do subtle differences in extracted hardening exponents alter predicted package thermal fatigue life when local multiaxial strain states exceed experimental calibration bounds?