Quantifying Electrochemical Sensor Drift Acceleration under Long Term River Deployments
Quantifying electrochemical sensor drift in rivers requires evaluating reference electrolyte diffusion kinetics, thermal hysteresis, and bio-film boundary layers to optimize field recalibration cycles.
Junction
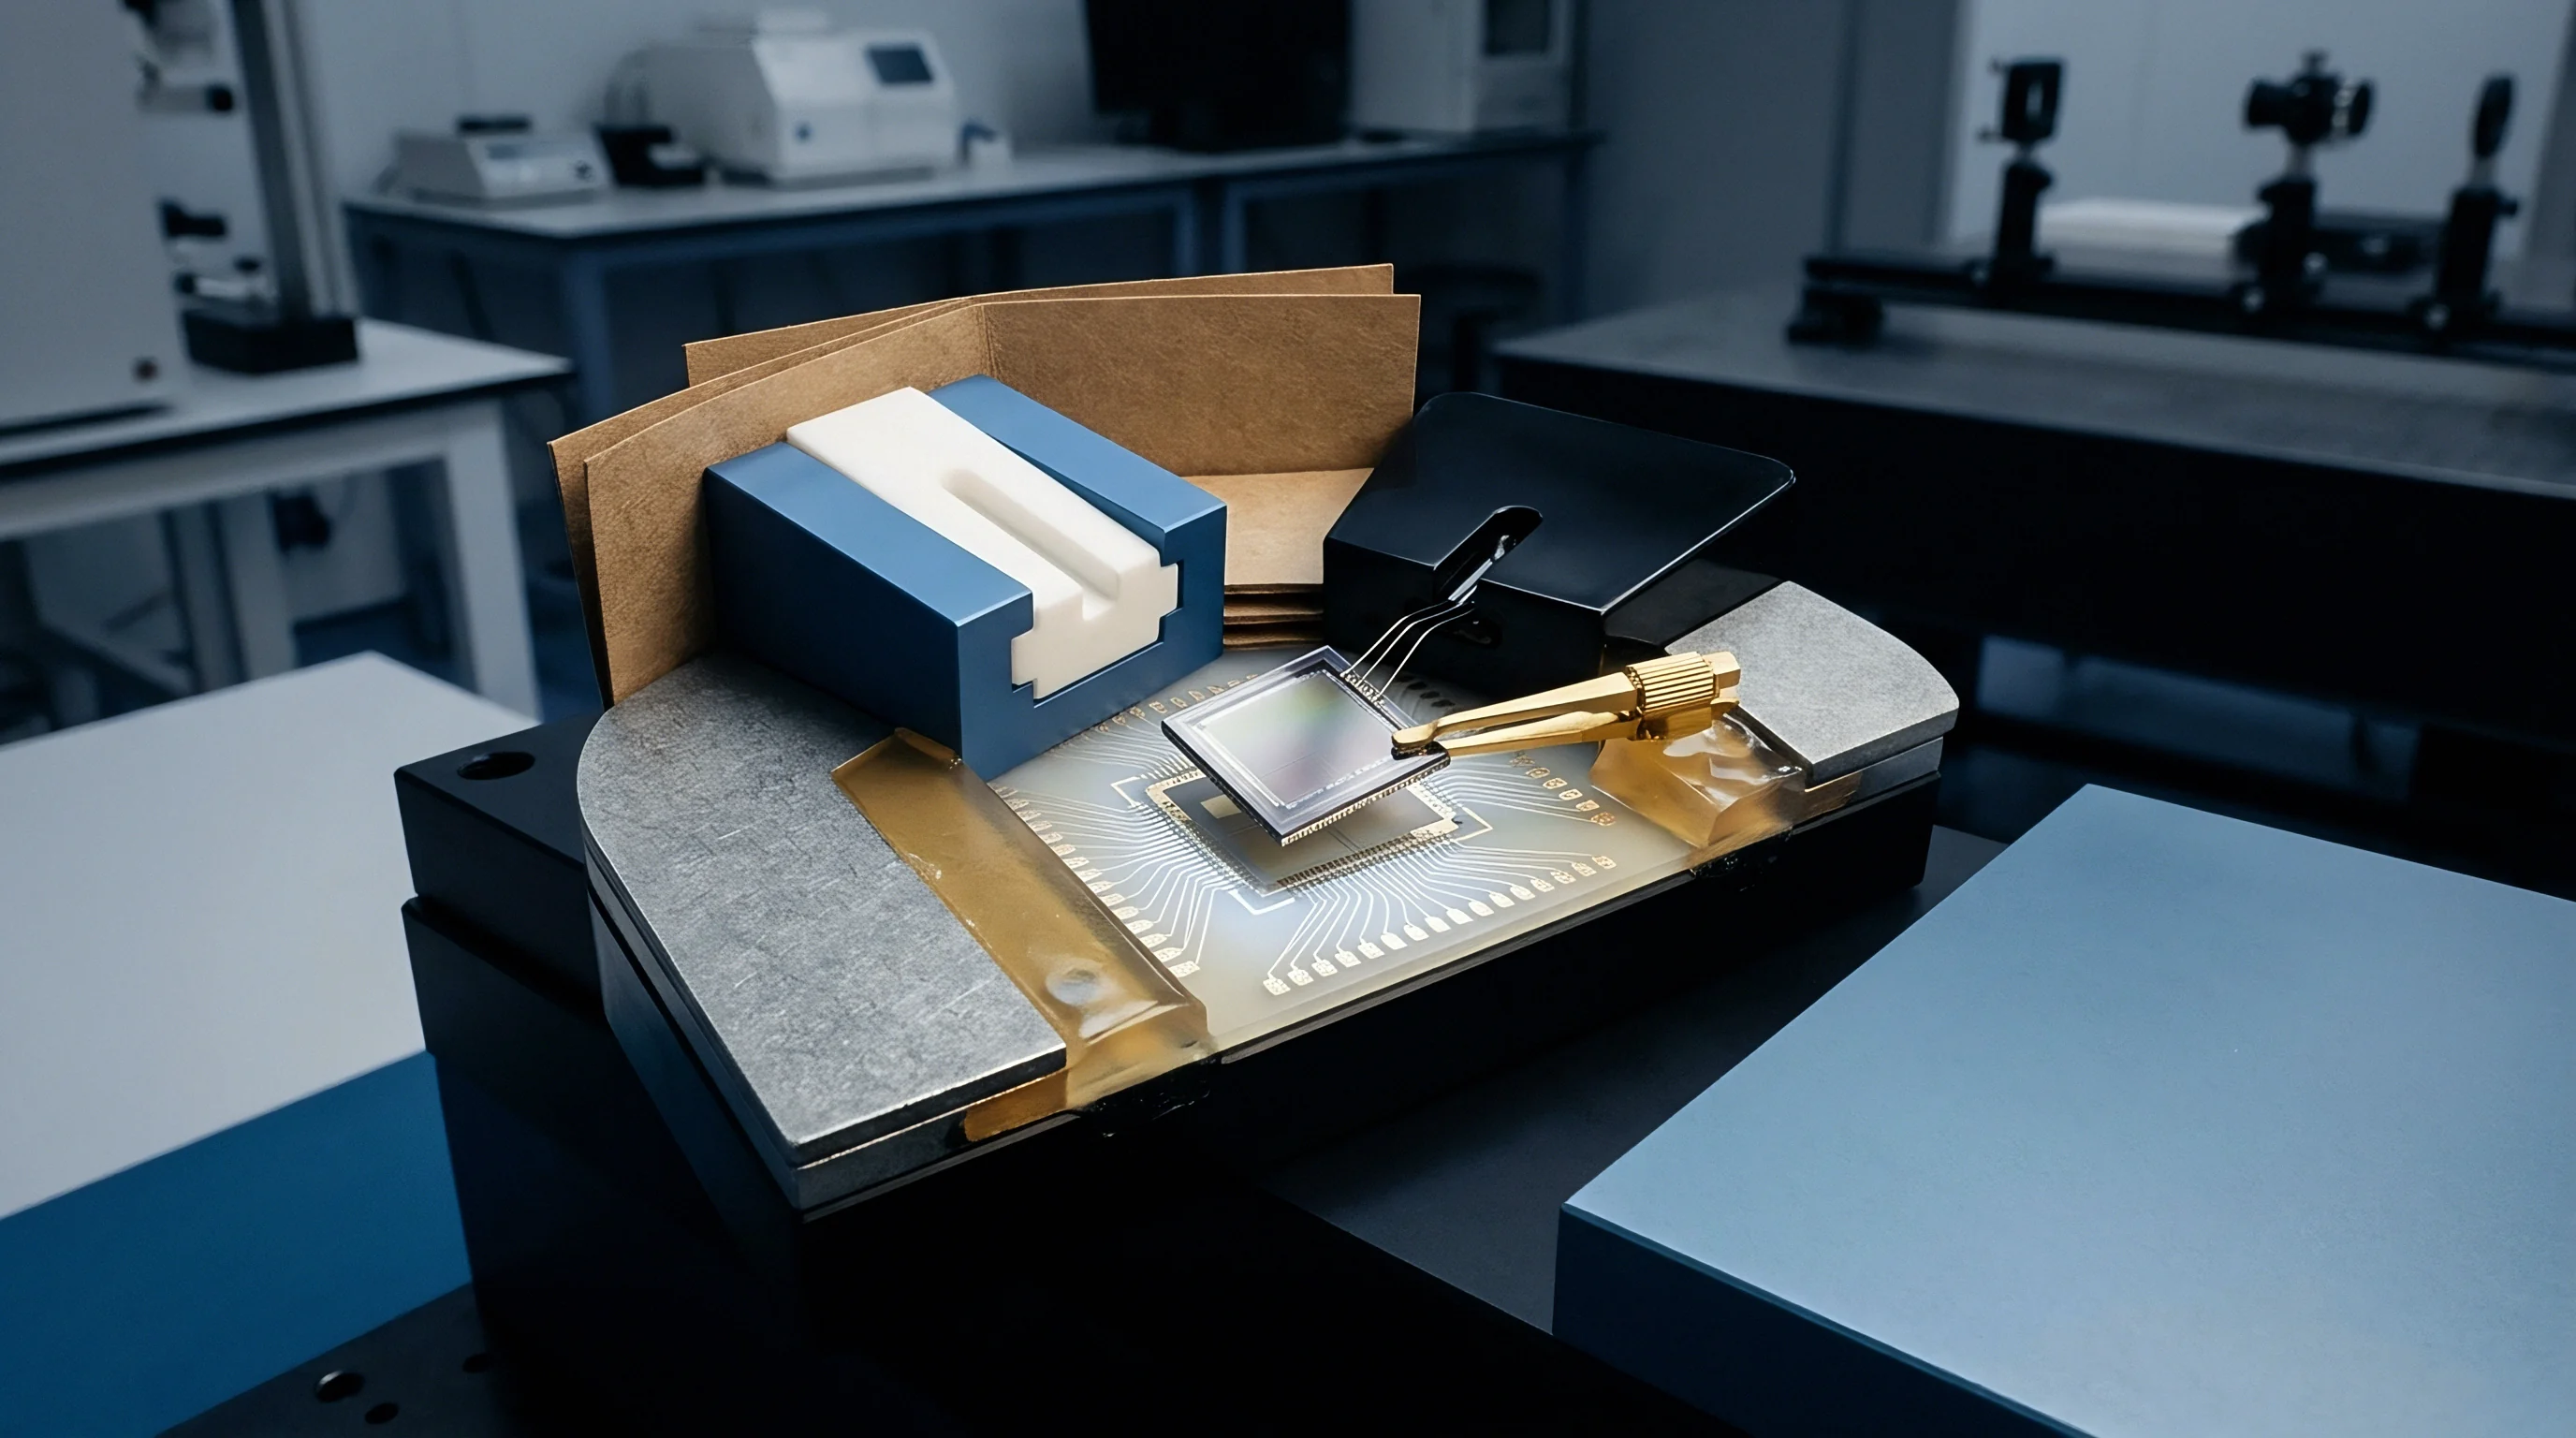
Electrochemical sensors in river monitoring stations suffer rapid baseline wander, mostly caused by liquid boundary instability. Silver and silver-chloride reference electrodes rely on a constant concentration of potassium chloride liquid electrolyte to maintain a predictable half-cell potential of +0.197 V versus standard hydrogen reference at 25 degrees Celsius. In freshwater rivers, ionic strength drops from estuarine values near 0.7 M down to low freshwater levels between 0.001 M and 0.01 M. Across the porous ceramic frit, this steep concentration gradient forces electrolyte cations and anions into the water body at differential diffusion velocities.
Potassium ions move faster than chloride ions into dilute surface waters, generating a liquid junction potential that shifts the apparent sensor reading by tens of millivolts over ninety days of submerged operation.
Electrolyte depletion alters internal chemical equilibria long before hardware actually fails. Single-junction probes holding saturated potassium chloride gel lose ionic strength through liquid-liquid extraction, causing the internal reference potential to drift upward. Double-junction architectures isolate the primary reference cell behind an intermediate chamber filled with potassium nitrate or lower-concentration potassium chloride.
This buffer layer reduces the chemical potential gradient at the outer interface, slowing salt diffusion into the river. Low-ionic-strength river water still extracts salt continuously from the outer chamber, eventually pulling the outer junction potential outside specified tolerances.
Physical fouling of the porous interface makes ionic diffusion even more erratic. Dissolved iron and manganese ions from surface runoff oxidize upon contact with oxygenated river water, precipitating insolubles directly within the microporous ceramic matrix. These oxide deposits plug pore structures, driving electrical junction impedance from an initial 5 kilo-ohms to over 200 kilo-ohms.
High junction impedance converts the reference circuit into an unintended antenna vulnerable to electrostatic interference and ambient ground loop currents. Standard laboratory calibration routines performed in high-ionic-strength buffer solutions mask this field-induced impedance spike. Immersing a high-impedance probe into a standard pH 7.00 buffer solution re-establishes a temporary ionic bridge, concealing the drift that resumes immediately upon returning the instrument to dilute river water.
| Junction Design | Electrolyte Type | Uncertainty Drift Rate (30-Day) | Primary Failure Mode | Field Cleaning Cycle |
|---|---|---|---|---|
| Single Ceramic Frit | 3.5M KCl Gel | +18 mV to +35 mV | Rapid KCl elution into dilute water | 14 Days |
| Double Ceramic Frit | Liquid 3.5M KCl / 1M KNO3 | +4 mV to +9 mV | Outer chamber salt depletion | 30 Days |
| Porous PTFE Sleeve | Polymerized KCl Matrix | +2 mV to +5 mV | Organic bio-film clogging pores | 45 Days |
| Open Annular Capillary | Viscous Viscolene Gel | +8 mV to +14 mV | Particulate ingress and gel dilution | 21 Days |
Choosing the wrong reference junction architecture for soft-water river monitoring corrupts continuous data strings, forcing field teams to invalidate months of environmental telemetry.
Kinetics
Thermal swings in surface water bodies accelerate both chemical oxidation and the mechanical degradation of sensitive ion-selective glass membranes. Arrhenius kinetics dictate that half-cell potential drift rates double for every ten-degree Celsius rise in ambient water temperature due to heightened ion mobility and faster electrolyte leaching through porous ceramic frits. During summer low-flow conditions, thermal stratification exposes benthic and surface sensors to diurnal swings exceeding fifteen degrees Celsius.
Glass electrode membranes dissolve at rates governed by silica hydration dynamics, altering gel layer thickness on the hydrous silicate glass sphere. Non-linear drift accelerates when seasonal bio-layer growth coincides with elevated water temperatures, creating localized anaerobic micro-zones directly against the glass surface.
Quantifying this kinetic acceleration requires breaking total observed drift into distinct offset, span, and thermal hysteresis vectors. Consider a standard gel-filled pH sensor deployed in a temperate river system with a seasonal water temperature rise from 5 degrees Celsius in early spring to 25 degrees Celsius in mid-summer. Assume a baseline lab-certified drift rate of 0.02 pH units per month at 15 degrees Celsius.
Under field conditions, the thermal coefficient of the reference junction contributes an additional zero offset of 0.0015 pH units per degree Celsius offset from 25 degrees Celsius. Furthermore, temperature accelerates gel depletion kinetics exponentially according to an empirical activation energy of 45 kilojoules per mole.
Over a 180-day uncalibrated summer deployment window, baseline kinetic dissolution of the hydrated glass layer causes continuous slope decay, reducing the Nernstian response from an initial 59.16 mV/pH at 25 degrees Celsius down to 54.20 mV/pH. At 5 degrees Celsius, the true Nernstian slope drops naturally to 55.20 mV/pH, but thermal compensation algorithms in budget transmitters frequently assume a constant membrane sensitivity curve. Combining a 12 mV reference junction offset drift with a 5 percent sensitivity span loss generates a total measurement error of 0.42 pH units at pH 8.2, more than four times the standard environmental monitoring threshold of 0.10 pH units.
0.42 pH unit total measurement error accumulates across 180 days of uncalibrated summer deployment at water temperatures reaching 25 degrees Celsius.
Temperature fluctuations also induce thermal hysteresis within the internal Ag/AgCl reference element. When water temperatures shift rapidly during reservoir release events, the internal silver chloride dissolution equilibrium lags behind external solution temperature changes. This thermodynamic thermal lag creates a transient offset drift that lingers for several hours after water temperatures stabilize.
Probes housed in thick polymeric bodies exhibit longer thermal equilibration times, compounding measurement uncertainty during dynamic hydrologic events.
How far can mathematical compensation models stretch recalibration intervals before non-linear chemical degradation of the hydrated membrane renders slope recovery impossible?
Biofilm
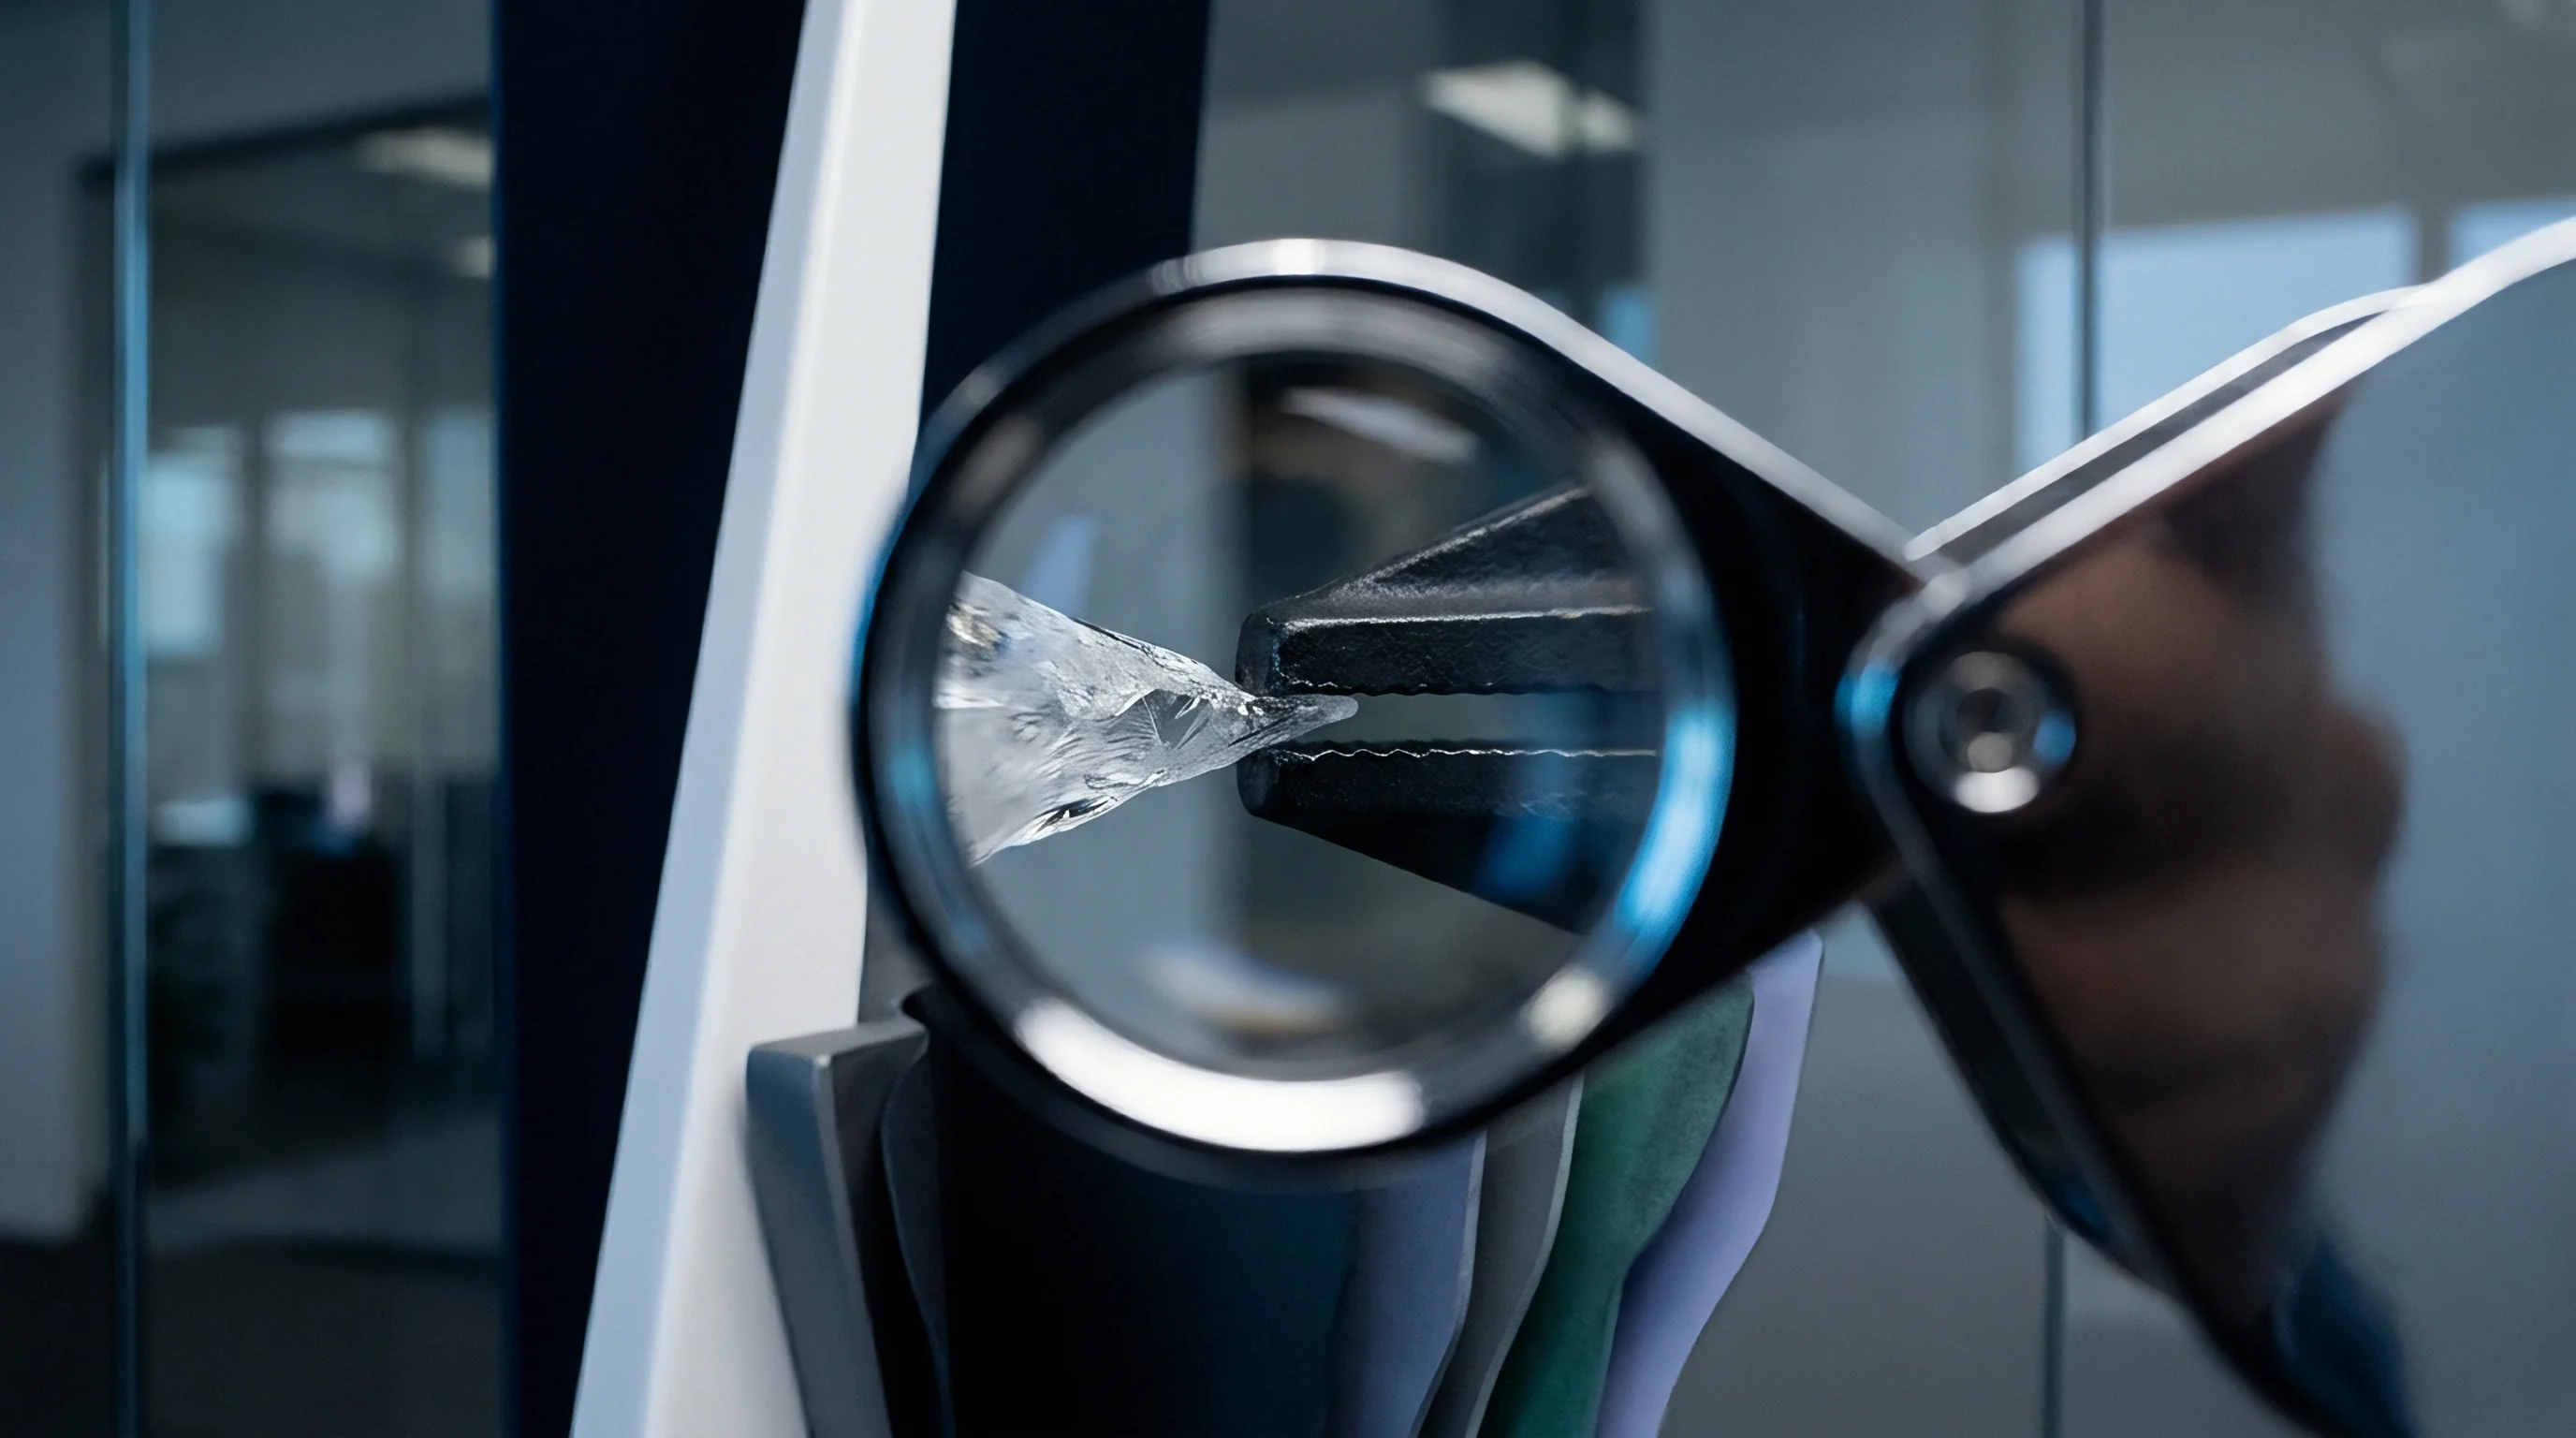
Microorganisms rapidly colonize exposed sensing surfaces, secreting extracellular polymeric substances within forty-eight hours of submerged exposure in nutrient-rich river waters. This organic matrix forms a stationary fluid boundary layer that isolates the active glass or platinum sensing element from bulk flow conditions. Mass transfer of dissolved species across the bio-layer drops significantly, causing amperometric polarographic sensors to report falsely depressed dissolved oxygen concentrations due to local metabolic consumption by sessile heterotrophic bacteria.
Can Secondary Reference Standards Prevent Unobserved Sensor Calibration Decay?
Secondary reference standards deployed alongside automated field monitors provide an independent audit trail for bio-fouling onset. Continuous bio-layer accumulation alters the micro-environment at the sensor surface, decoupled from the turbulent bulk water column. In pH and oxidation-reduction potential sensors, bacterial respiration within the bio-film matrix alters local hydronium ion activity and redox states.
Localized respiration lowers pH relative to bulk water by up to 0.8 pH units in high-nutrient rivers, while sulfur-reducing bacteria in anaerobic inner layers produce hydrogen sulfide that poisons silver-chloride reference elements by forming insoluble silver sulfide coatings.
- Boundary Layer Resistance increases mass transfer resistance, creating artificial signal lag during rapid river chemical changes.
- Metabolic Micro-zones alter local hydronium ion concentration, causing regional pH shifts isolated from bulk flow.
- Sulfide Poisoning converts silver-chloride reference pins into silver sulfide, inducing permanent baseline offsets.
- Mechanical Wiper Damage drives abrasive particulate matter into soft glass membranes, degrading slope response.
Fouling mitigation strategies balance mechanical surface clearance against sensor longevity. Automated wipers remove organic growth effectively but introduce mechanical stress. Repeated wiper cycles across abrasive silt-laden river water create microscopic scratches on pH glass spheres and optical dissolved oxygen windows.
Micro-scratches expand the effective surface area for microbial attachment and scatter optical signals, accelerating baseline drift between cleaning cycles. Passive anti-fouling guards constructed from high-copper alloys release cupric ions that inhibit bio-layer formation, yet copper leaching rates decline rapidly once an oxide patina coats the guard surface.
ISO 15839 specifies dynamic response time and drift determination methods for continuous water quality monitoring equipment.
Laboratory evaluations confirm rapid signal decay within twenty days of bio-film establishment, despite nominal ratings of zero drift across six-month intervals.
Field
In-situ validation routines demand systematic field procedures to separate genuine aquatic quality changes from sensor performance degradation. Field technicians utilize secondary transfer standards calibrated against certified reference materials in an ISO/IEC 17025 accredited laboratory immediately prior to site visits. Grab sampling for laboratory analysis provides an independent reference, though sample handling errors and temporal lag between field extraction and bench testing frequently introduce measurement uncertainties larger than the sensor drift itself.
Executing an effective field calibration verification demands strict adherence to sequential operational steps.
- Clean the sensor body and active sensing surface with deionized water and a soft non-abrasive lint-free cloth to remove loose organic silt.
- Inspect the reference junction porous frit under magnification for iron oxidation, black sulfide staining, or physical micro-fractures.
- Immerse the unadjusted probe into a fresh transfer standard solution held at river temperature until thermal equilibrium is achieved.
- Record the raw millivolt output prior to applying software calibration offsets to preserve historical drift rate tracking.
- Perform a two-point or three-point slope adjustment using primary buffer standards spanning the operational range of the river system.
- Document the calculated slope percentage and zero offset millivolts in the instrument maintenance ledger before redeployment.
Field verification routines encounter multiple operational error sources that skew recalibration results if uncorrected. Temperature mismatch between calibration buffers and river water introduces thermal shock, driving transient reference offsets. Chemical contamination of buffer solutions occurs when technicians carry over river water on un-rinsed probes.
Evaporation alters buffer concentration when standard bottles remain open in warm field vehicles. Expiration of low-ionic-strength buffers accelerates pH shifts through ambient carbon dioxide absorption.
- Thermal Discrepancy between calibration standards and river water causes transient reference potential instability.
- Buffer Contamination from dirty field probes shifts standard solution values, introducing systematic offsets.
- Carbon Dioxide Absorption lowers the pH of un-buffered pure water standards exposed to ambient air.
- Improper Grounding creates ground loops between field meters and river potential, corrupting raw millivolt readings.
| Parameter | Primary Drift Vector | Acceptable Offset Limit | Recalibration Trigger | Audit Standard Traceability |
|---|---|---|---|---|
| pH / ORP | Junction depletion & frit clogging | ±0.1 pH / ±15 mV | Slope < 92% Nernstian | NIST NIST-traceable IUPAC buffers |
| Dissolved Oxygen (Optical) | Luminophore dye degradation | ±0.2 mg/L | Span error > 5% | Air-saturated water standard |
| Conductivity (4-Electrode) | Fouling of cell constant geometry | ±2% of reading | Cell constant shift > 3% | KCl electrolytic standards |
| Turbidity (Optical Pass-Through) | Optical window bio-film coating | ±0.5 NTU | Zero drift > 1.0 NTU | Formazin primary suspension |
Field calibration standards require thermal equilibration to river temperature prior to adjusting instrument offsets.
Data collected from probes exhibiting slope responses below ninety percent of theoretical Nernstian output must be flagged as unverified and excluded from regulatory compliance filings under contractual framework rules.
Outlay
Financial modeling of aquatic monitoring networks demonstrates that initial hardware procurement represents less than twenty percent of total three-year operational expenditures. Frequent field servicing trips to clean fouled junctions and execute multi-point recalibrations dominate continuous operational budgets. Specifying low-cost industrial probes increases total lifecycle expenditure due to accelerated recalibration cycles necessitated by rapid reference drift.
High-tier sensor housings incorporating automated mechanical wipers and solid-state reference matrices double front-end procurement costs but extend field maintenance intervals from bi-weekly to quarterly.
| Performance Tier | Initial Unit Cost | Annual Field Visits | Replacement Cycle | 3-Year Landed Cost |
|---|---|---|---|---|
| Basic Industrial (Gel-Filled) | $450 | 26 Visits | 12 Months | $14,850 |
| Mid-Tier Field Probes | $1,200 | 12 Visits | 18 Months | $8,600 |
| Advanced Solid-State (Wiper Included) | $3,800 | 4 Visits | 36 Months | $6,200 |
| Assumes a technician field trip cost of $250 per site visit, including vehicle fuel, labor, and calibration consumables. | ||||
Grade selection directly dictates data reliability and overall project cost. Basic gel-filled electrodes incur low capital expenditure but require bi-weekly manual intervention to prevent unacceptably high measurement drift. Solid-state sensors utilizing polymer reference matrices eliminate liquid junctions entirely, preventing electrolyte dilution and iron oxide clogging.
Integrating automated cleaning mechanisms lowers labor allocations while reducing the risk of data invalidation caused by unobserved bio-fouling drift.
A worked cost comparison illustrates the total commercial impact of sensor drift choices. Deploying a ten-station river monitoring network with basic gel-filled sensors incurs $4,500 in initial hardware expense. Annual field servicing across ten sites at bi-weekly intervals generates $65,000 in labor and travel costs, combined with $4,500 in annual sensor replacement costs due to junction depletion.
Over three years, the basic network costs $213,000. Transitioning to advanced solid-state sensors with mechanical wipers increases initial hardware costs to $38,000. However, quarterly servicing reduces annual field trip expenses to $10,000, while extended sensor lifespans eliminate premature replacements.
The advanced network lands at $68,000 over three years, delivering a net saving of $145,000 while maintaining superior data confidence.
Initial sensor purchase price is inversely proportional to long-term ownership expenditure in continuous river monitoring networks.
Selecting sensor grade based on initial capital cost rather than verified field drift rate inevitably inflates long-term operational expenditures.